EXPLAIN (ANALYZE, BUFFERS) ...are your favorite tool for learning about the peculiarities of this DBMS, then new useful "chips" of our service for visualization and analysis of plans explain.tensor.ru will certainly be useful to you in this difficult task.
But let me remind you right away that without a full-fledged comprehensive monitoring of the PostgreSQL database, using only plan analysis is acting from the position of sage # 5!

[ source KDPV , "The Blind and the Elephant" ]
, 1940
, ,
.
,
,
, .
, —
.
,
:
—
!
,
,
, ,
.
,
,
,
.
Strife arose among the blind
And lasted a whole year.
Then the blind
men finally put their hands in motion.
And since the fifth was strong,
- He closed the mouth of everyone.
And now the elephant consists of
one tail!
So, today in the program:
- change "chevrons" to "shoulder straps"
- we bring together "mega" plans
- we keep a personal archive
- studying the genealogy of plans
- peering into the "windows"
Not a single color!
Historically, when viewing the plan, we marked the "hottest" nodes with a vertical "chevron" to the left of the value - the higher the value, the richer the color.

But in such a model, the ratio of values is poorly perceived - for example, a deviation of 30% in the difference in shades can only be noticed by a trained eye. Therefore, we made a histogram from horizontal "shoulder straps".

Useful statistics for "mega" plans
Many people do not notice the “Statistics” tab of the plan, here it is on the right:

And whoever noticed - hardly actively used it. We decided to correct this omission and make it really useful for the analysis of "large" plans (100+ nodes).
Grouping nodes
All "identical" plan nodes (that is, those with the same node type, table used, and index) are grouped into one table row. In this case, all their indicators (execution time, the number of read and discarded records, the total number of passes and the amount of data read) are summed up.
And for clarity, each node type carries a color label:
- red - reading data
nodesSeq Scan,Index Scan,CTE Scanand various other... Scan - yellow - data processing
nodesSort,Unique,Aggregate,Group,Materialize, ... - green - connection
nodesNested Loop,Merge Join,Hash Join, ...

Sorting by any indicator
If suddenly you need an analysis not by the total time, but by the type of node, for example - just click on the column header - and everything will be:

Contextual node hint
To understand in detail the contribution of a specific node in the group, hover over the number of any of them - and you will see the traditional hint of what exactly happened there:

Personal archive of plans
"Without registration and SMS!"If you actively use our service, now it will be much easier to find your previously analyzed plans - just switch to the "mine" tab in the archive . Plans fall here regardless of publication in the general archive and are visible only to you.

Genealogy of plans
It used to be quite difficult to find any specific of your plans in the archive, now it is simple. They can be named and grouped into an optimization “family tree”!
Just specify a name when adding a plan:

... or on an existing plan, you can set it, edit or add a linked plan:

Then you can quickly switch throughout the tree of options in order to evaluate the effect of certain optimizations:

And if a link to a specific plan suddenly lost, he can be easily identified by his name in his personal archive:

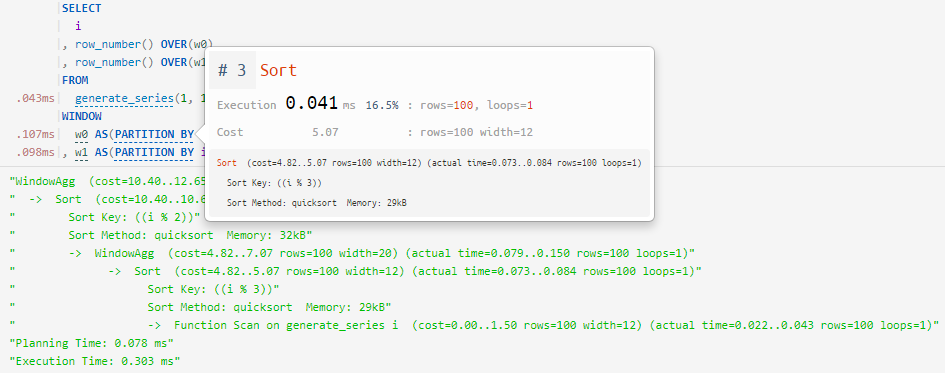
We peer into the "windows"
A small but useful improvement to the Query Profiler , which I wrote about earlier - we taught it to "look into windows" and correctly map to plan nodes:
->  WindowAgg   ==>  WINDOW / OVER
      ->  Sort  ==>    PARTITION BY / ORDER BY
... as several independent definitions of "window" (
WINDOW) within a single query:

... and sorting in window functions without an explicit definition:

Happy hunting for various inefficiencies!