Customer needs can be expressed by the following characteristics of the desired profiler:
- have a performance analysis tool for a specific set of architectures;
- be able to do in-depth analysis of performance up to instructions in disassembled code;
- have a means of viewing and working with the output of disassembled code in a convenient GUI for such a set of architectures - x86_64, ARMv7, ARMv8.
That is, a profiler was required, which should:
- be cross-platform;
- be able to generate a disassembler for functions for architectures from this set - x86_64, ARMv7, ARMv8;
- display results and interact with the user through the GUI and maintain usability.
To meet the needs of the customer, we have developed a new system component - a cross-platform disassembler with code generation for x86_64, ARMv7, ARMv8 (functionality and GUI for working with its output).
Let's look at an example of a simple demo of C ++ code on Hotspot in action and the performance analysis capabilities it provides. Example:
cat demo.cpp:
#include <iostream>
int g (int arg) {
    return abs(rand()) * arg;
}

int f() {
    int i = 1;
    int res = 1 ;

    std::cout << abs(rand()) << std::endl;
    while (i < 1000000) {
        res += i * g(res);
        i++;
    }
    std::cout << res << std::endl;
    return res;
}

int main() {
    std::cout << f() << std::endl;
    return 0;
}
We compile, build our demo application:
g++ demo.cpp -o demoLaunch our profiler:
./hotspotStep 1 - collect and write data to the perf.data file.
This can be done in two ways - from the command line using an explicit call to perf
record -o /home/demo/perf.data --call-graph dwarf ./demoOr using Hotspot menu File-> Record Data.
For our demo, we collect events of the cycles type, but you can set any other or a set of event types (cache-misses, instructions, branch-misses, etc.)

Click Start Recording, wait for the View Results to light up:

Diving into the world of performance analysis.
Here we will find summary information and champions among consumers of the runtime of our demo.

Chains of calls in both directions - from the called to the calling method (Bottom Up) and vice versa (Bottom Down) with times (weights).


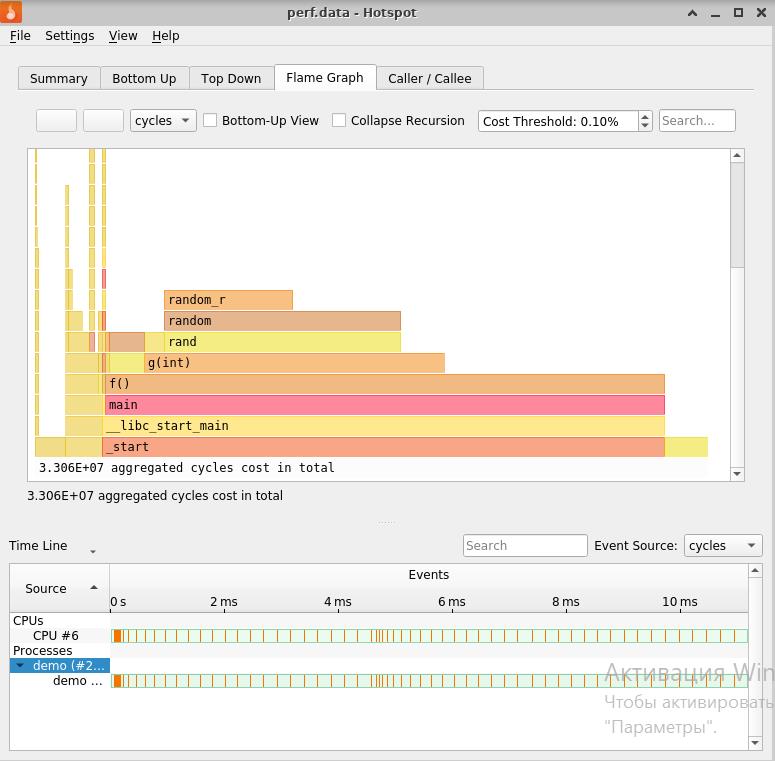
Flame Graph and data on performance, execution time for each
function / method that is significant to it.
To get more detailed information about the function we are interested in, with the distribution of events inside it (up to instructions of the disassembled code), click Disassembly item of the context menu. It opens by right-clicking on the function you like:

Now we know everything about this function!

You can navigate the call stack. Double click on a blue highlighted call instruction. And before us is a disassembler for the called function g (int). The CPU-consuming instruction has no competitors here.

Ctrl + B, Ctrl + D - and we also have machine codes of commands, and the disassembler was generated using objdump. In the previous cases, I showed the code produced by calling perf annotate.

The Back button is lit up, you can move along the call stack in both directions!
Go to the instruction with the address 1236 and double-click on the instruction with the address 124f. And again, the transition back to the instruction with the address 1236 is available.

Ctrl + B, Ctrl + I switches us to Intel assembler syntax: We will be

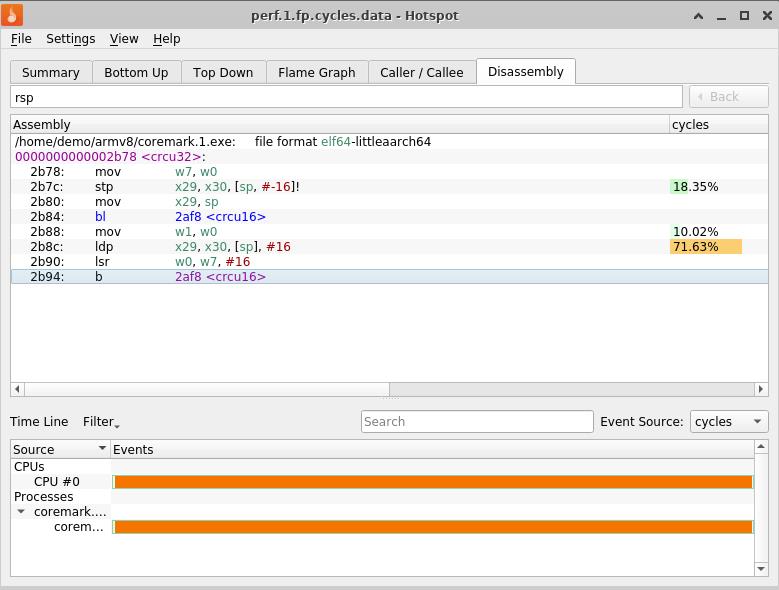
glad to the opportunity to search for text by the entered pattern, for example, using the% rsp register:

And ... without leaving the place, we move to ARM ... To do this, we will need, basically, two entities - the executable file of the user application, compiled on ARM, and the perf.data file for it, recorded there. In our demo, these are coremark.1.exe and perf.1.fp.cycles.data built on ARMv8. We put them in / home / demo / armv8 / and load perf.data -


Thus, we not only completed the tasks set by the customer, but also overfulfilled them - in particular, the calculation and display of the distribution of events according to the instructions of the disassembler allows us to do in-depth analysis up to an instruction that can be linked to a string in the code, the program has a GUI - a user-friendly interface with cross-profiling settings.
Linux perf gui Hotspot is distributed under the terms of the GNU General Public License by agreement with our partners. In other words, we grant all interested users the right to copy, modify and distribute this profiler program free of charge.
It is hosted on GitHub along with instructions for downloading and installing . Everyone can get acquainted with it and appreciate it.
We invite you, taking Linux Perf GUI (Hotspot) to the guides, on an exciting journey through your application and the peculiarities of its work, plunge into the elite atmosphere of assembly teams, visit various architectures and much more.