
In this article, we will not dwell on the legal aspects of the submitted notifications about a CFC, about participation in a CFC, we will consider the technical side of the issue.
Undoubtedly, if the holding in question presents itself as simple structures of the type LLC-> KIK-> Russian, then it is impractical to build something here with the involvement of a machine, it is another matter if the structure branches, doubles and there is no number of these interweaving.
Let's take a look at several existing graphics solutions that will simplify your work.
For ease of visualization, the jupyter notebook and python environment will be used.
Networkx
This solution is the oldest of those presented and cannot boast of its interactivity. There is the same ancient article about this package on Habré.
However, the old does not mean bad, and this option is one of the most successful in terms of drawing and computing.
Install and import the module via jupyter:
!pip install networkx
import networkx as nx
We also import other add. modules that will help you draw shapes:
from matplotlib import pyplot as plt
%matplotlib inline
plt.rcParams.update({
    'figure.figsize': (7.5, 7.5),
    'axes.spines.right': False,
    'axes.spines.left': False,
    'axes.spines.top': False,
    'axes.spines.bottom': False})
Let's build the first network using networkx:
from pathlib import Path
data_dir = Path('.') / 'data'
# Read edge list
G = nx.read_edgelist('example.edgelist')
# Draw network
#pos = nx.spring_layout(G)
pos = nx.spectral_layout(G)
#pos = nx.planar_layout(G)
nx.draw_networkx(G, pos)
plt.gca().margins(0.15, 0.15)
Here's what happened:
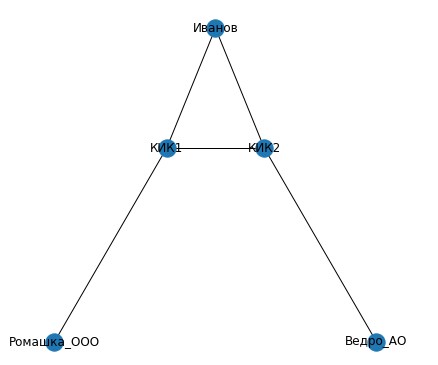
As you can see, Ivanov owns two CFCs, which, in turn, own Russian legal entities. by persons.
Let's analyze the code above.
We imported the module and specified where we will read the data on the disk from:
from pathlib import Path
data_dir = Path('.') / 'data'
The current directory was considered 'example.edgelist':
G = nx.read_edgelist('example.edgelist')* example.edgelist is a plain text file like this:
# source target
 1
 2
1 2
1 _
2 _
The values are recorded by someone with a space between them.
Next, we determined how the network will look like:
pos = nx.spectral_layout(G)
If we change to pos = nx.spring_layout (G), then it will take the form:
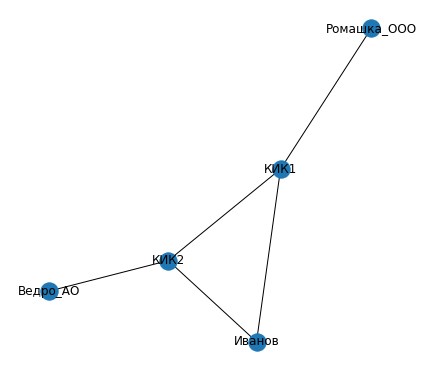
And this arrangement, oddly enough, is most suitable for larger structures.
Finally, we drew the net, marking the indents:
nx.draw_networkx(G, pos)
plt.gca().margins(0.15, 0.15)
It's easy to save a picture:
plt.savefig('plot.png')
How to draw a segment in networkx
#
H = G.subgraph(['', '1', '_'])
plt.subplot(212)
print(":")
nx.draw_networkx(H)
We didn't
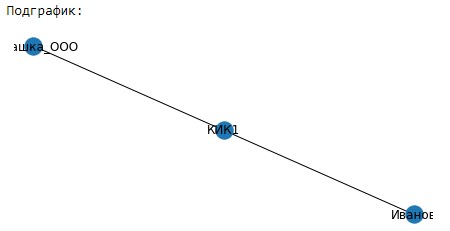
indent here, and the names "left": Networkx operates with the concepts of nodes and links between them. In our situation, the nodes are Ivanov, KIK1, KIK2, Romashka_OOO, Bucket_AO. And the links are what is in the example.edgelist file.
You can simply view both of these by referring to the G.nodes and G.edges methods:

Directional graph in networkx (Directed edge list)
Let's clarify the constructed network a little, add arrows:
# Read edge list
G = nx.read_edgelist(
    str('example.edgelist'),
    create_using=nx.DiGraph)
pos = nx.spectral_layout(G)
# Draw network
nx.draw_networkx(G, pos, arrowsize=20)
plt.gca().margins(0.15, 0.15)
Small changes made it possible to paint a clearer picture of who owns whom:
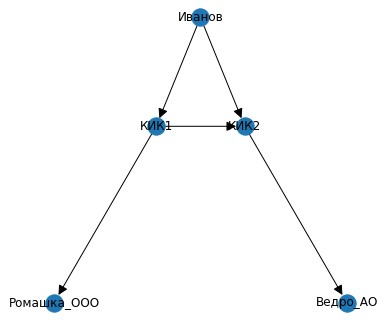
In the code, as you can see, the changes are minimal.
The next step is to build a graph where the size of the ownership packages will be visible.
To do this, you need to get acquainted with the concept of weight (weight) is the third main parameter that networkx can work with. To include it in work, you need to add these same weights to a text file, for example:
# source target
 1 100
 2 100
1 2 50
1 _ 100
2 _ 100
Now let's rebuild the network using the weights and mark them on the graph:
# Read edge list
G = nx.read_weighted_edgelist(
    str('example2.edgelist'))
# Extract weights
weights = [d['weight'] for s, t, d in G.edges(data=True)]
nx.draw_networkx(G,pos)
labels = nx.get_edge_attributes(G,'weight')
nx.draw_networkx_edge_labels(G,pos,edge_labels=labels)
plt.gca().margins(0.15, 0.15)
* example2.edgelist is the file that is generated above with weights.
Let's get the following picture:

Who owns whom and how, networkx
Now, as lawyers-programmers, we need to understand in what sequence and in what amount Ivanov owns, for example, Bucket_AO, and whether he owns it at all. This is required in order to determine the fact of ownership in the branched holding and all the chains to the target LLC (JSC), so that later these chains can be registered in the CFC notification.
With networkx, you can do this as follows:
list(nx.all_simple_paths(G,'', '_'))The first argument is the owner node, the second is the node to which we will build paths.
Using this method, you can see that Ivanov's Bucket_AO belongs to the following chains:
[['', '1', '2', '_'], ['', '2', '_']]
This is graphically confirmed.
You can find out the share of ownership by multiplying the weights between the corresponding nodes: 1 * 0.5 * 1 = 0.5, 1 * 1 = 1. Share over 25%, notification must be submitted.
In the code, multiplication is done with the following crutches (a more elegant method has not yet been found):
x=0
b=0
c=[]
for i in list(nx.all_simple_paths(G,'', '_')):
    for a in i:
        if x>len(i)-2:
            pass
        else:
            b=int(nx.bidirectional_dijkstra(G, i[x],i[x+1])[0])#
            x+=1
            c.append(b/100)
print(c)
import numpy as np
print(np.prod(c))
x=0
b=0
c=[]
for i in list(nx.all_shortest_paths(G,'', '_')):
    for a in i:
        if x>len(i)-2:
            pass
        else:
            b=int(nx.bidirectional_dijkstra(G, i[x],i[x+1])[0])#
            x+=1
            c.append(b/100)
print(c)
import numpy as np
print(np.prod(c))
In the first case, it will display a fraction of 0.5, in the second 1.
What other visualization options are available? For example, Netwulf.
Netwulf
The documentation is here .
The network itself is interactive, this is its main advantage. After installing the python package, let's build the network:
import netwulf as nw
plt.figure(figsize=(200,200))
G = nx.read_weighted_edgelist(str('example2.edgelist'),create_using=nx.DiGraph)
pos = nx.spring_layout(G)
nw.visualize(G)
After running the code, jupyter freezes, and in an additional browser window that opens, you can see the result:
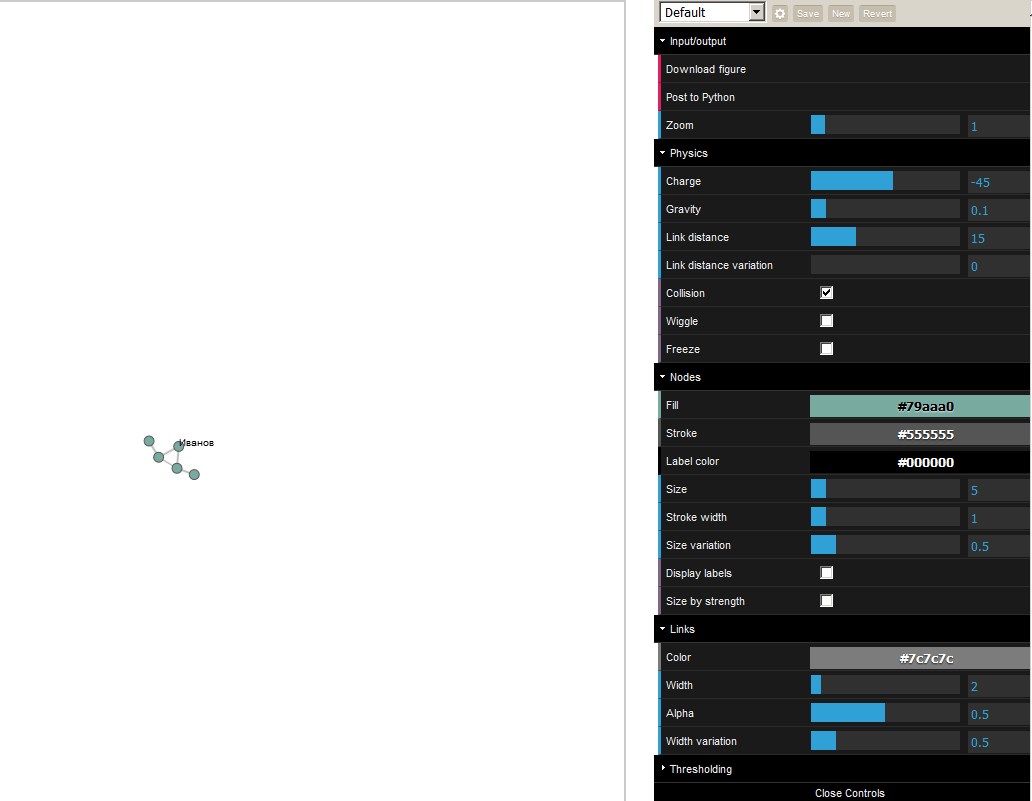
On the right side of the panel, you can see the options, the change of which affects the built network online.
The disadvantage of this package is that it is not yet possible to display the weights and arrows between the nodes, but the authors promised to refine it.
* to return to jupyter, you need to click on the "post to python" option:

Another good option for such visualization for python is the young webweb project.
Webweb
The documentation is here .
The network is built in a similar way:
from webweb import Web
web = Web(title='kitchen_sink')

web.display.networkName = 'tree'
web.display.networkLayer = 2
web.display.colorBy = 'ring'
web.display.sizeBy = 'degree'
web.display.gravity = .3
web.display.charge = 30
web.display.linkLength = 15
web.display.colorPalette = 'Greens'
web.display.scaleLinkOpacity = False
web.display.scaleLinkWidth = True

from pathlib import Path
data_dir = Path('.') / 'data'
# Read edge list
G = nx.read_edgelist('example.edgelist',create_using=nx.DiGraph)
plt.figure(figsize=(200,200))
# Draw network
pos = nx.spring_layout(G)
Web(list(G.edges)).show()

Of the clear advantages over netwulf: the ability to highlight key nodes with color, text search for nodes with highlight on the network: In

summary, we can say that the developing descendants of networkx - netwulf and webweb are good for building a quick picture of the structure of a small holding. Both modules have a freeze mode to freeze nodes that stick together due to the interactivity of the graph. However, even using them, it is not easy to work with large-scale structures, where the number of nodes is more than 200.
"Pedestal" from the Ministry of Finance, cross and ring ownership
Everything would be very good when constructing such structures, if not for one thing that spoils the whole picture. This, however, lies in the fact that the holdings of the company own themselves through other legal entities. faces and this is called either cross or ring ownership.
In the pictures in letters from the Ministry of Finance (for example, from 02.07.2013 -4-13 / 11912) it looks like this.
Cross-Ownership:

Ring-

shaped : Let's see how networkx defines the links for the cross-ownership scheme of D's participation in B.
Let's create an edgelist with links:
# source target
D B 45
B A 40
A B 55
E A 60
Having built a network with weights, you can see that the feedback between A and B is not reflected:

It can be seen if you build a network without weights, with arrows:

What about the calculations? What is the cumulative share of D in B?
Everything seems transparent here, 45%
And networkx gives out with the command list (nx.all_simple_paths (G, 'D', 'B')):
[['D', 'B']]
But not everything is so simple.
The Ministry of Finance says the total share of D in B is determined by the formula:

And will be 57.69%.
What to do? networkx is powerless?
Not at all, networkx will reveal such situations, but the calculation formula will be different, according to the “letter of the Law”.
The problem can be partially resolved by adding
AA
BB entries to the edgelist
Further, with the command list (nx.nodes_with_selfloops (G)), you can view the nodes with participation in themselves, but this is still not taken into account when determining the paths from D to B.
jupyter notebook download - here .