Therefore, in addition to WAF, we use ELK . It helps to collect all events in one place, accumulates statistics, visualizes it and allows us to see the targeted attack in time.
Today I will tell you in more detail how we crossed the “Christmas tree” with WAF and what came of it.
The story of one attack: how everything worked before switching to ELK
In our cloud, the customer has deployed the application behind our WAF. From 10,000 to 100,000 users connected to the site per day, the number of connections reached 20 million per day. 3-5 of them were cybercriminals and tried to hack the site.FortiWeb blocked a regular brute force form from one IP address quite easily. The number of visits to the site per minute was higher than that of legitimate users. We simply set up activity thresholds from one address and repelled the attack.
It is much more difficult to deal with "slow attacks" when attackers act slowly and disguise themselves as regular clients. They use many unique IP addresses. Such activity did not look like massive brute force for WAF, it was more difficult to track it automatically. And there was also the risk of blocking normal users. We looked for other signs of an attack and set up a policy to automatically block IP addresses based on that attribute. For example, many illegitimate sessions had common fields in the http request headers. I often had to manually search for such fields in the FortiWeb event logs.
It turned out long and inconvenient. In the standard FortiWeb functionality, events are recorded in text in 3 different logs: detected attacks, information about requests, and system messages about WAF operation. Dozens or even hundreds of attack events can come in a minute.
Not so much, but you have to manually climb through several logs and iterate over many lines:

In the attack log we see user addresses and the nature of activity.
It is not enough to simply scan the log table. To find the most interesting and useful information about the nature of an attack, you need to look inside a specific event:
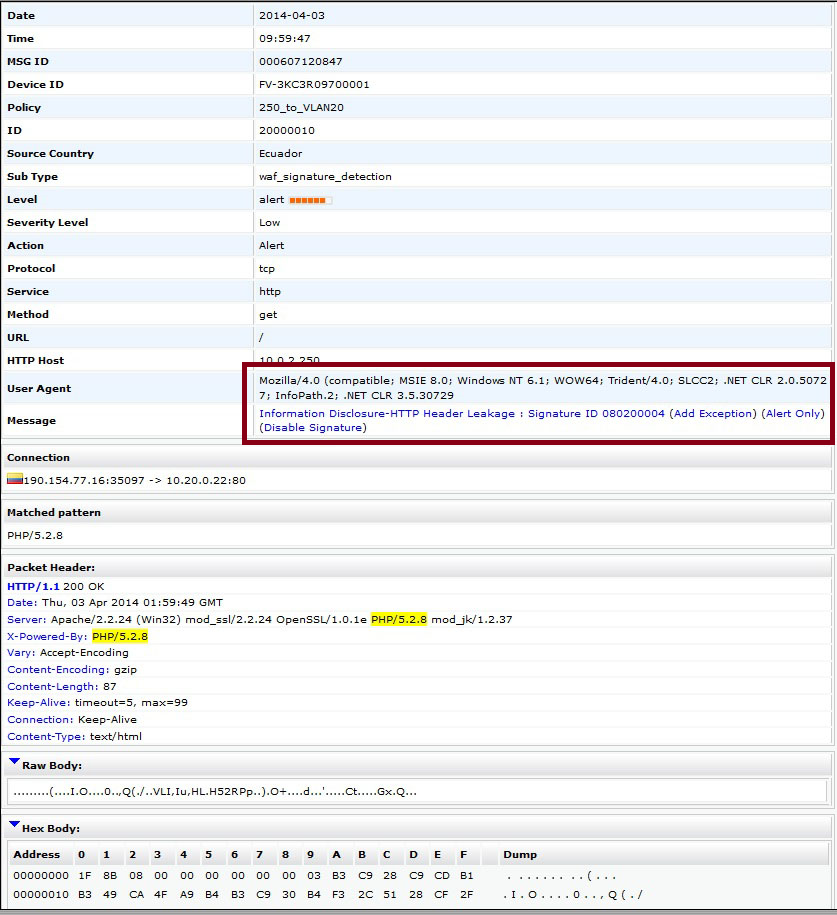
Highlighted fields help to detect a "slow attack". Source: screenshot from Fortinet website .
Well, the most important problem is that only a FortiWeb specialist can figure it out. If during working hours we could still track suspicious activity in real time, then the investigation of night incidents could drag on. When FortiWeb policies for some reason did not work, the night shift engineers on duty could not assess the situation without access to the WAF and woke the FortiWeb specialist. We looked through the logs for several hours and found the moment of the attack.
With such volumes of information, it is difficult to understand the big picture at a glance and act proactively. Then we decided to collect data in one place in order to analyze everything in a visual form, find the beginning of the attack, identify its direction and blocking method.
What did you choose from
First of all, we looked at the solutions already used, so as not to multiply entities unnecessarily.
One of the first options was Nagios , which we use to monitor engineering infrastructure , network infrastructure , and alert about emergency situations. Security officers also use it to notify attendants in case of suspicious traffic, but it does not know how to collect scattered logs and therefore disappears.
There was an option to aggregate everything using MySQL and PostgreSQL or another relational database. But in order to pull out the data, you had to sculpt your application.
Our company also uses FortiAnalyzer as a log collector .from Fortinet. But in this case, he also did not fit. First, it is more tailored to work with the FortiGate firewall . Secondly, many settings were lacking, and interaction with it required excellent knowledge of SQL queries. And thirdly, its use would increase the cost of the service for the customer.
That's how we came to open source in the person of ELK .
Why choose ELK
ELK is an open source software package:
- Elasticsearch is a time series database that was just created to work with large amounts of text;
- Logstash is a data collection engine that can convert logs to the desired format;
- Kibana is a good visualizer as well as a pretty friendly interface for managing Elasticsearch. You can use it to build graphs that can be watched by the engineers on duty at night.
The ELK entry threshold is not high. All basic features are free. What else is needed for happiness.
How did you put it all into a single system?
We generated indices and left only the information we needed . We loaded all three FortiWEB magazines into ELK - the output was indexes. These are files with all collected logs for a period, for example, a day. If we immediately visualized them, we would only see the dynamics of attacks. For details, you need to "fall" into each attack and look at specific fields.

We realized that first we need to set up the parsing of unstructured information. We took long fields as strings like “Message” and “URL” and parsed them to get more information for making decisions.
, . - . , 2 .
After parsing, they began to look for what information to store and visualize. It was not advisable to leave everything in the journal: the size of one index was large - 7 GB. ELK took a long time to process the file. That said, not all of the information was helpful. Something was duplicated and took up extra space - it was necessary to optimize.
At first, we just looped through the index and removed unneeded events. It turned out to be even more inconvenient and longer than working with magazines on FortiWeb itself. The only plus from the Christmas tree at this stage is that we were able to visualize a large period of time on one screen.
We did not despair, we continued to
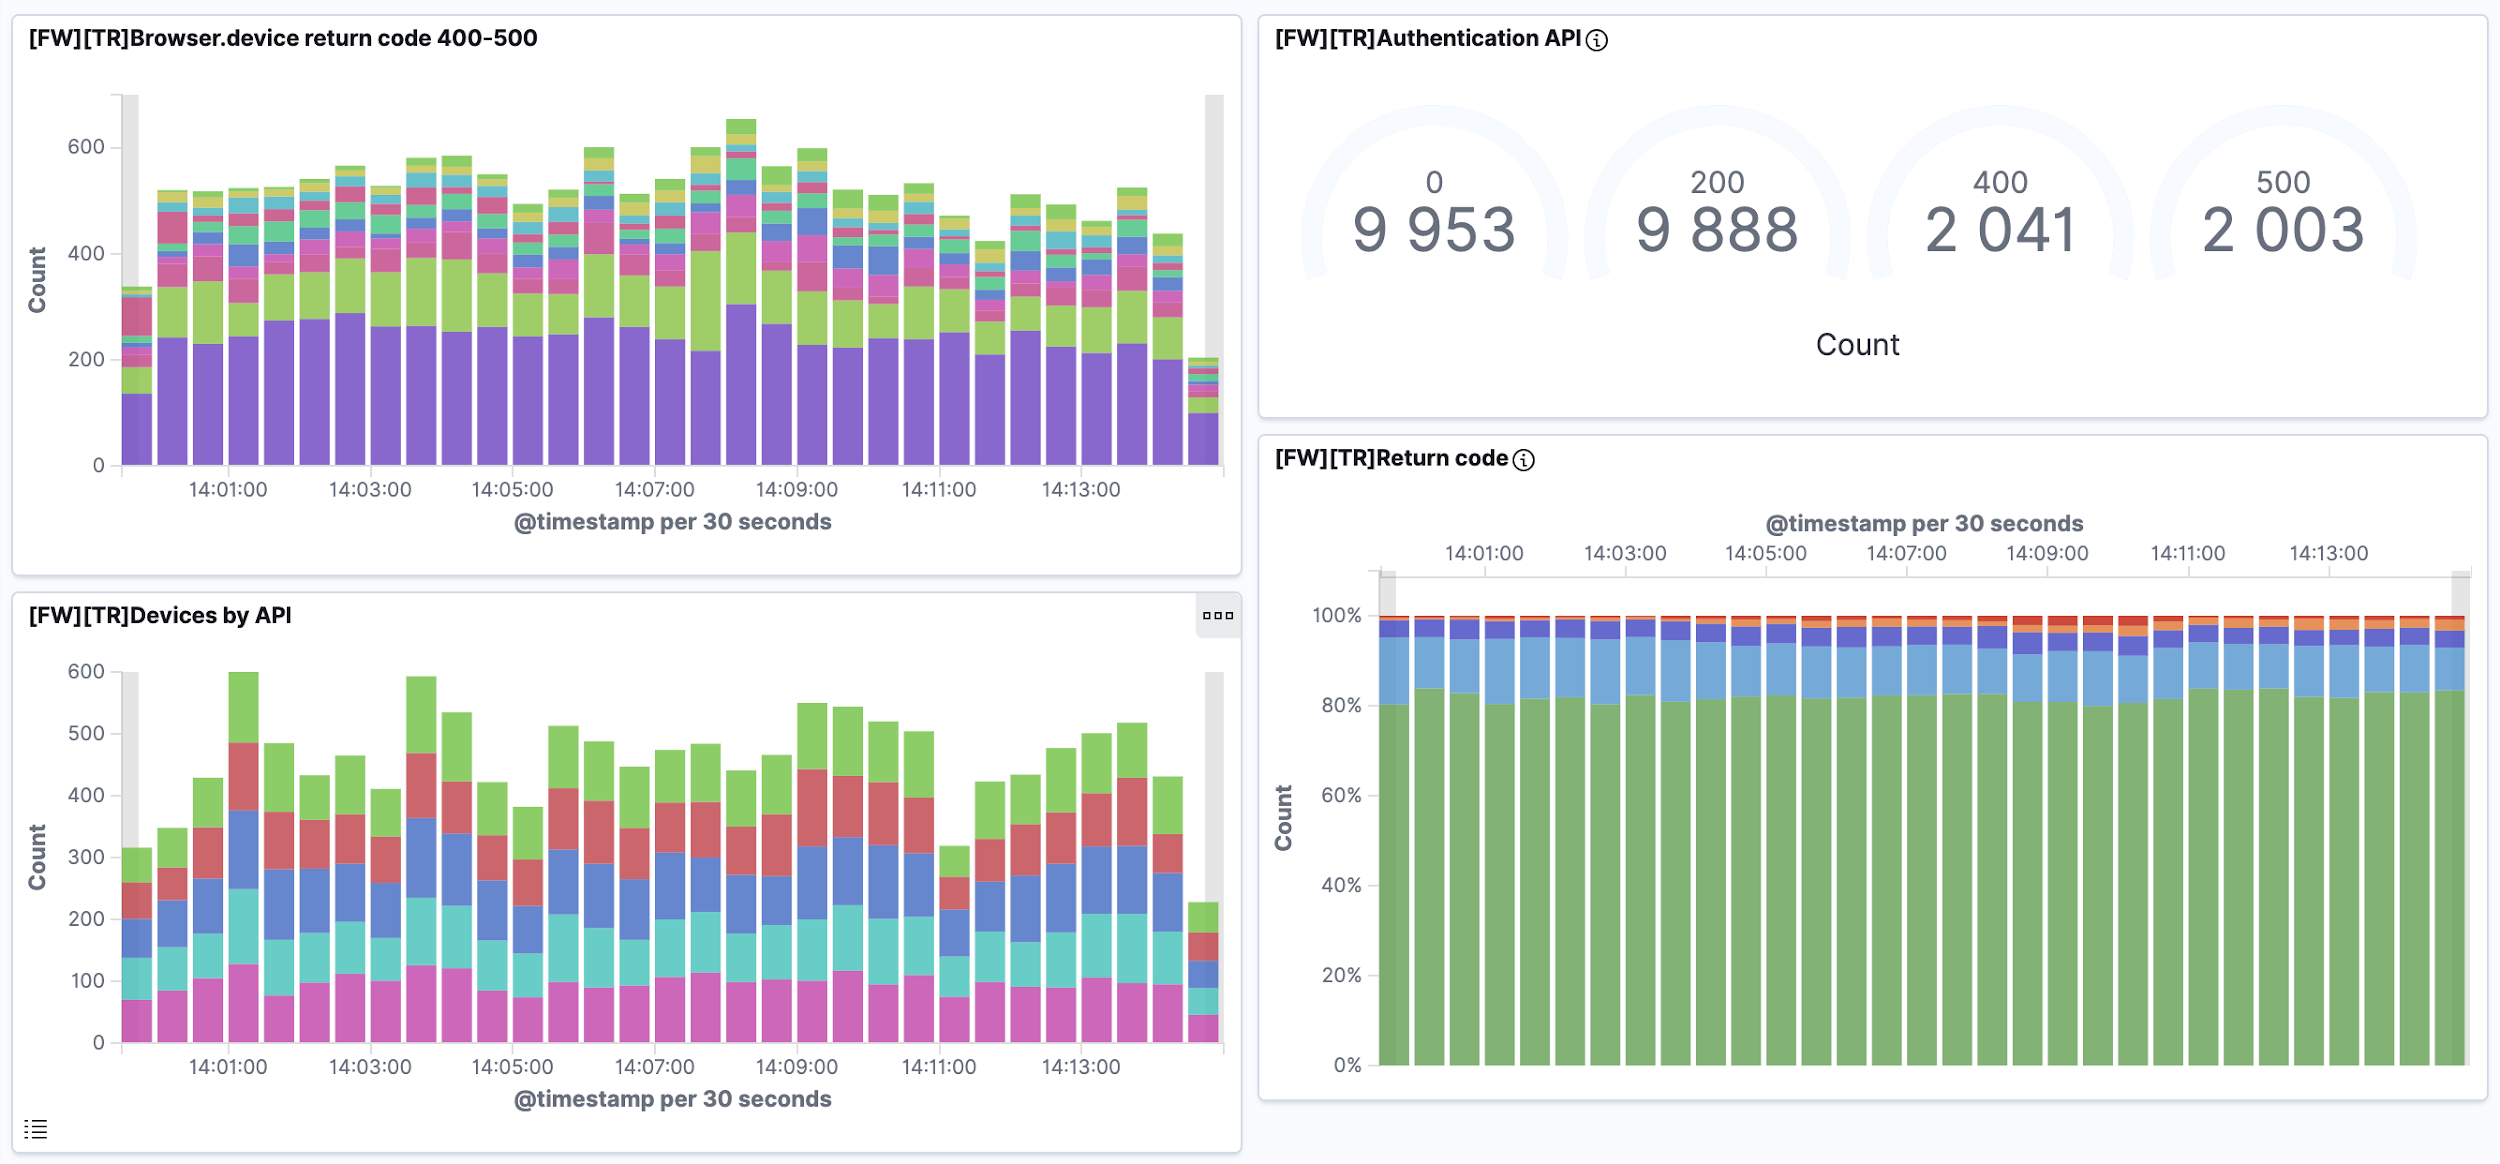
The moment of the attack was recorded . Now it was necessary to understand how the beginning of the attack looks on the graph. To find it, we looked at the server's responses to the user (return codes). We were interested in server responses with the following codes (rc):
| Code (rc)
|
Name
|
Description
|
| 0
|
DROP
|
Server request is being blocked
|
| 200
|
Ok
|
Request processed successfully
|
| 400
|
Bad Request
|
Bad request
|
| 403
|
Forbidden
|
Authorization denied
|
| 500
|
Internal Server Error
|
Service is unavailable
|
If someone started attacking the site, the ratio of codes changed:
- 400 , 200 , - .
- 0 , FortiWeb «» .
- 500, IP- – .
By the third month, we set up a dashboard to track this activity.
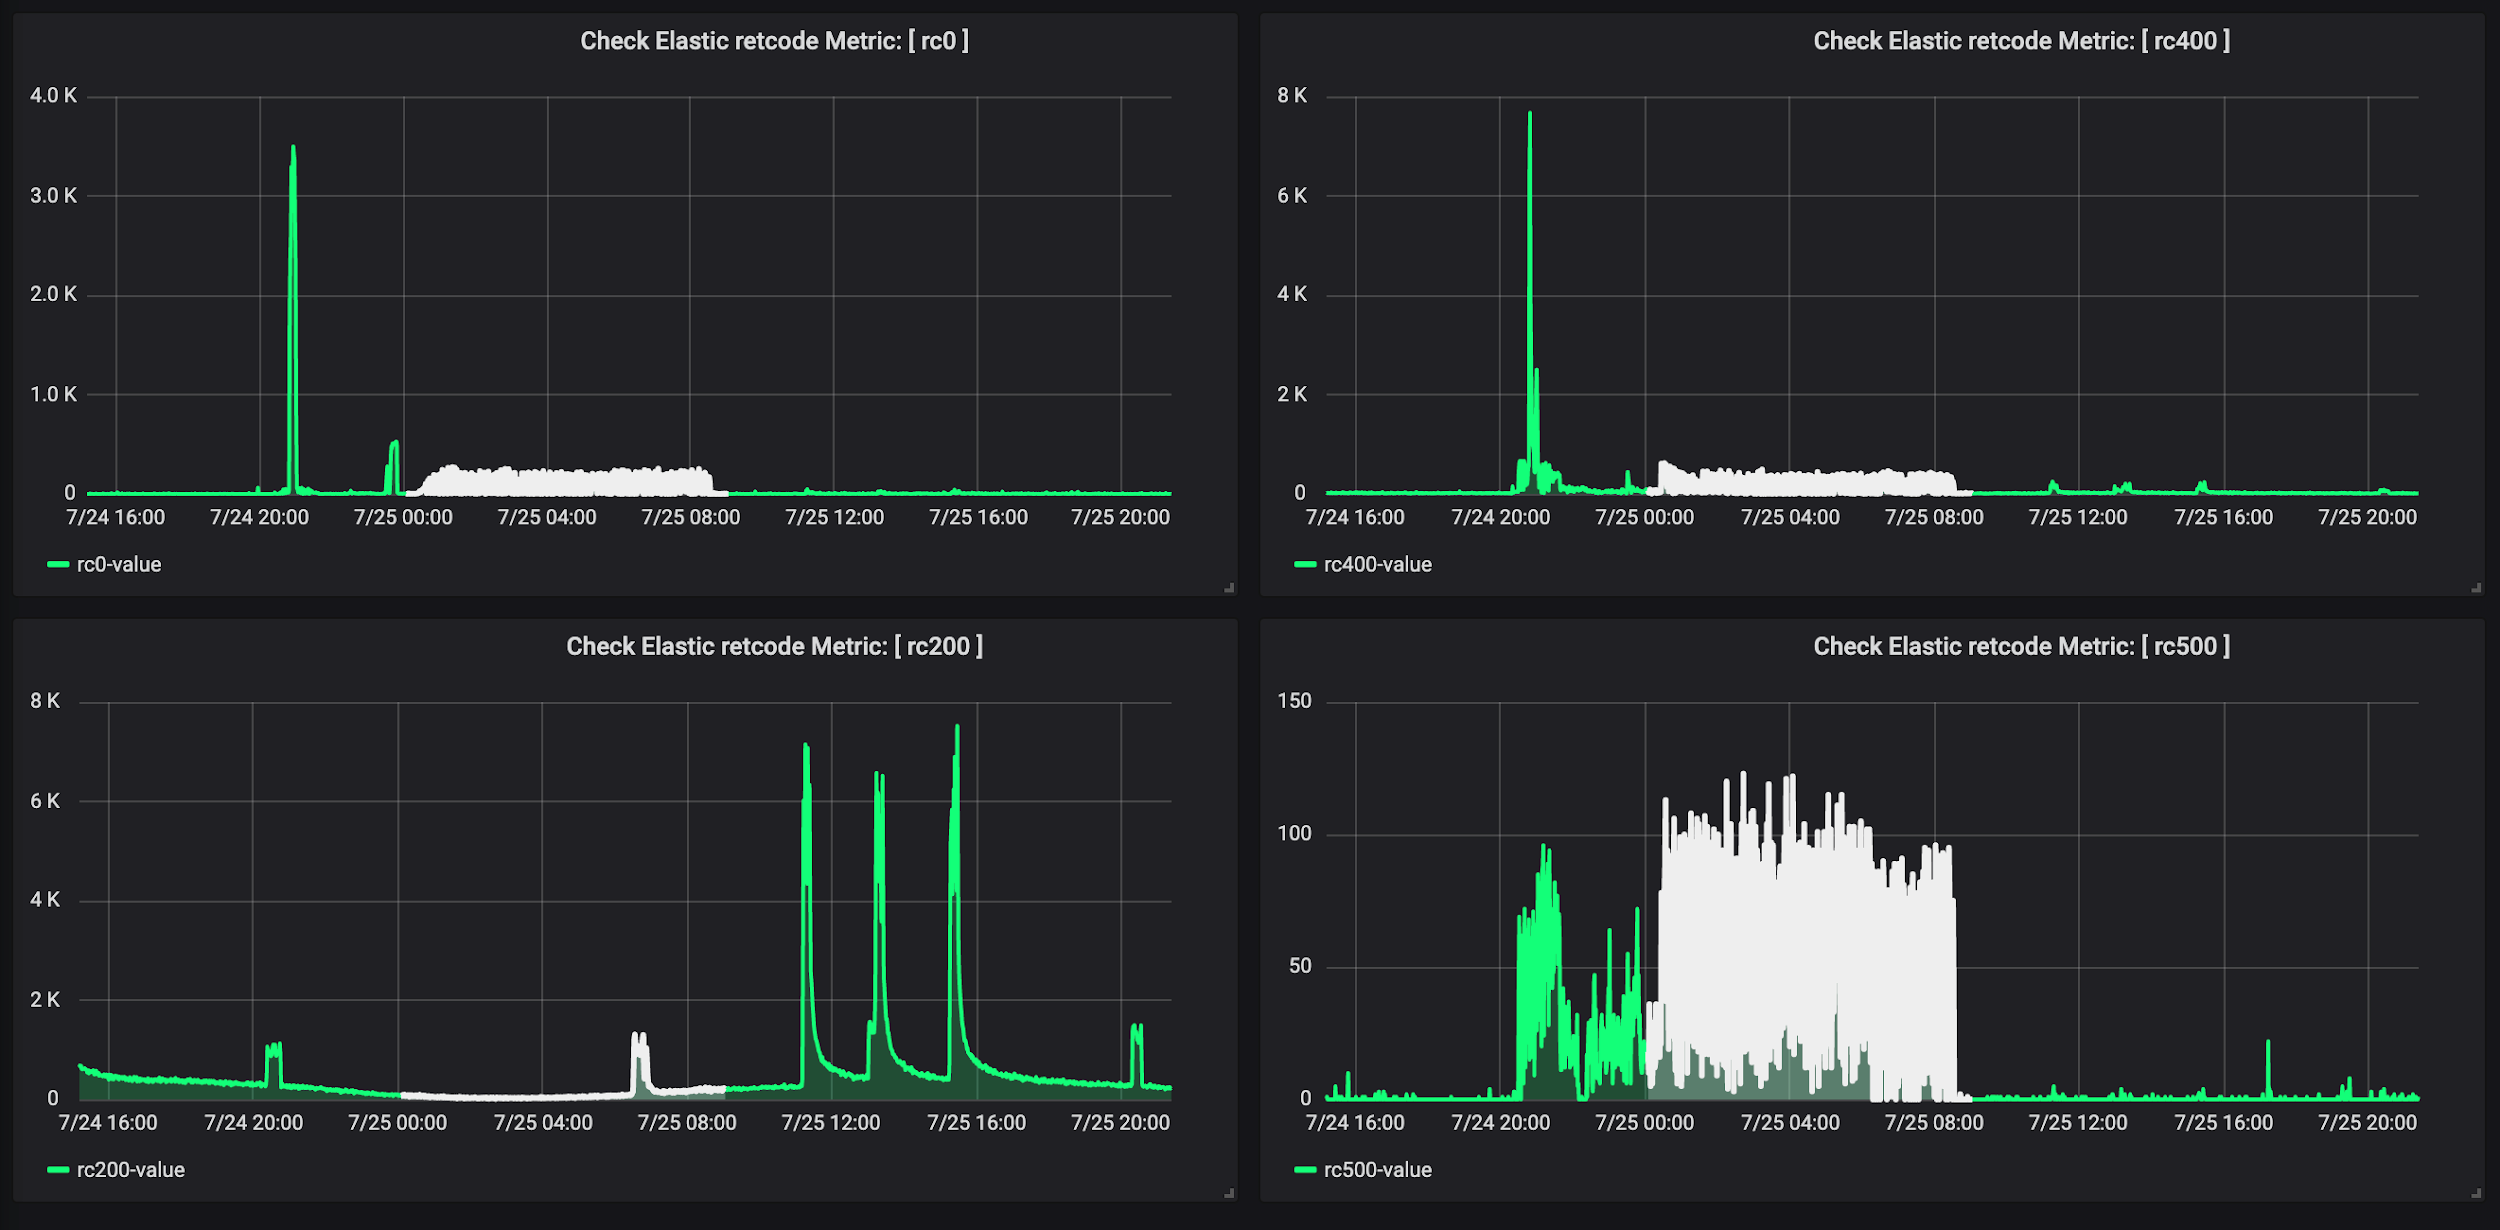
In order not to monitor everything manually, we set up integration with Nagios, which polled ELK at regular intervals. If he recorded the achievement of threshold values by codes, he sent a notification to the duty officers about suspicious activity.
Combined 4 graphs in the monitoring system . Now it was important to see on the graphs the moment when the attack is not blocked and the intervention of the engineer is needed. On 4 different graphs, our eye was blurred. Therefore, we combined the graphs and began to observe everything on one screen.
During the monitoring, we watched how the graphs of different colors changed. A splash of red indicated that the attack had begun, while the orange and blue graphs indicated FortiWeb's reaction:
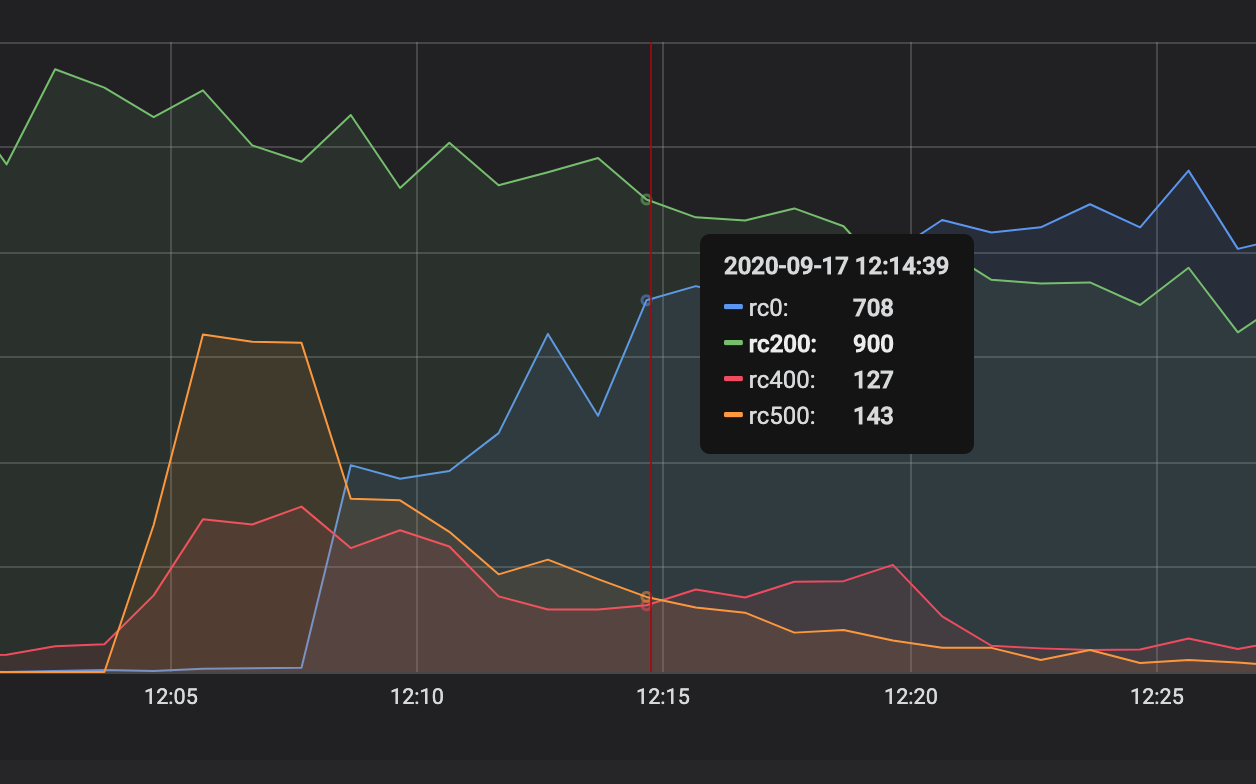
Everything is fine here: there was a burst of "red" activity, but FortiWeb coped with it and the attack schedule came to naught.
We also drew an example of a graph for ourselves that requires intervention:
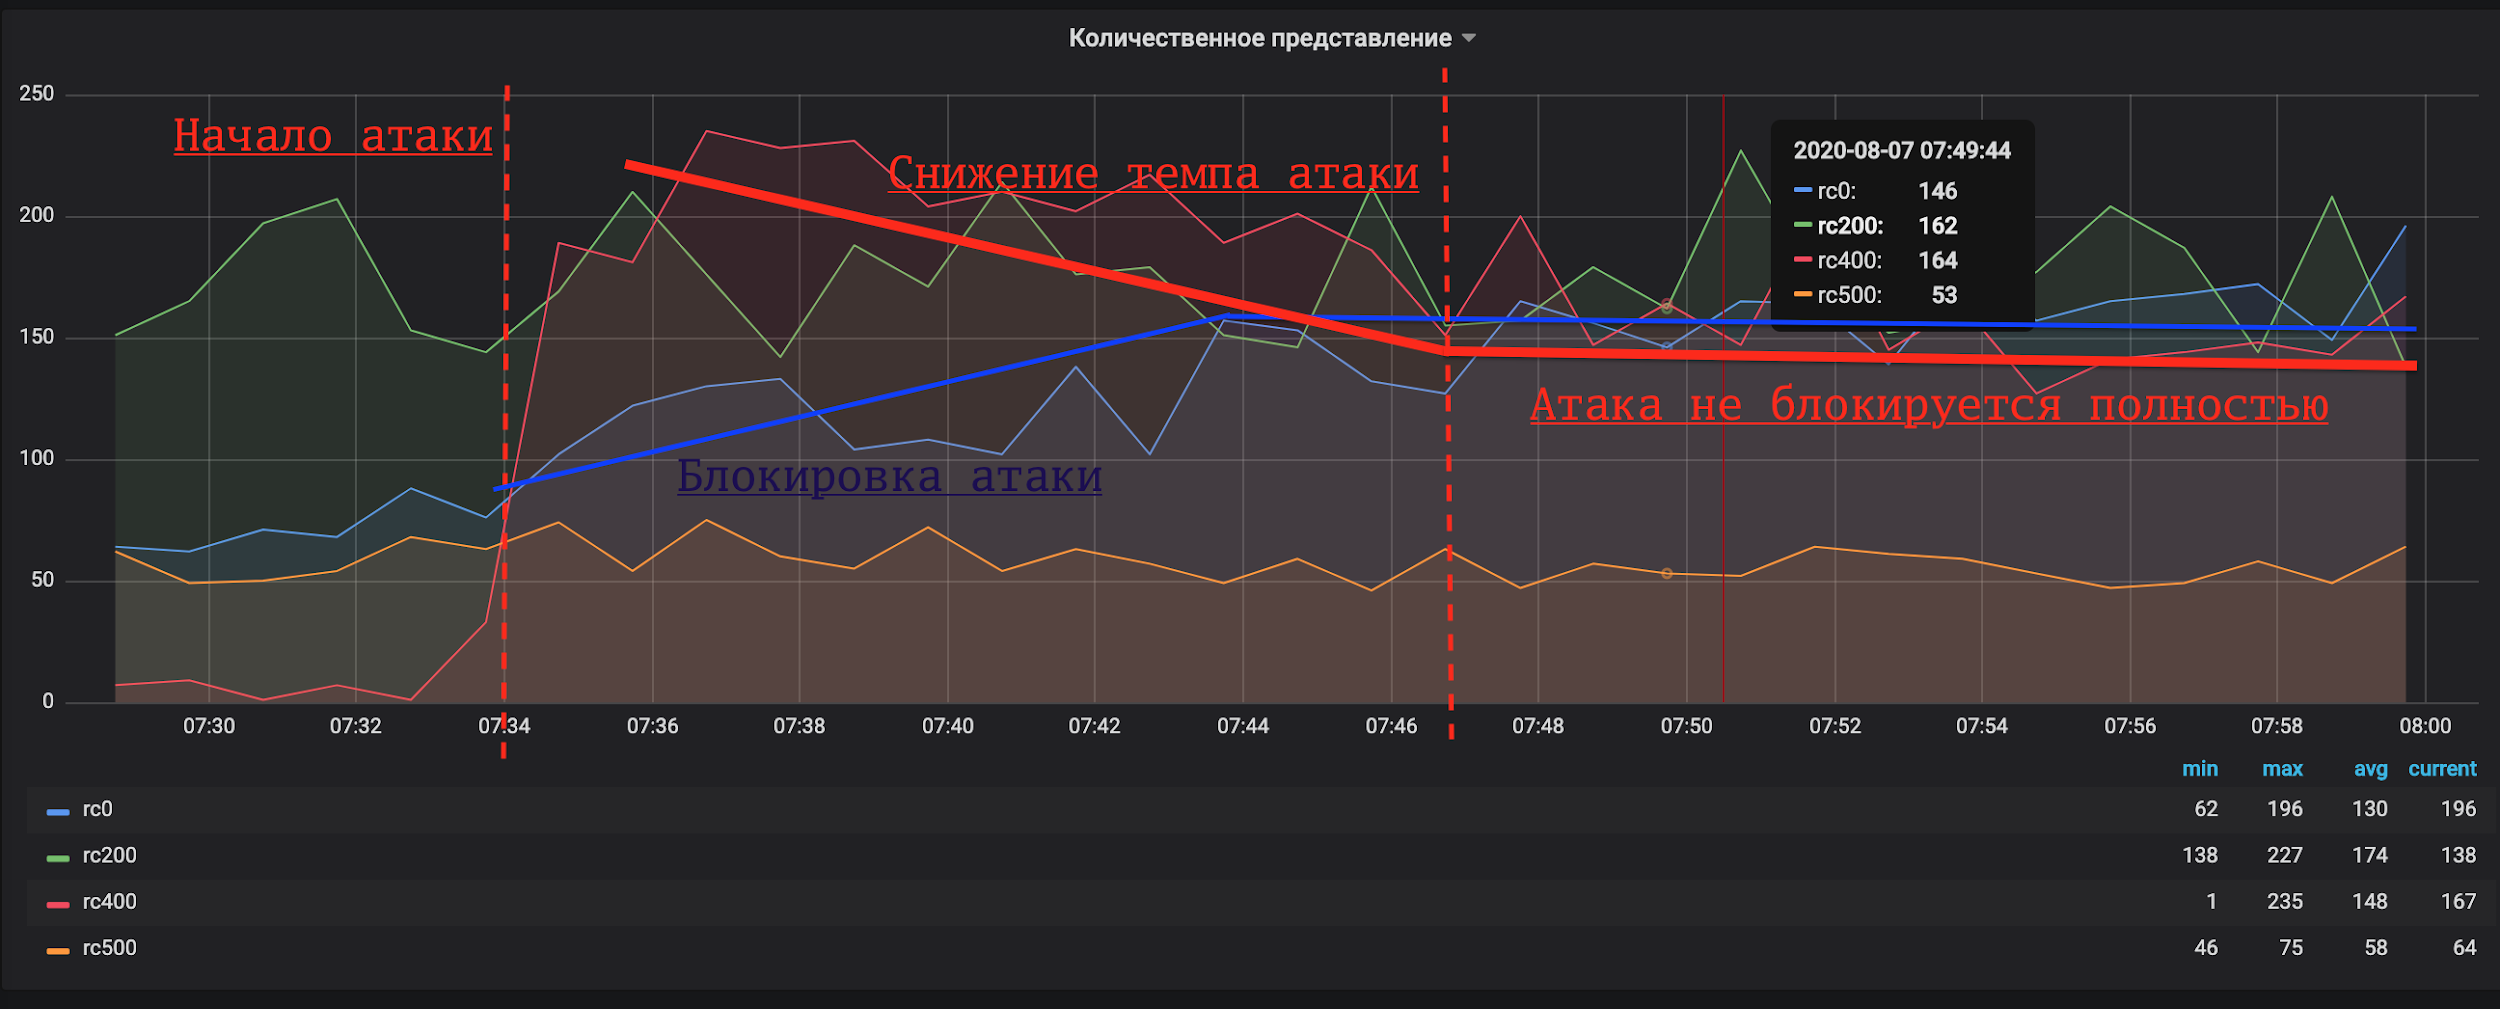
Here we see that FortiWeb increased activity, but the red attack graph did not decrease. You need to change the WAF settings.
Investigating nighttime incidents has also become easier. The graph immediately shows the moment when it is time to come to the defense of the site.
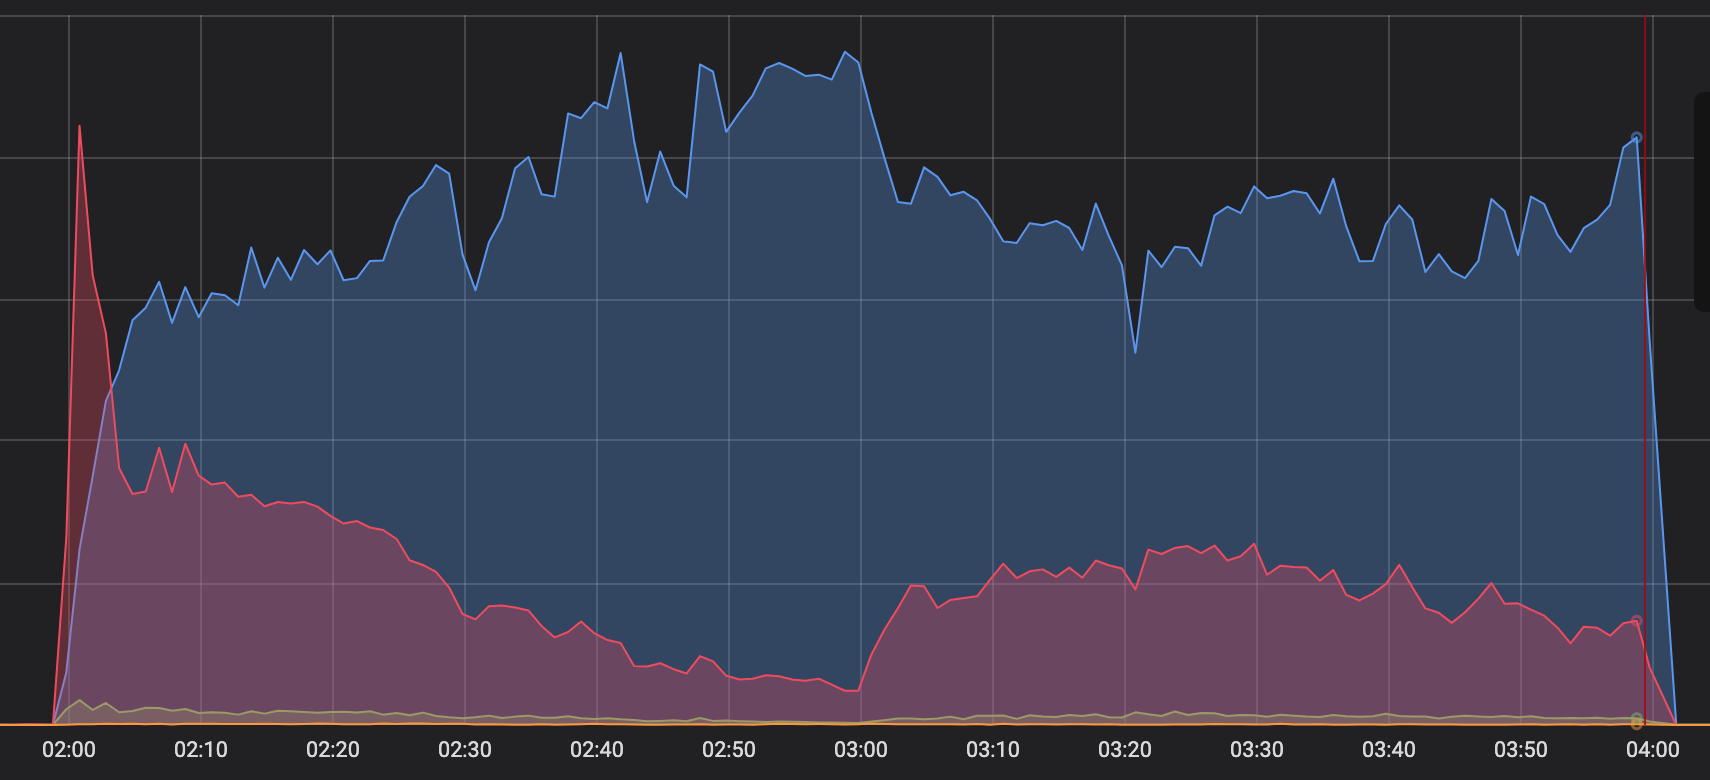
This is what sometimes happens at night. Red graph - the attack has started. Blue - FortiWeb activity. The attack was not completely blocked, so we had to intervene.
Where are we going
Now we are training the on-duty administrators to work with ELK. The attendants learn to assess the situation on the dashboard and make a decision: it's time to escalate to a FortiWeb specialist, or there will be enough WAF policies to automatically repel an attack. This way we reduce the workload on information security engineers at night and divide the roles in support at the system level. Access to FortiWeb remains only with the cyber defense center, and only they make changes to the WAF settings when urgently needed.
We are also working on reporting for customers. We plan that data on the dynamics of WAF work will be available in the client's personal account. ELK will make the situation more transparent without having to go to the WAF itself.
If the customer wants to watch their own protection in real time, ELK will also come in handy. We cannot give access to WAF, since the customer's intervention in the work can affect others. But you can raise a separate ELK and give it to "play".
These are the scenarios for using the "Christmas tree" we have accumulated recently. Share your ideas on this and do not forget to configure everything correctly to avoid leaks from the databases.