You can rely on your opinion, formed from different sources of information, for example, publications on websites or experience. You can ask colleagues and acquaintances. Another option is to look at the conference topics: the program committee is active representatives of the industry, so we trust them in choosing relevant topics. A separate area is research and reports. But there's a problem. Research on the state of DevOps is carried out annually in the world, reports are published by foreign companies and there is almost no information about Russian DevOps.
But the day has come when such a study was conducted, and today we will tell you about the results obtained. The state of DevOps in Russia was investigated jointly by Express 42 and Ontiko". Express 42 helps technology companies implement and develop DevOps practices and tools and was one of the first to talk about DevOps in Russia. The authors of the study, Igor Kurochkin and Vitaly Khabarov, are engaged in analysis and consulting at Express 42, having a technical background from operation and work experience in different companies. Over the past 8 years, colleagues have looked at dozens of companies and projects - from startups to enterprises - with different problems, as well as different cultural and engineering maturity.
In their report, Igor and Vitaly told what problems were in the research process, how they solved them, as well as how DevOps research is conducted in principle and why Express 42 decided to conduct its own. Their report can be viewed here .

DevOps Research
Igor Kurochkin began the conversation.
We regularly ask the audience a question at DevOps conferences: "Have you read the DevOps status report for this year?" Only a few raise their hands, and our study showed that only a third study them. If you have never seen such reports, let's say right away that they are all very similar. Most often there are phrases like: "Compared to last year ..."
Here we have the first problem, and after it two more:
- We have no data for the past year. The state of DevOps in Russia is of no interest to anyone;
- Methodology. It is not clear how to test hypotheses, how to build questions, how to carry out analysis, compare results, find connections;
- Terminology. All reports are in English, translation is required, a common DevOps framework has not yet been invented and everyone comes up with their own.
Let's take a look at how the analyzes of the state of DevOps around the world were conducted in general.
Historical reference
DevOps research has been conducted since 2011. The first was held by Puppet, a developer of configuration management systems. At that time, it was one of the main tools for describing infrastructure in the form of code. Until 2013, these studies were simply in the form of closed-ended surveys and without public reports.
In 2013, IT Revolution was born, the publisher of all major DevOps books. Together with Puppet, they prepared the first publication "State of DevOps", where 4 key metrics appeared for the first time. The following year, ThoughtWorks, a consulting company known for its regular technology radars on industry practices and tools, joined in. And in 2015, a methodology section was added, and it became clear how they perform the analysis.
In 2016, the authors of the study, having created their company DORA (DevOps Research and Assessment), published an annual report. The following year, DORA and Puppet released a joint report for the last time.
And then the interesting began:

In 2018, the companies split up and two independent reports were released: one from Puppet, the other from DORA in conjunction with Google. DORA has continued to use its methodology with key metrics, performance profiles and engineering practices that impact key metrics and company-wide performance. And Puppet offered its own approach describing the process and evolution of DevOps. But the story did not catch on, in 2019 Puppet abandoned this methodology and released a new version of the reports, in which it listed the key practices and how they affect DevOps from their point of view. Then another thing happened: Google bought DORA, and together they released another report. You may have seen him.
Things got complicated this year. Puppet is known to have launched its own poll. They did it a week earlier than we did, and it has already ended. We took part in it and saw what topics they are interested in. Puppet is currently performing its analysis and preparing to publish the report.
But there is still no announcement from DORA and Google. In May, when the survey usually began, information came in that Nicole Forsgren, one of the founders of DORA, had moved to another company. Therefore, we assumed there would be no research and no report from DORA this year.
How are things in Russia?
We haven't done any DevOps research. We spoke at conferences, retelling other people's conclusions and Raiffeisenbank translated "State of DevOps" for 2019 (you can find their announcement on Habré), many thanks to them. And it's all.
Therefore, we conducted our own research in Russia using DORA methodologies and findings. We used the report of colleagues from Raiffeisenbank for our research, including for the synchronization of terminology and translation. And the industry-specific questions come from DORA reports and this year's Puppet survey.
Research process
The report is only the final part. The entire research process consists of four large steps:

During the preparation phase, we interviewed industry experts and prepared a list of hypotheses. On their basis, questions were drawn up and a survey was launched for the entire August. Then we analyzed and prepared the report itself. For DORA, this process takes 6 months. We met 3 months, and now we understand that we barely had enough time: only by performing the analysis do you understand what questions need to be asked.
Participants
All foreign reports begin with a portrait of the participants, and most of them are not from Russia. The percentage of Russian respondents floats from 5 to 1% from year to year, and this does not allow any conclusions to be drawn.
Map from the Accelerate State of DevOps 2019 report:

In our study, we managed to interview 889 people - this is quite a lot (DORA polls about a thousand people in its reports annually) and here we achieved the goal:
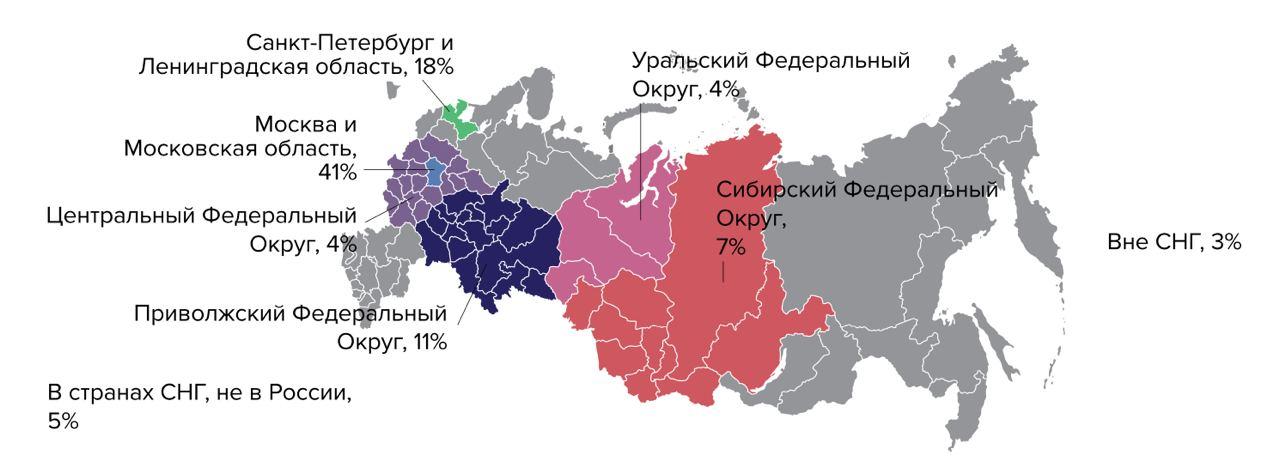
True, not all of our participants reached the end: percentage filling turned out to be slightly less than half. But even this was enough to obtain a representative sample and conduct an analysis. DORA does not disclose the percentage of filling in its reports, so it cannot be compared here.
Industries and positions
Our respondents represent a dozen industries. Half of them work in information technology. This is followed by financial services, trade, telecommunications and others. Among the positions are specialists (developer, tester, operation engineer) and management staff (team leaders, teams, directions, directors):

Every second works in a medium-sized company. Every third person works in large companies. Most work in teams of up to 9 people. Separately, we asked about the main activities, and most are in one way or another related to operation, and about 40% are engaged in development:

This is how we collected information for comparison and analysis of representatives of different industries, companies, teams. My colleague Vitaly Khabarov will tell you about the analysis.
Analysis and comparison
Vitaly Khabarov: Many thanks to all the participants who completed our survey, filled out the questionnaires and gave us data for further analysis and testing of our hypotheses. And thanks to our clients and customers, we have a wealth of experience that helped identify issues of concern to the industry and formulate the hypotheses that we tested in our research.
Unfortunately, you cannot just take a list of questions on the one hand and data on the other, somehow compare them, say: “Yes, everything works like that, we were right” and disperse. No, we need methodology and statistical methods to be sure that we are not mistaken and our conclusions are reliable. Then we can build our further work on the basis of this data:

Key metrics
We took as a basis the DORA methodology, which they described in detail in the book "Accelerate State of DevOps". We checked whether the key metrics are suitable for the Russian market, can they be used in the same way that DORA uses to answer the question: "How does the industry in Russia correspond to the foreign industry?"
Key metrics:
- Deployment frequency. How often is a new version of an application deployed to the production environment (planned changes, excluding hot fixes and incident response)?
- Delivery time. How long is the average time between committing a change (writing functionality as code) and deploying the change to the product environment?
- . , , ?
- . ( , )?
DORA has found a relationship between these metrics and organizational performance in its research. We also check it in our research.
But to make sure that the four key metrics can influence something, you need to understand - are they somehow related to each other? DORA replied in the affirmative with one caveat: the relationship between Change Failure Rate and the other three metrics is slightly weaker. We got about the same picture. If delivery time, deployment frequency, and recovery time correlate with each other (we found this correlation through Pearson's correlation and through the Chaddock scale), then there is no such strong correlation with unsuccessful changes.
In principle, most of the respondents tend to answer that they have a fairly small number of incidents occurring in production. Although in the future we will see that there is still a significant difference between the groups of respondents in terms of the rate of unsuccessful changes, for this division we cannot yet use this metric.
We associate this with the fact that (as it turned out during the analysis and communication with some of our customers) there is a slight difference in the perception of what is considered an incident. If we managed to restore the operability of our service during the technical window, can this be considered an incident? Probably not, because we fixed everything, we are great. Can it be considered an incident if we had to re-roll out our application 10 times in a normal, usual for us mode? It seems not. Therefore, the question of the relationship of unsuccessful changes with other metrics remains open. We will refine it further.
It is important here that we found a significant correlation between delivery times, recovery times, and deployment frequency. Therefore, we took these three metrics to further divide the respondents into performance groups.
How much to weigh in grams?
We used hierarchical cluster analysis:
- We distribute respondents in n-dimensional space, where the coordinate of each respondent is their answers to questions.
- We declare each respondent as a small cluster.
- We combine the two clusters that are closest to each other into one larger cluster.
- Find the next pair of clusters and combine them into a larger cluster.
This is how we group all our respondents into the required number of clusters. With the help of a dendrogram (a tree of connections between clusters) we see the distance between two neighboring clusters. All that remains for us is to set a certain distance limit between these clusters and say: "These two groups are quite distinguishable from each other because the distance between them is huge."
But there is a hidden problem here: we have no restrictions on the number of clusters - we can get 2, 3, 4, 10 clusters. And the first idea was - why not divide all our respondents into 4 groups, as DORA does. But we found out that the differences between these groups become insignificant, and we cannot be sure that the respondent really belongs to his own group, and not to the neighboring one. We still cannot divide the Russian market into four groups. Therefore, we stopped at exactly three profiles, between which there is a statistically significant difference:

Next, we determined the profile by clusters: we took the medians for each metric for each group and made a table of performance profiles. In fact, we got the performance profiles of the average participant in each group. We have identified three efficiency profiles: Low, Medium, High:

Here we have confirmed our hypothesis that the 4 key metrics are suitable for determining the performance profile, and they work in both the Western and Russian markets. There is a difference between the groups, and it is statistically significant. I would like to emphasize that there is a significant difference in the mean between the performance profiles according to the metric of unsuccessful changes, even though we initially did not divide the respondents by this parameter.
Then the question arises: how to use all this?
How to use
If you take any team, 4 key metrics and apply it to the table, then in 85% of cases we will not get a complete match - this is just an average participant, and not what is in reality. We are all (and every team) a little bit different.
We checked: we took our respondents and the DORA performance profile, and we looked at how many respondents fit a particular profile. We found that only 16% of respondents accurately hit one of the profiles. All the others are scattered somewhere in between:
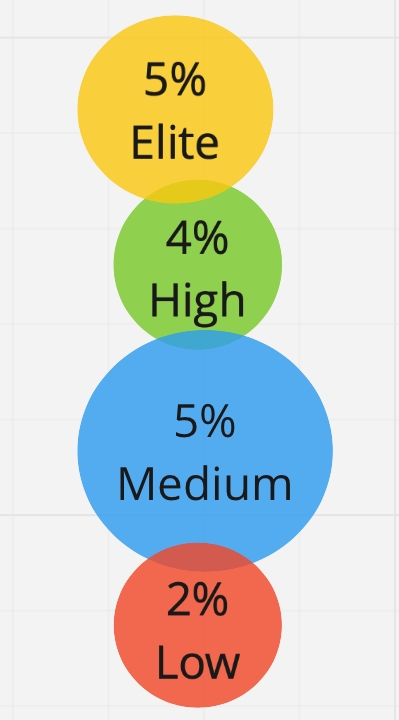
This means that the performance profile has a limited scope. To understand where you are in a first approximation, you can use this table: "Oh, it seems we are closer to Medium or High!" If you understand where to go next, this may be enough. But if your goal is constant, continuous improvement, and you want to know more precisely where to develop and what to do, then you need additional funds. We called them calculators:
- DORA calculator
- Calculator Express 42 * (in development)
- Own development (you can create your own internal calculator).
What are they needed for? To understand:
- Does the team within our organization meet our standards?
- If not, can we help her - accelerate her within the framework of the expertise that our company has?
- If so, can we do it even better?
You can also use them to collect statistics within the company:
- What teams do we have;
- Divide teams into profiles;
- See: Oh, these teams are underperforming (they don't pull a little), and these are cool: they deploy every day, without errors, they have less than an hour lead time.
And then you can find out that within our company there is the necessary expertise and tools for those teams that do not yet reach.
Or, if you understand that inside the company you feel great, that you are better than many, then you can take a broader look. This is just the Russian industry: can we get the necessary expertise in the Russian industry to accelerate ourselves? Calculator Express 42 will help here (it is under development). If you have outgrown the Russian market, then look at the DORA calculator and the global market.
Okay. And if you are in the DORA calculator Elit group, what to do? There is no good solution here. Most likely you are at the forefront of the industry, and further acceleration and reliability improvement is possible due to internal R&D and spending more resources.
Let's move on to the sweetest - comparison.
Comparison
We initially wanted to compare Russian industry with Western industry. If we compare directly, we see that we have fewer profiles, and they are a little more mixed with each other, the boundaries are a little more blurred:

Our Elite Performers are hidden among High Performers, but they exist - they are the elite, unicorns who have reached significant heights. In Russia, the difference between the Elite profile and the High profile is not yet significant enough. We think that in the future this separation will take place in connection with the improvement of engineering culture, the quality of implementation of engineering practices and expertise within companies.
If we move on to a direct comparison within the Russian industry, we see that the High profile teams are better in all respects. We also confirmed our hypothesis that there is a relationship between these metrics and organizational performance: teams of the High profile are much more likely to not only achieve goals, but also exceed them.
Let's become High profile teams and not stop there:
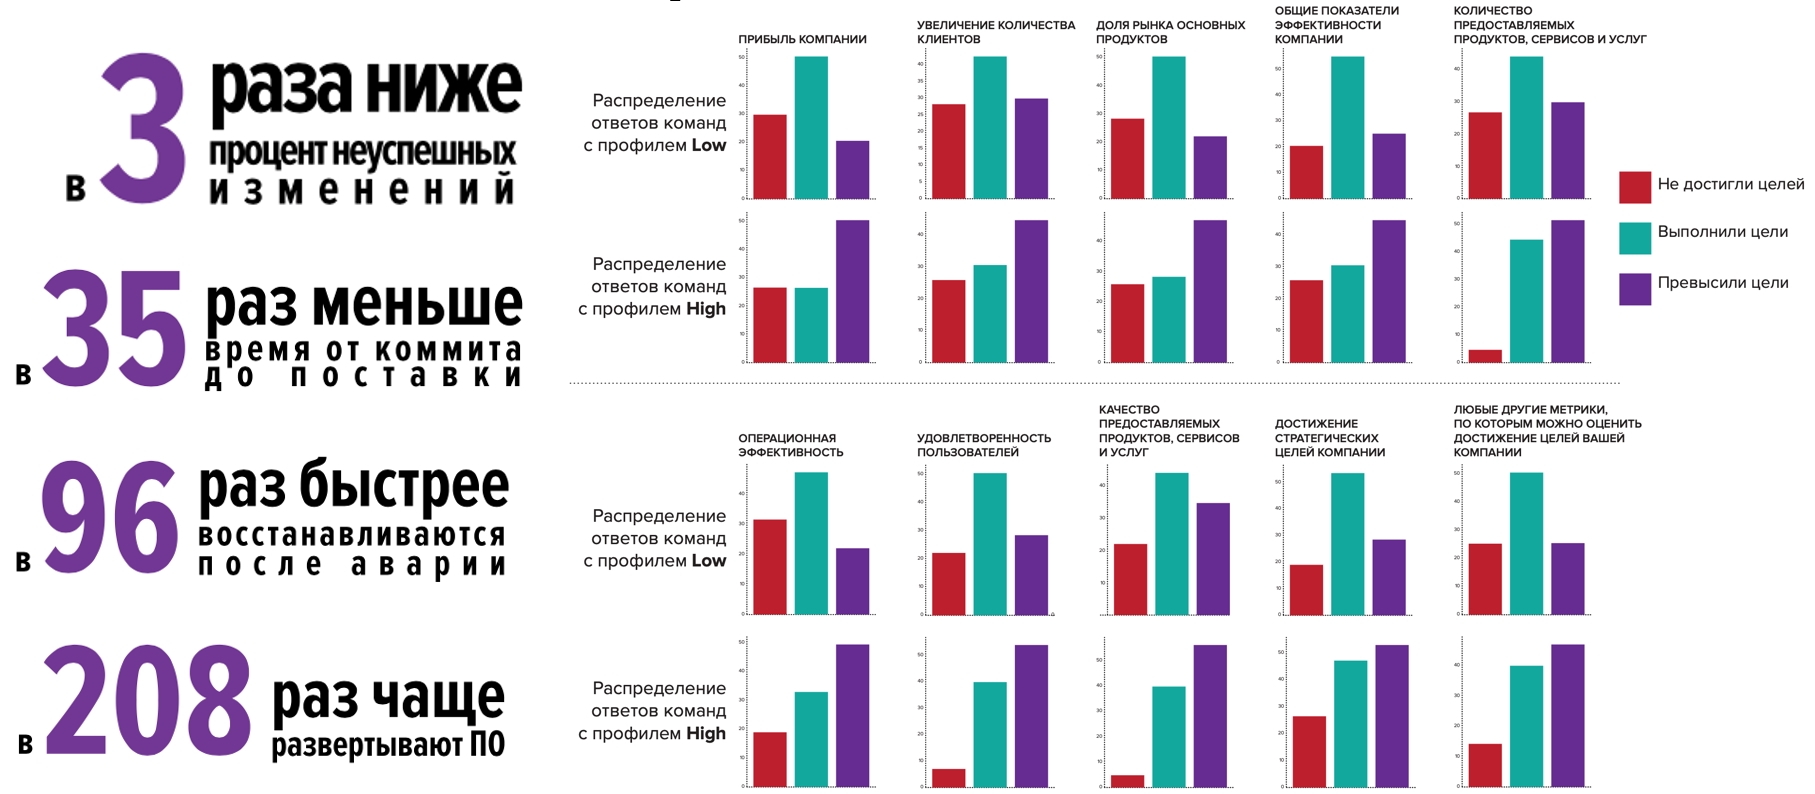
But this year is special, and we decided to check how companies live in a pandemic: High profile teams do much better and feel better than the industry average:
- New products were released 1.5-2 times more often
- 2x more likely to improve the reliability and / or performance of the application infrastructure.
That is, the competencies they already had helped them develop faster, introduce new products, modify existing products, thereby conquering new markets and new users:

What else helped our teams?
Engineering practices

I'll tell you about the significant findings from each practice that we checked. Perhaps something else helped the teams, but we're talking about DevOps. And within DevOps, we see a difference among teams of different profiles.
Platform as a service
We found no significant connection between platform age and team profile: Platforms appeared at about the same time for both Low teams and High teams. But for the latter, the platform provides, on average, more services and more programming interfaces for control through program code. And platform teams are more likely to help their developers and teams use the platform, more often to solve their platform-related problems and incidents, and to educate other teams.

Infrastructure as code
Everything is pretty standard here. We found a relationship between automating how the infrastructure code works and how much information is stored inside the infrastructure repository. The High profile commands store more information in the repositories: this is the infrastructure configuration, CI / CD pipeline, environment settings and build parameters. They store this information more often, work better with infrastructure code, and have automated more processes and tasks for working with infrastructure code.
Interestingly, we saw no significant difference in the infrastructure tests. I associate this with the fact that the High profile commands generally have more test automation. Perhaps they should not be distracted separately by infrastructure tests, but the tests that they use to check applications are enough, and thanks to them they can already see what and where they broke.

Integration and delivery
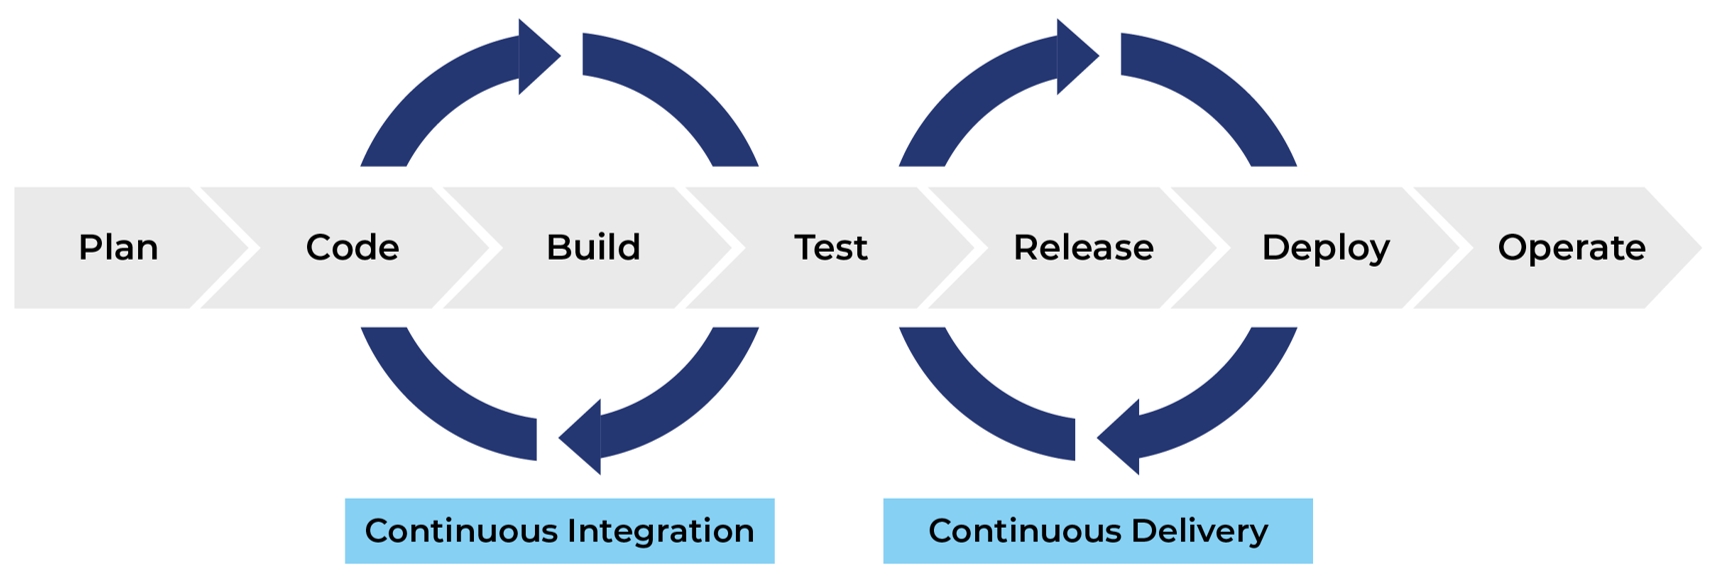
Most boring section because we confirmed that the more automation you have, the better you work with the code, the more likely you are to get the best metrics.
Architecture
We wanted to see how microservices affect performance. If in truth, they do not, since the use of microservices is not associated with an increase in performance indicators. Microservices are used by both the High profile commands and the Low profile commands.
But what is significant is that for High teams, the transition to a microservice architecture allows them to independently develop their services and roll out. If the architecture allows developers to act autonomously, not to wait for someone external to the team, then this is a key competence for increasing speed. This is where microservices help. And just their implementation does not play a big role.
How did we find all this?
We had an ambitious plan to fully replicate the DORA methodology, but we lacked resources. If DORA uses a lot of sponsorship and the research takes them half a year, we did our research in a short time. We wanted to build a DevOps model like DORA does and we will do it in the future. So far, we have limited ourselves to heat maps:

We looked at the distribution of engineering practices among teams of each profile, and found that teams in the High profile, on average, use engineering practices more often. You can read more about all this in our report .
For a change, let's switch from complex statistics to simple ones.
What else have we found?
Tools
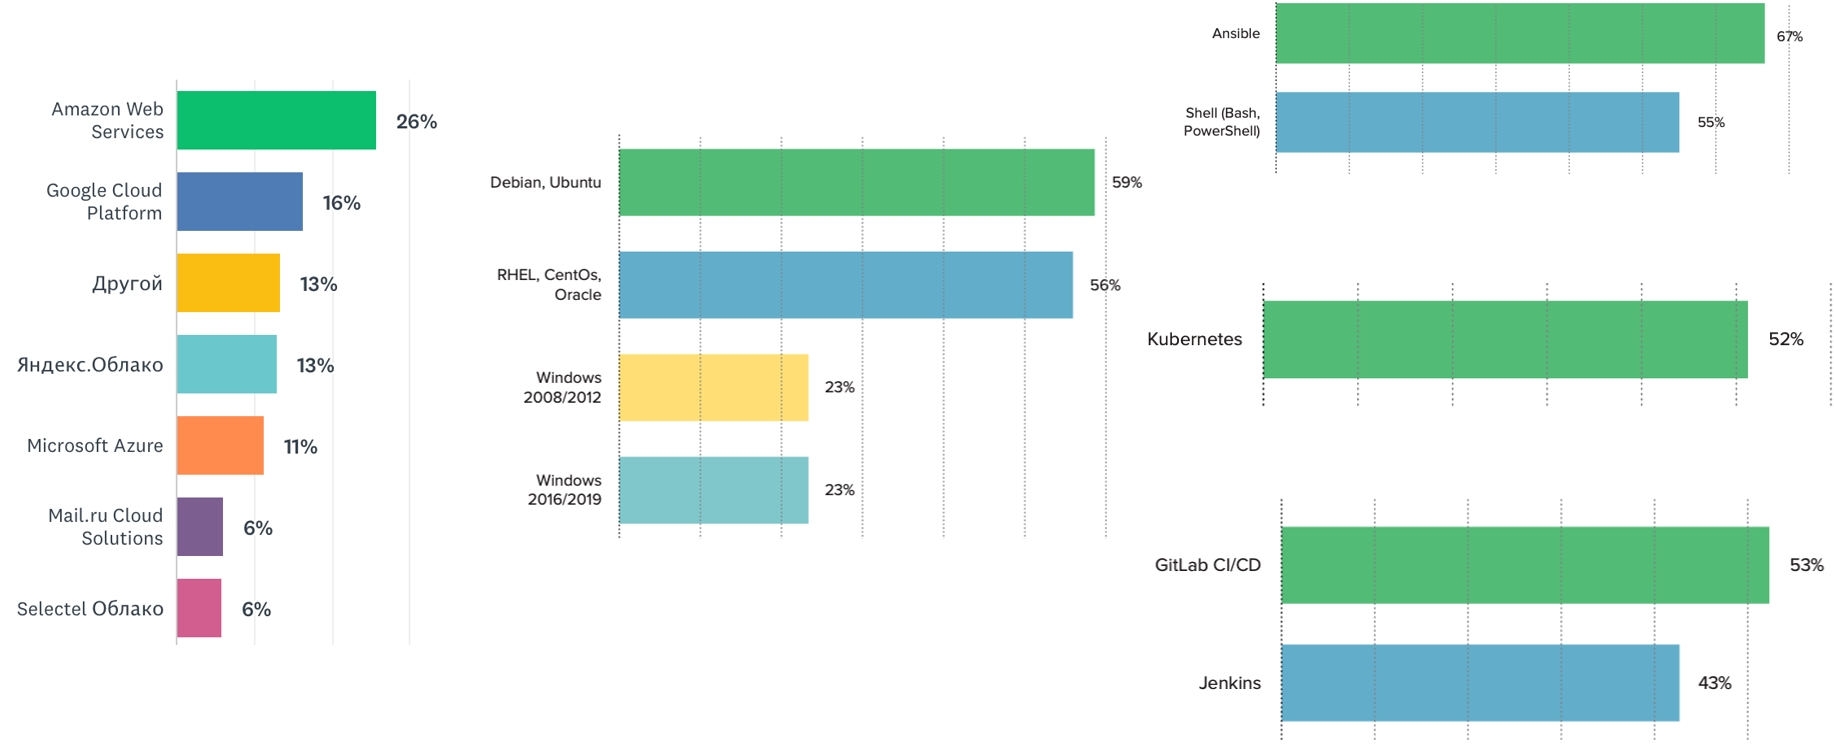
We observe that most of the teams use the Linux operating system. But Windows is still in trend - at least a quarter of our respondents noted using one or another version of it. The market seems to have this need. Therefore, you can develop these competencies and make presentations at conferences.
Kubernetes is the leader among orchestrators (52%). The next orchestrator in line is Docker Swarm (about 12%). The most popular CI systems are Jenkins and GitLab. The most popular configuration management system is Ansible, followed by our beloved Shell.
Amazon is still the leader among cloud hosting services. The share of Russian clouds is gradually increasing. Next year, it will be interesting to see how Russian cloud providers feel and whether their market share grows. They are, you can use them, and it's good:
I give the floor to Igor, who will give some more statistics.
Dissemination of practices
Igor Kurochkin: Separately, we asked the respondents to indicate how the considered engineering practices are disseminated in the company. Most companies have a mixed approach with a different set of patterns, and pilot projects are very popular. We also saw a slight difference between the profiles. Representatives of the High profile more often use the “Initiative from below” pattern, when small teams of specialists change work processes, tools, and share successful developments with other teams. At Medium, this is an initiative from the top, affecting the entire company by creating communities and centers of excellence:

Agile and DevOps
The relationship between Agile and DevOps is a hot topic in the industry. This issue is also raised in the State of Agile Report for 2019/2020, so we decided to compare how Agile and DevOps activities are related in companies. We've found that non-Agile DevOps is rare. For half of the respondents, the spread of Agile began much earlier, and about 20% observed a simultaneous start, and one of the signs of a Low profile will be the absence of Agile and DevOps practices:

Command topologies
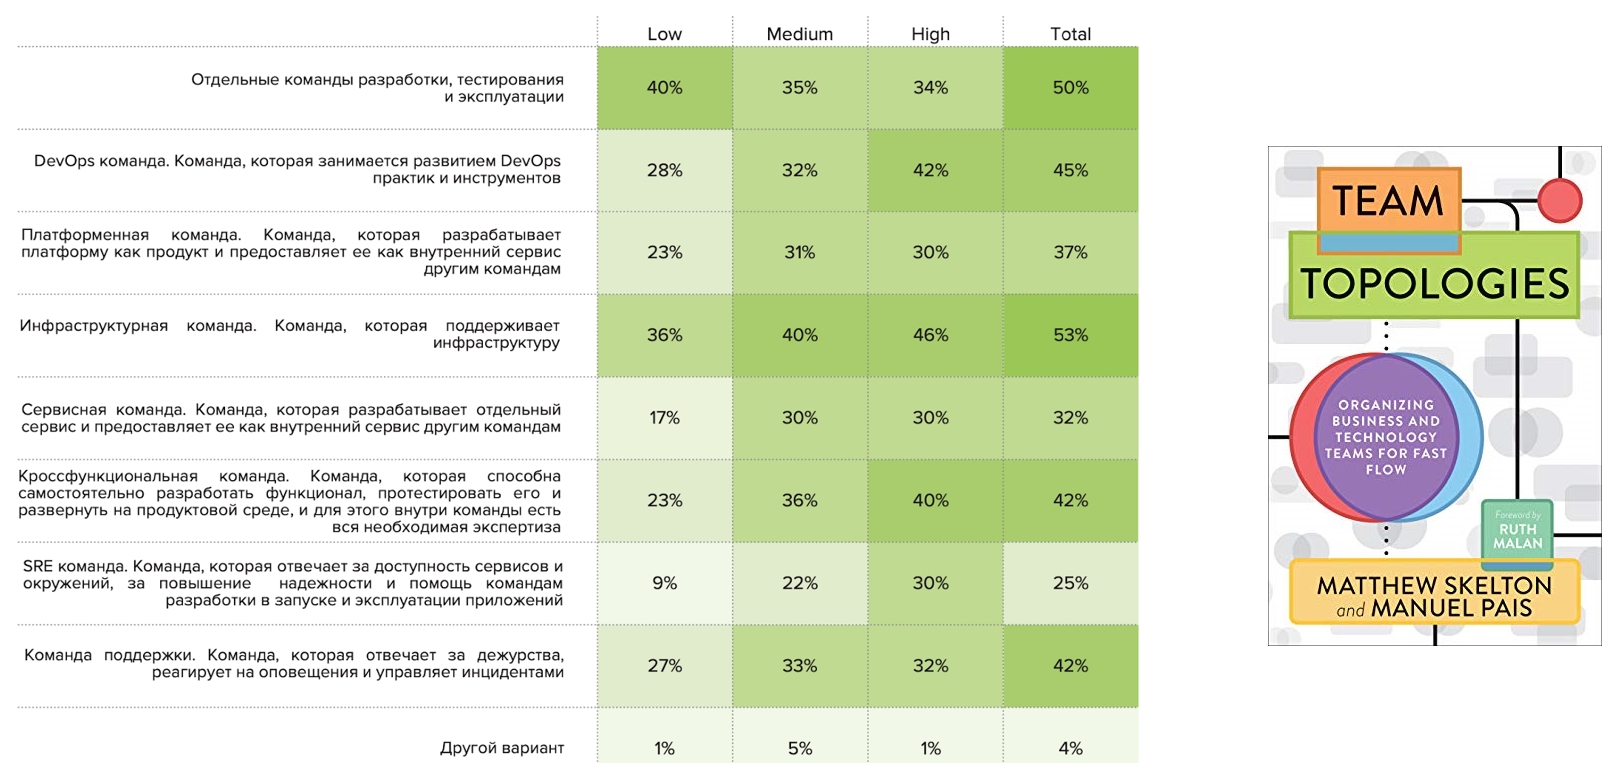
At the end of last year, the book " Team topologies " was published, which proposed a framework for describing team topologies. We wondered if it was applicable to Russian companies. And we asked the question: "What patterns do you find?"
Infrastructure teams are observed by half of the respondents, as well as separate development, test and operation teams. Individual DevOps teams were noted by 45%, among which High representatives are more common. This is followed by cross-functional teams, which are also more common for High. Separate SRE commands appear in the High, Medium profiles and rarely appear in the Low profile:
DevQaOps Ratio
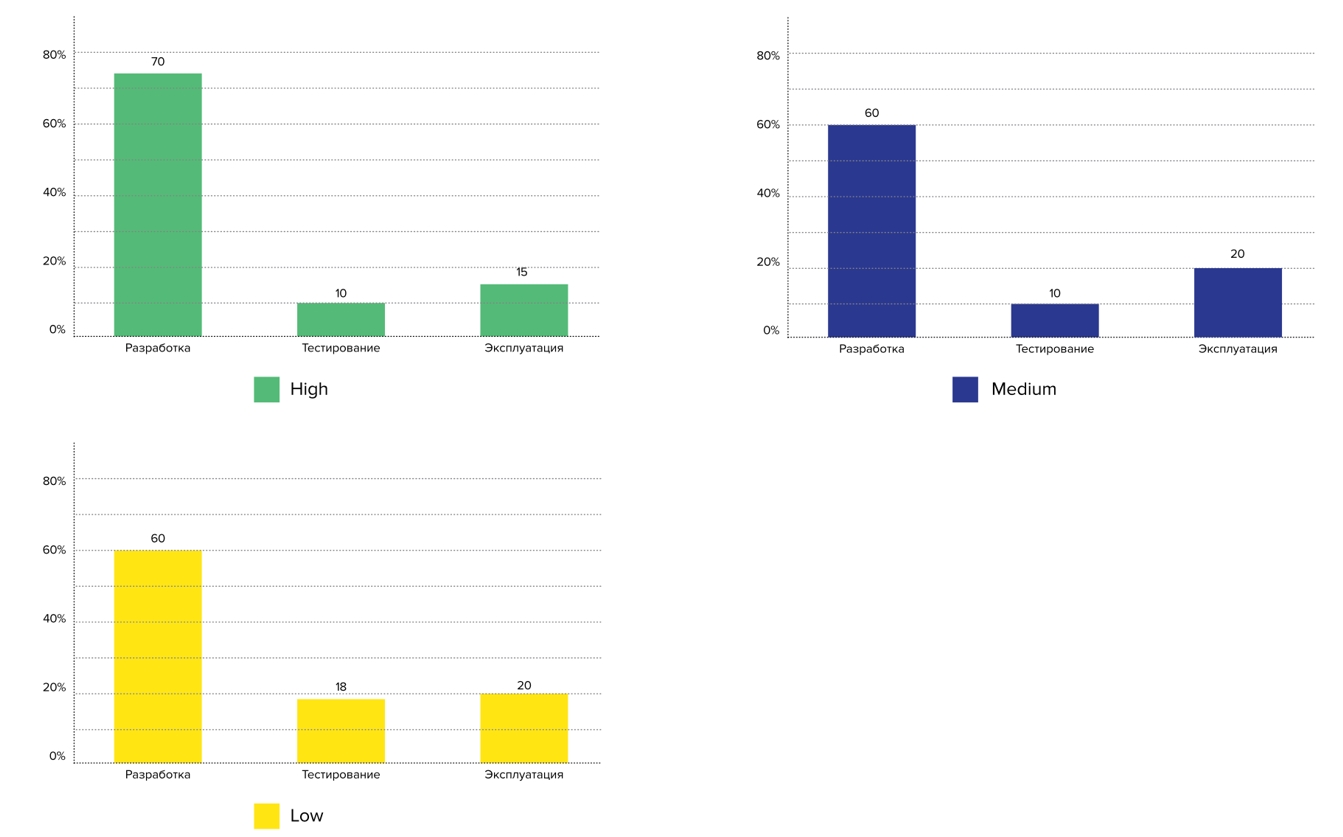
We saw this question in FaceBook from the Skyeng platform team leader - he was interested in the ratio of developers, testers and administrators in companies. We asked it and looked at the responses based on profiles: the representatives of the High profile have fewer test and operations engineers per developer:
Plans for 2021
In their plans for the next year, respondents noted the following activities:

Here you can see the intersection with the DevOps Live 2020 conference. We carefully reviewed the program:
- Infrastructure as a product
- DevOps transformation
- Spreading DevOps practices
- DevSecOps
- Case clubs and discussions
But our speech will not be enough time to consider all the topics. Left behind the scenes:
- Platform as a service and as a product;
- Infrastructure as code, environments and clouds;
- Continuous integration and delivery;
- Architecture;
- DevSecOps patterns;
- Platform and cross-functional teams.
Our report turned out to be voluminous, on 50 pages, and you can see it in more detail.
Summing up
We hope that our research and report will inspire you to experiment with new approaches to development, testing, and operations, as well as help you navigate, compare yourself with other research participants, and identify areas where you can improve your own approaches.
Results of the first survey of the state of DevOps in Russia:
- Key metrics. We have found that key metrics (lead time, deployment frequency, recovery time, and unsuccessful changes) are appropriate for analyzing the effectiveness of development, testing, and operations.
- High, Medium, Low. High, Medium, Low , , . High , Low. .
- , 2021 . , . High , , .
- DevOps practices, tools and their development. The main plans of companies for the next year include the development of DevOps practices and tools, the introduction of DevSecOps practices, and a change in the organizational structure. And the effective implementation and development of DevOps practices is carried out through pilot projects, the formation of communities and centers of excellence, initiatives at the upper and lower levels of the company.
We will be glad to hear your feedback, stories, feedback. Thanks to everyone who participated in the study, and we look forward to your participation next year.