If you do not yet know how to transmit data directly to the customer in the subconscious or, at worst, the text of the message in slack, you will need information on how to make the process of interpreting tables faster and more comfortable.
For example, excel uses conditional formatting and sparklines for this . And in this article we will see how to visualize data using Python and the library pandas: we will use the DataFrame.styleand properties Options and settings.
Setting up basic rendering
We import libraries: pandasfor working with data and seabornfor loading a classic dataset penguins:
import pandas as pd
import seaborn as sns
Use to pd.set_optionconfigure the output so that:
- the number of rows in the table was no more than 5;
- the text in the cell was fully reflected regardless of the length (this is convenient if the cell has a long title or URL that you want to see);
- all numbers were reflected with two decimal places;
pd.set_option('max_rows', 5)
pd.set_option('display.max_colwidth', None)
pd.set_option('display.float_format', '{:.2f}'.format)
Let's read and see the dataframe.
penguins = sns.load_dataset(‘penguins’)
penguins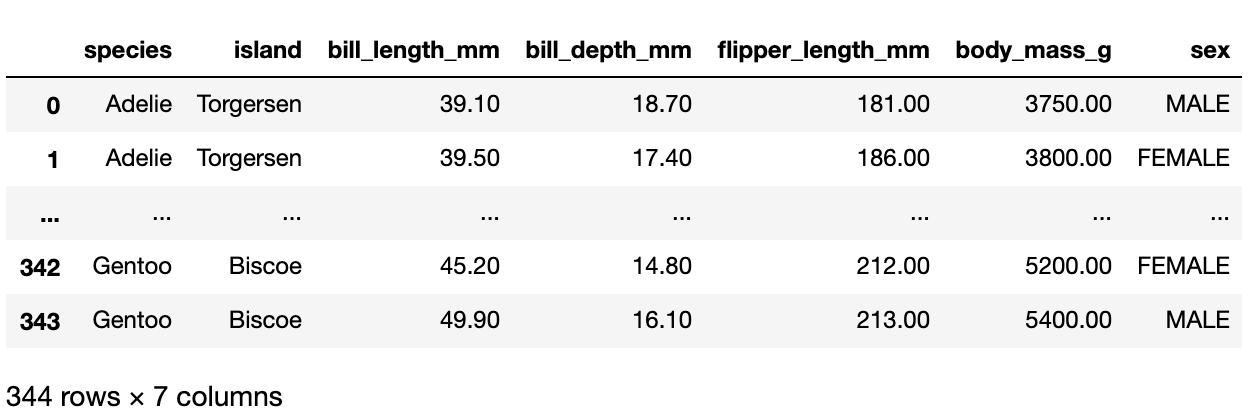
If you need to return the settings to the default, use pd.reset_option. For example, like this, if we want to update all settings at once:
pd.reset_option('all')Complete list of properties set_option.
Setting up the display of data in tables
Number format, gaps and case
Dataframes pandashave a property DataFrame.stylethat changes the display of the contents of cells by condition for rows or columns.
, , .
(penguins
 .head(5)
 .style
 .format('{:.1f}', na_rep='-')
 .format({'species': lambda x:x.lower(),
          'island': lambda x:x.lower(),
          'sex': lambda x: '-' if pd.isna(x) else x.lower()
         })
)
, , ₽ :
(df
.style
.format({'price': '₽{:.2f}'})
)
— !
(, , )
, , , . subset.
numeric_columns = ['bill_length_mm',
                   'bill_depth_mm',
                   'flipper_length_mm',
                   'body_mass_g']
, 5 .
(penguins
 .head(5)
 .style
 .format('{:.1f}', na_rep='-')
 .format({'species': lambda x:x.lower(),
          'island': lambda x:x.lower(),
          'sex': lambda x: '-' if pd.isna(x) else x.lower()
         })
 .highlight_null(null_color='lightgrey')
 .highlight_max(color='yellowgreen', subset=numeric_columns)
 .highlight_min(color='coral', subset=numeric_columns)
)
, 5 2 (!) .
: - Adelie.
Bar chart
, Adelie .
adelie_female = (penguins[(penguins['species'] == 'Adelie') &
(penguins['sex'] == 'FEMALE')]
.copy()
)
adelie_female['flipper_l_var'] = ((adelie_female['flipper_length_mm']-
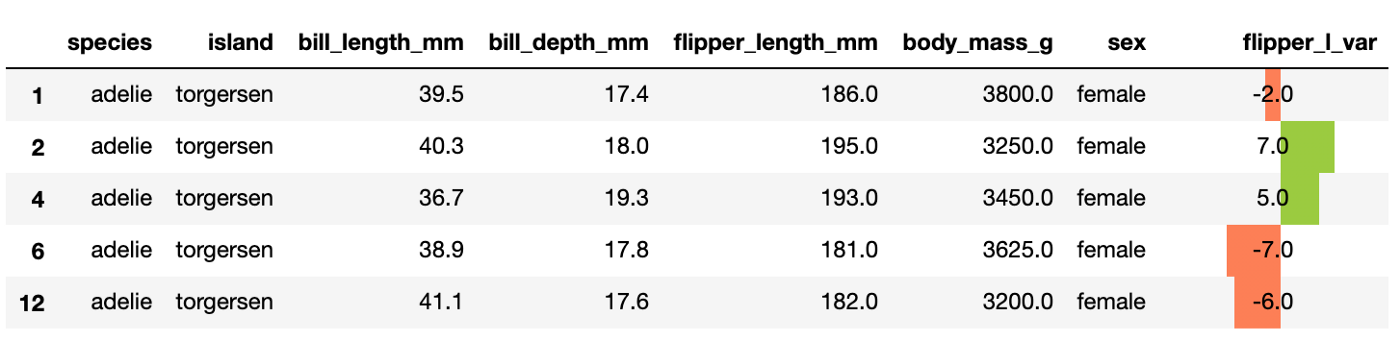
adelie_female['flipper_length_mm'].mean()).round()) , 'flipper_l_var'. :
- (
subset), ; - (
align):mid— , , . ; - (
color). 2 : ; - (
vmin,vmax).
set_properties , 'flipper_l_var' .
(adelie_female
 .head(5)
 .style
 .format('{:.1f}', na_rep='-')
 .format({'species': lambda x:x.lower(),
          'island': lambda x:x.lower(),
          'sex': lambda x: '-' if pd.isna(x) else x.lower()
         })
 .bar(subset=['flipper_l_var'],
      align='mid',
      color=['coral', 'yellowgreen'],
      vmin=adelie_female['flipper_l_var'].min(),
      vmax=adelie_female['flipper_l_var'].max()
     )
 .set_properties(**{'text-align': 'center'}, subset='flipper_l_var')
)
Heatmap
. , .
, .
species_stat=(penguins
             .groupby('species')
             .agg(penguins_count=('species','count'),
                  mean_bill_length=('bill_length_mm', 'mean'),
                  mean_bill_depth=('bill_depth_mm', 'mean'),
                  mean_flipper_length=('flipper_length_mm', 'mean'),
                  mean_body_mass=('body_mass_g', 'mean'),
                 )
             )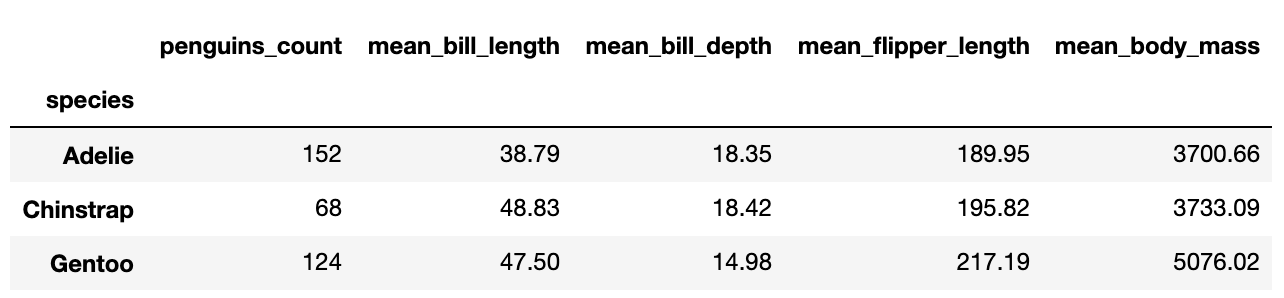
, , - , .
. , ?! -, , .
(species_stat
 .T
 .style
 .format("{:.1f}")
 .background_gradient(cmap='Blues', axis=1)
)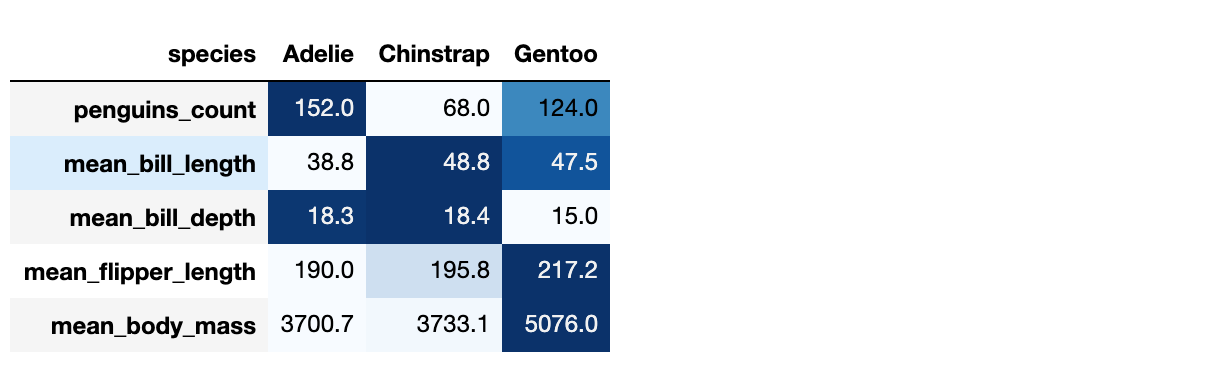
— background_gradient :
- (
cmap):Blues. ; - (
axis=1).
Formatting tables in pandaswith DataFrame.styleand Options and settingsmakes life easier, or at least improves the readability of code and reports. But the processing of data types, gaps and register is better, of course, to be carried out consciously even before the stage of visualization.
Additionally, you can deal with:
- Export to excel ;
- Native functions for conditional formatting. We used built-in functions
highlight_max,highlight_minandhighlight_null, but for more sophisticated conditions, you can write your own; - These libraries like
sparklinesandPrettyPandas.