Hello! In the continuation of this article, I want to tell you more about the functionality offered by the Sophos XG Firewall solution and introduce you to the web interface. Commercial articles and documents are good, but it's always interesting, but what does the solution look like in real life? How does everything work there? So let's get down to the review.
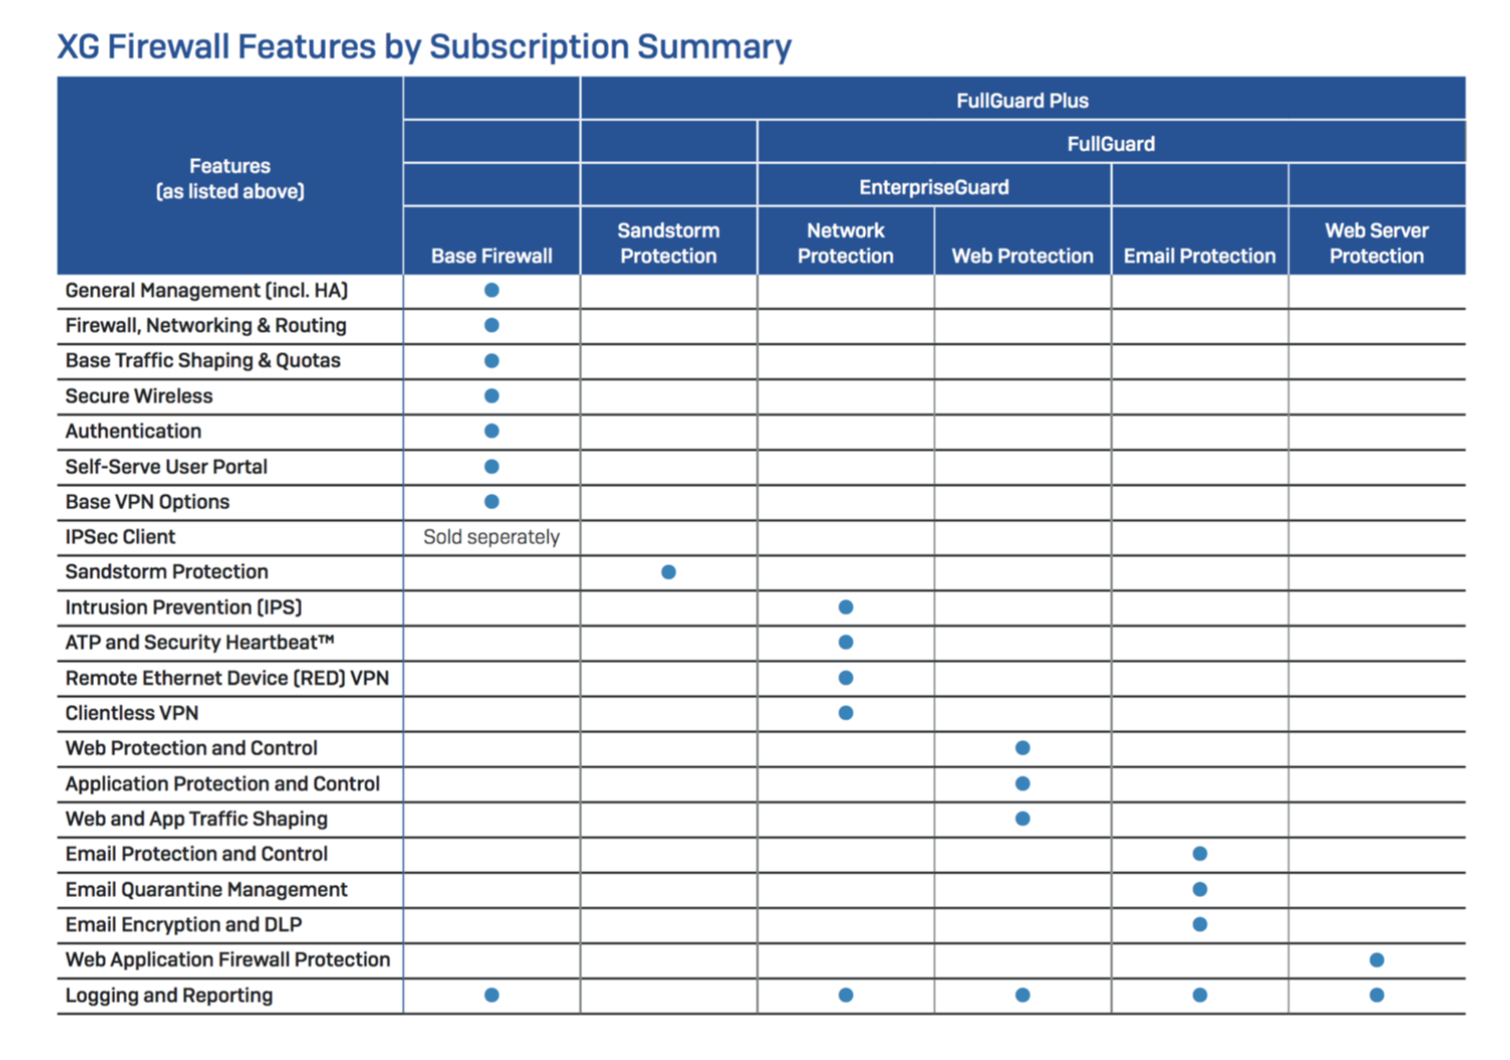
This article will show the first part of the functionality of the Sophos XG Firewall - "Monitoring and Analytics". The full review will be released as a series of articles. We will go, starting from the Sophos XG Firewall web interface and the licensing table
Trust Center
And so, we launched the browser and opened the web interface of our NGFW, we see an invitation to enter the login and password to enter the admin
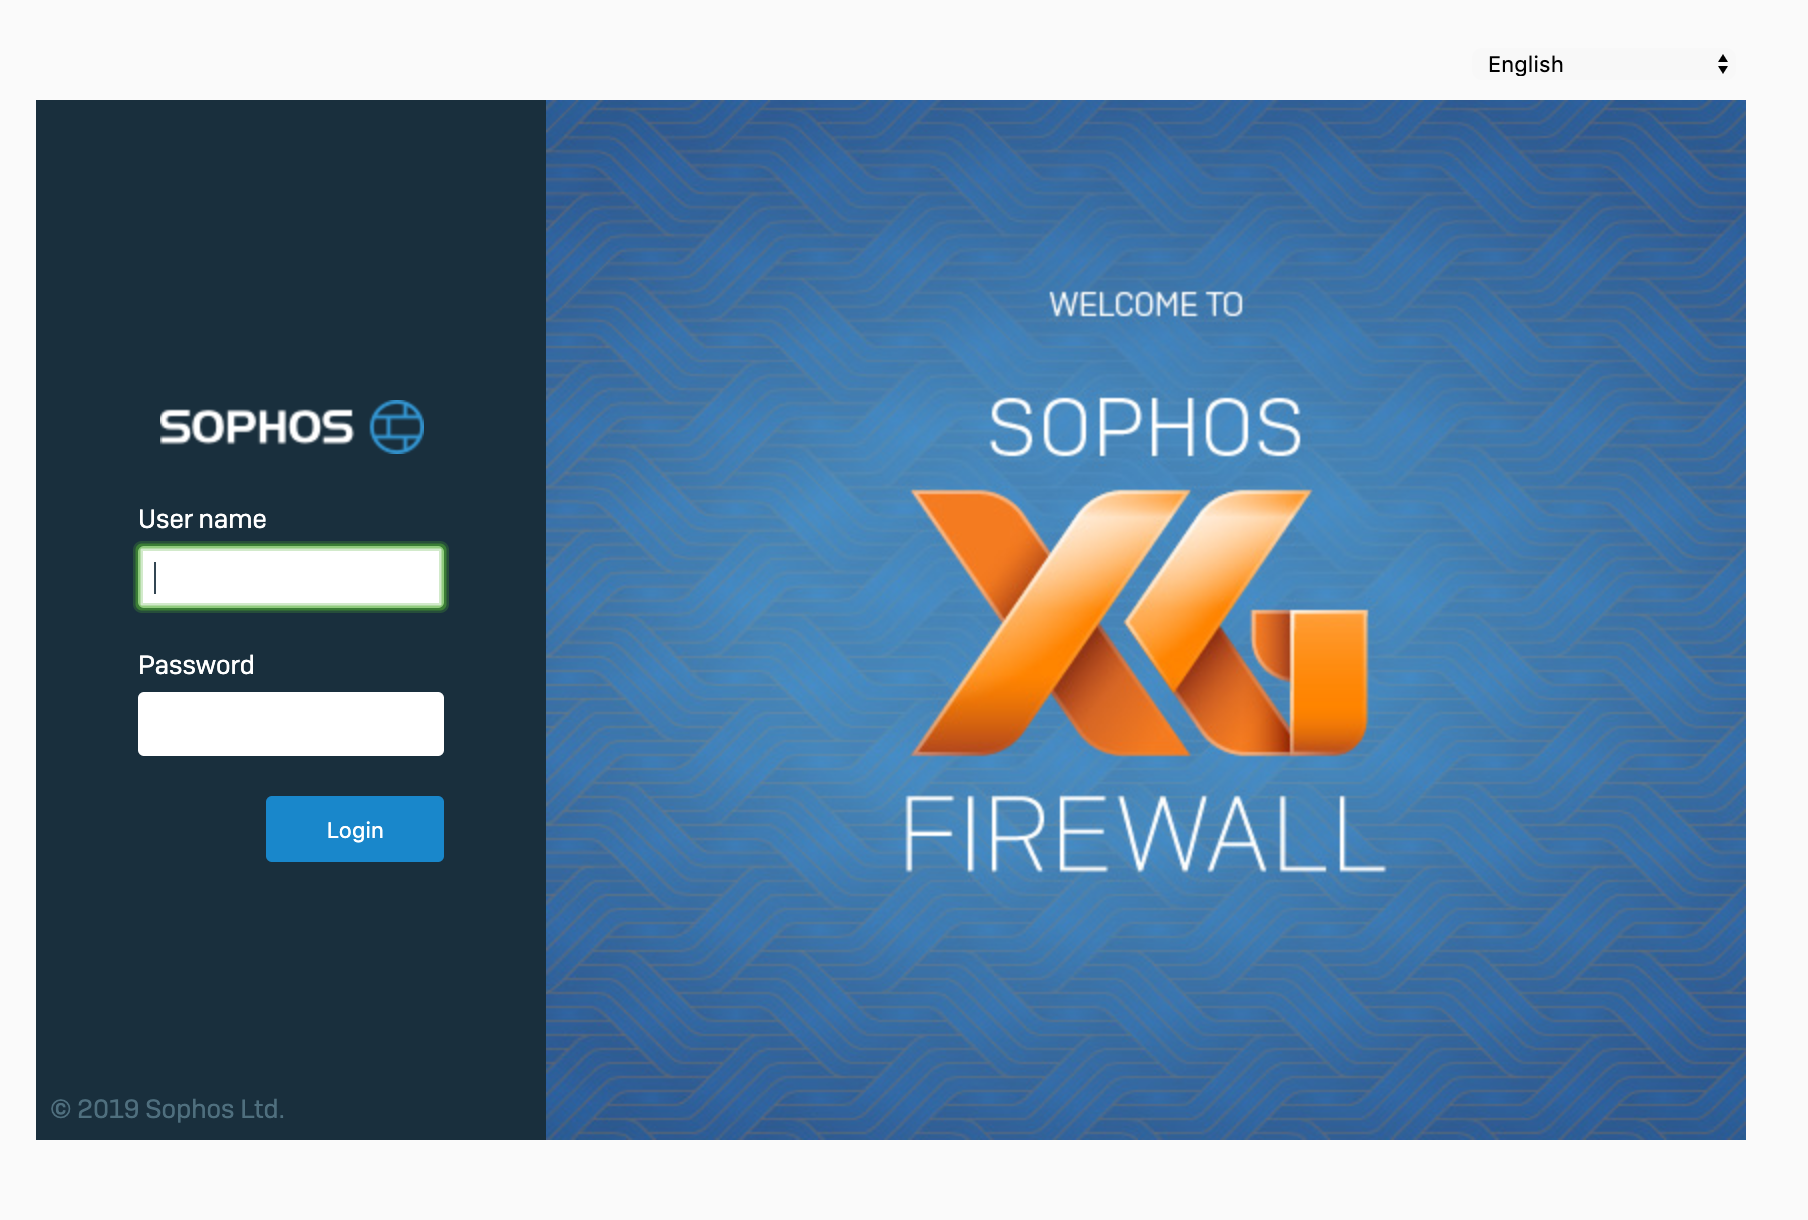
panel. Enter the login and password that we set during the initial activation and get to our control center. It looks like this
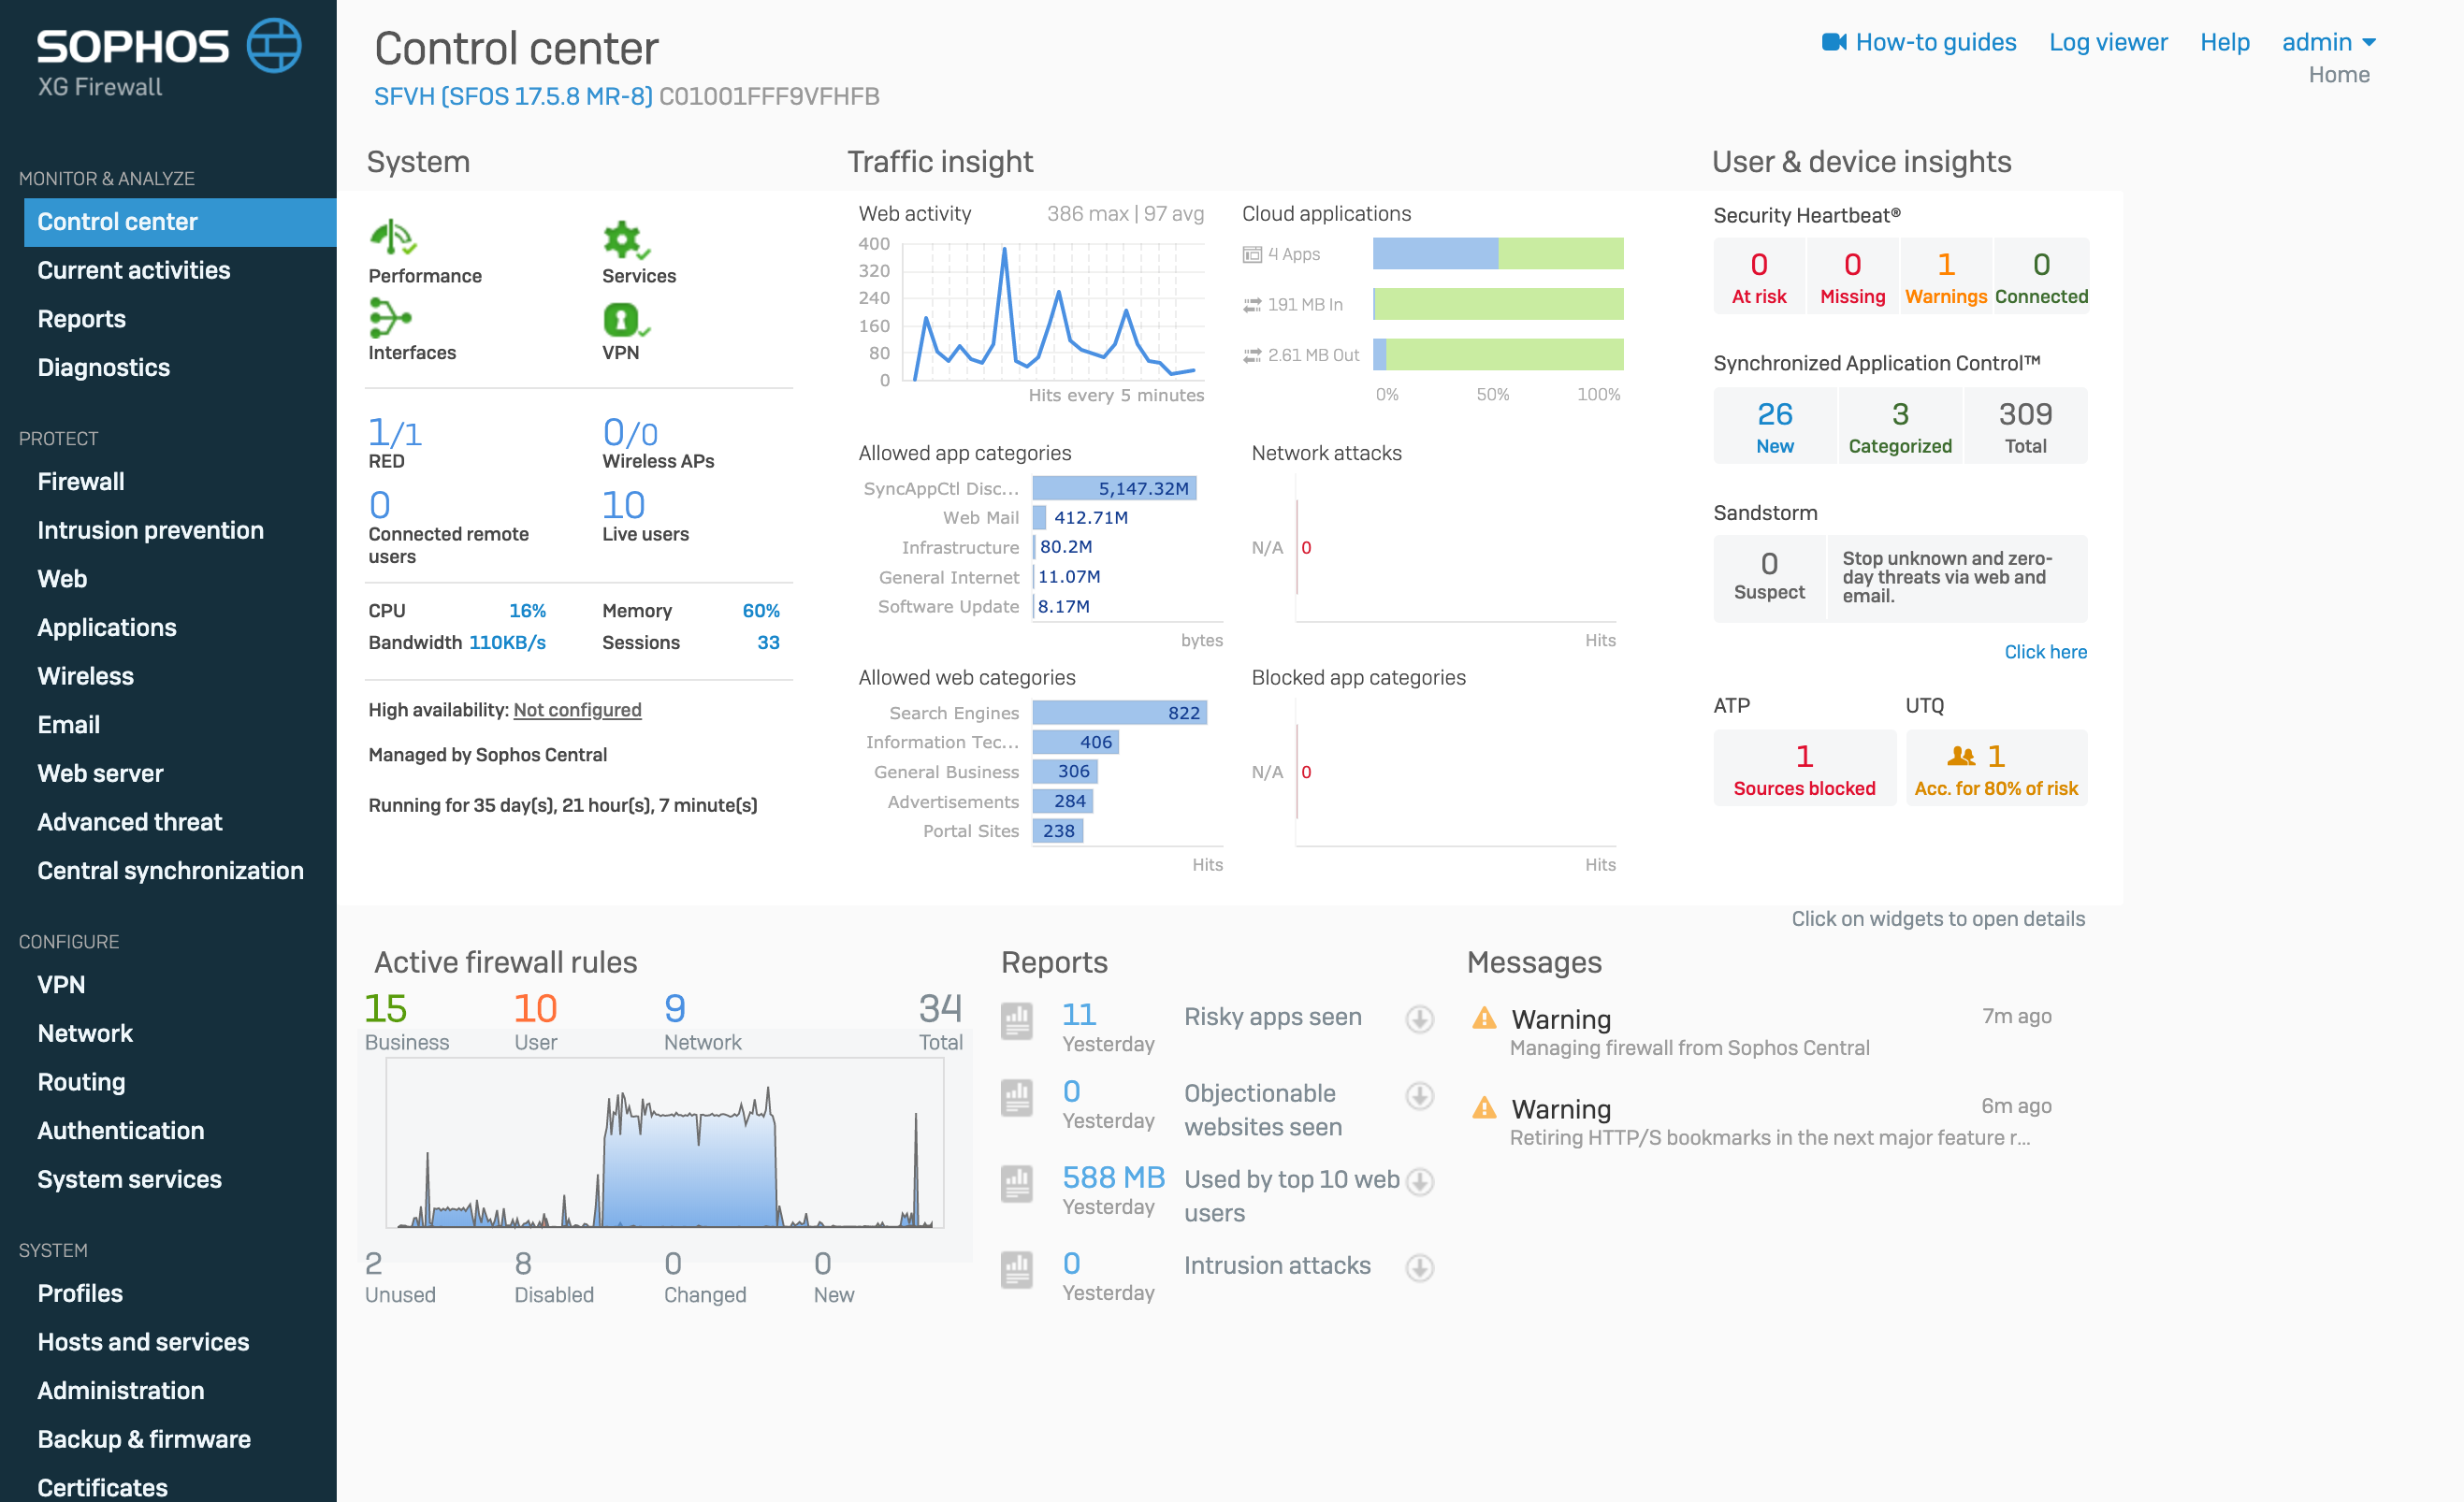
Almost every one of these widgets is clickable. You can fall into the incident and see the details.
Let's take a look at each of the blocks, and we'll start with the System block.
System block
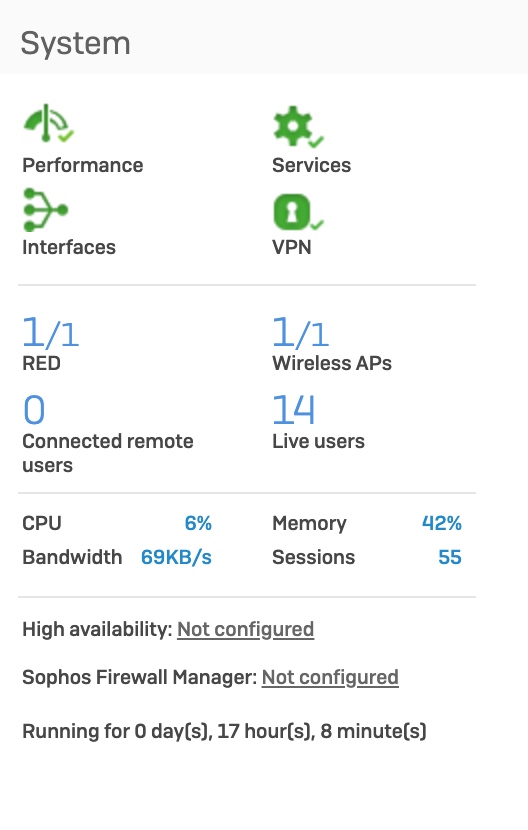
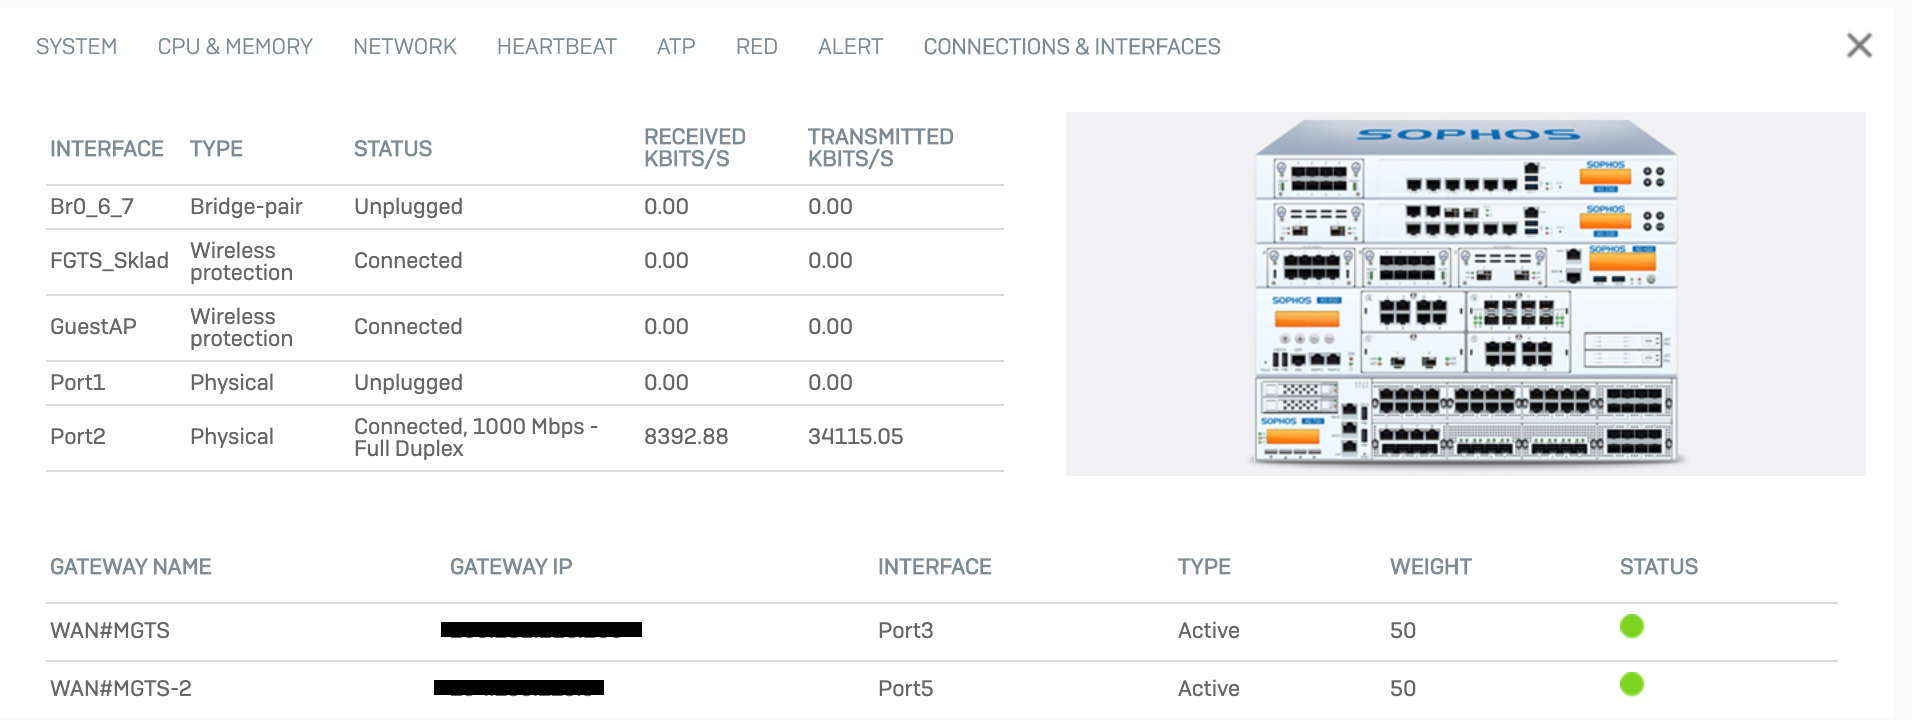
This block displays the state of the machine in real time. If you click on any of the icons, then we will go to a page with more detailed information about the state of the
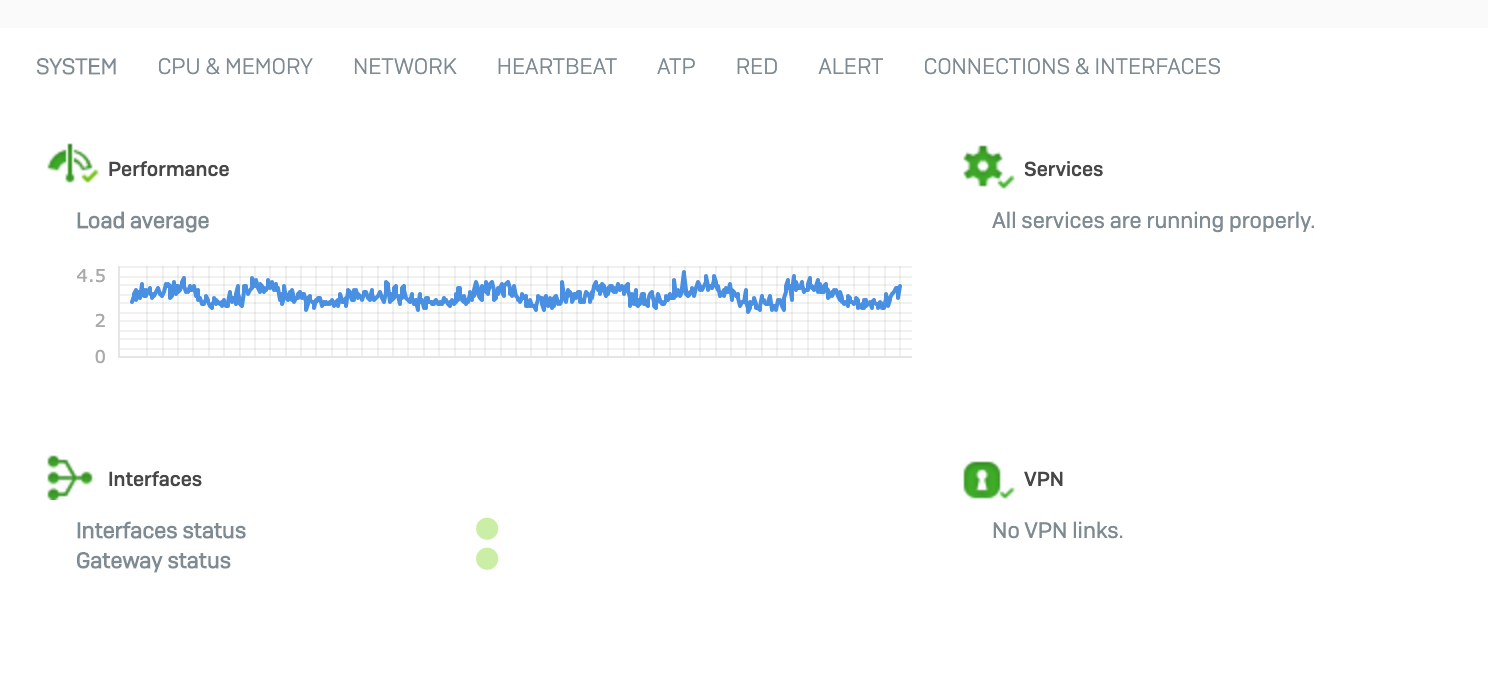
system.If there are problems in the system, then this widget will signal this, and on the information page you can see the
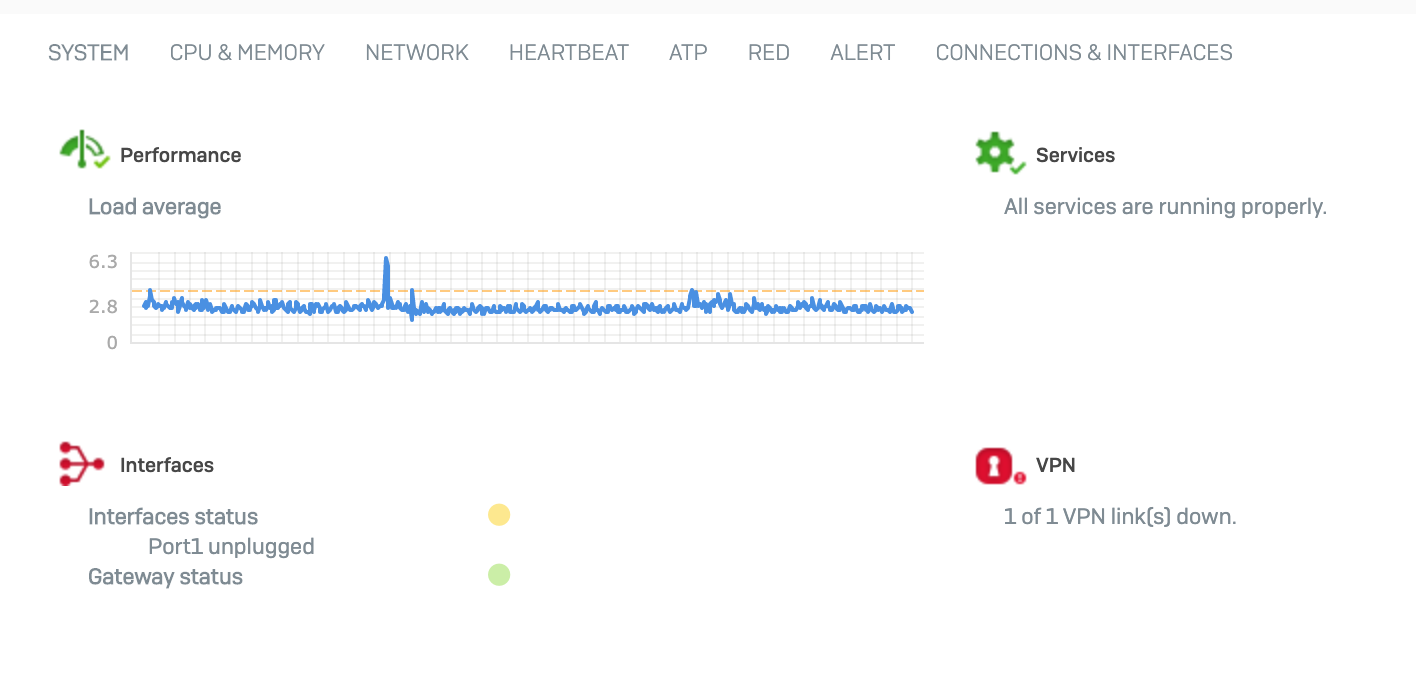
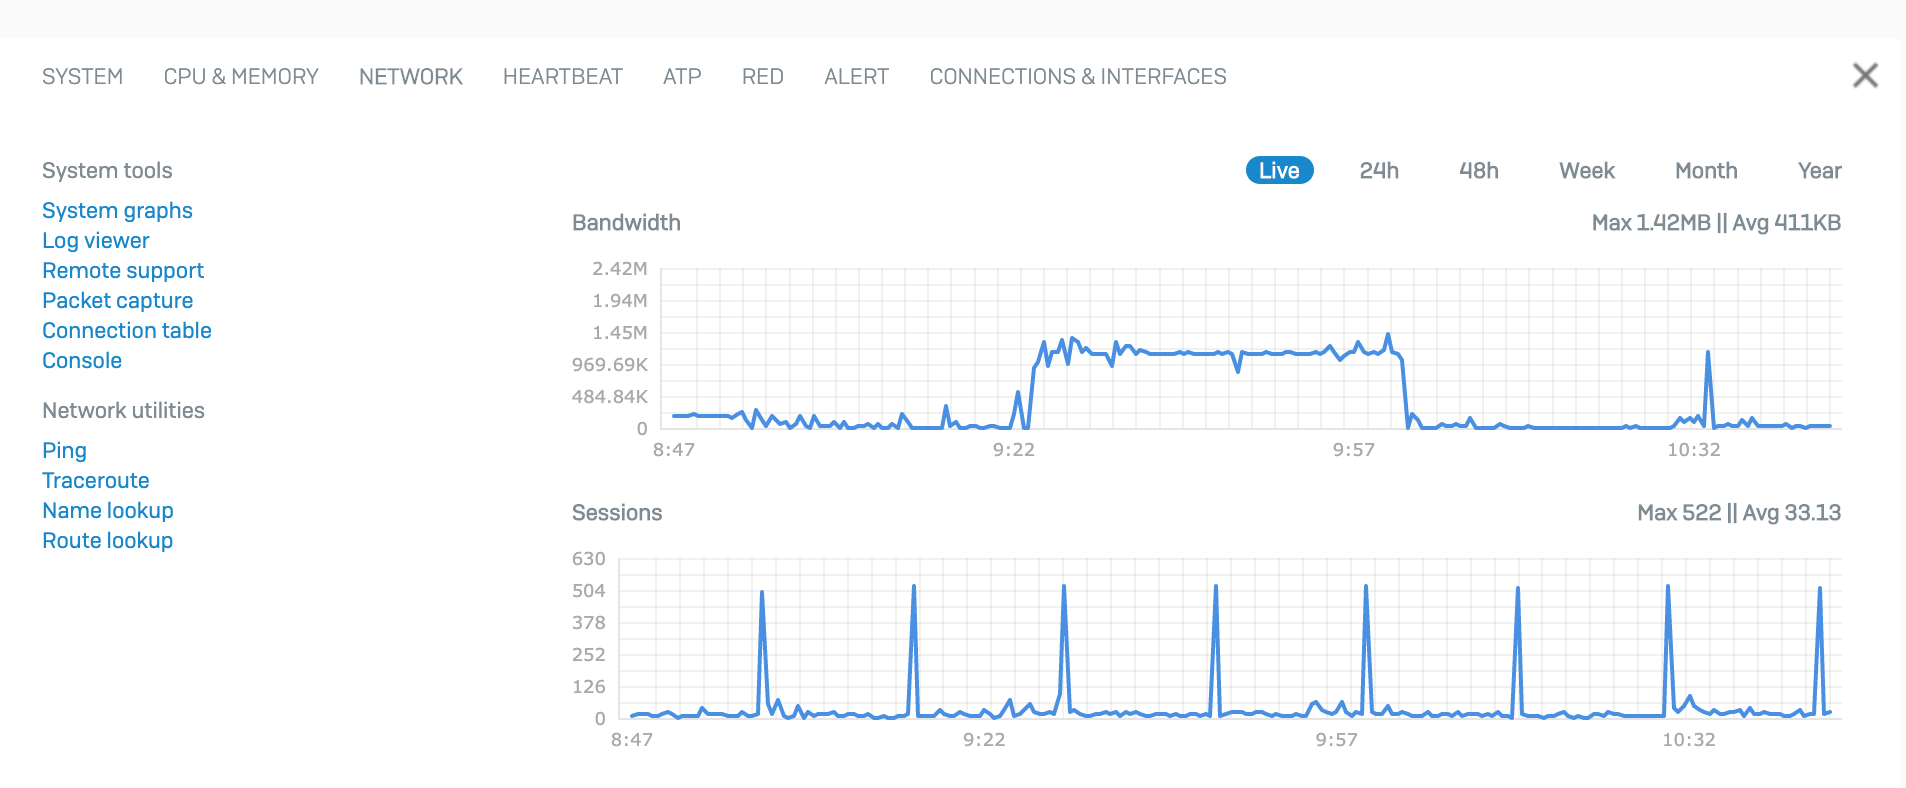
reason.Clicking on the tabs, you can get more information about various aspects firewall operation

Traffic insight block
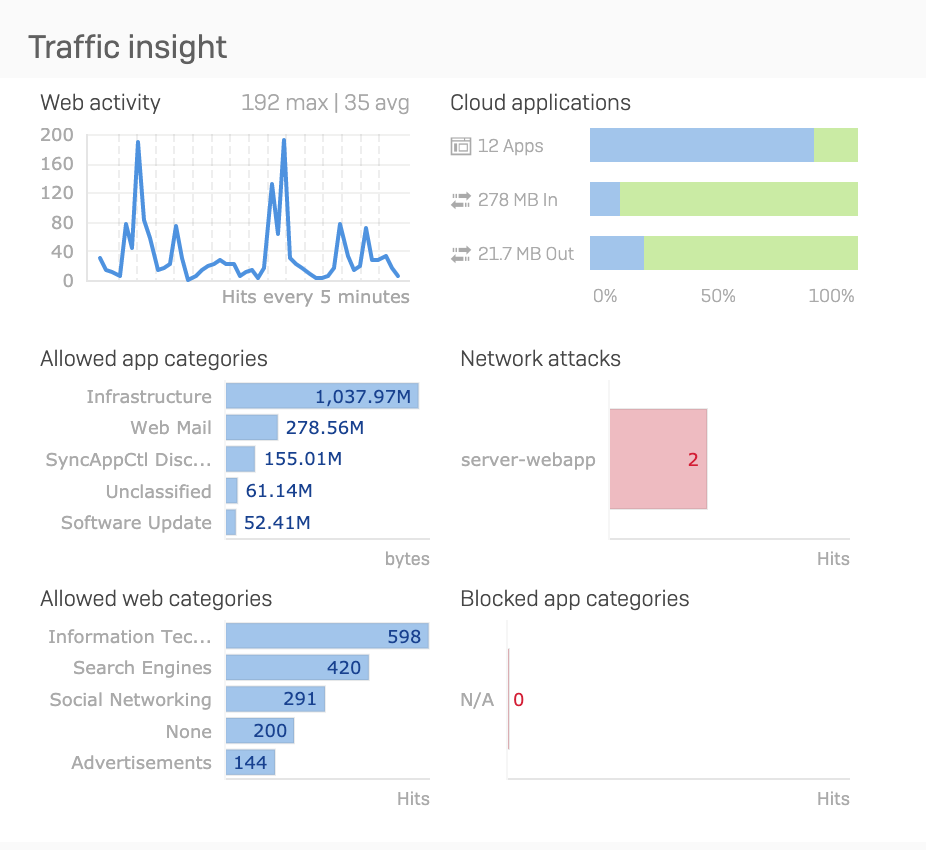
This section gives us an idea of what is happening on our network at the moment and what has happened in the last 24 hours. Top 5 web categories and applications by traffic, network attacks (triggered by an IPS module) and top 5 blocked applications.
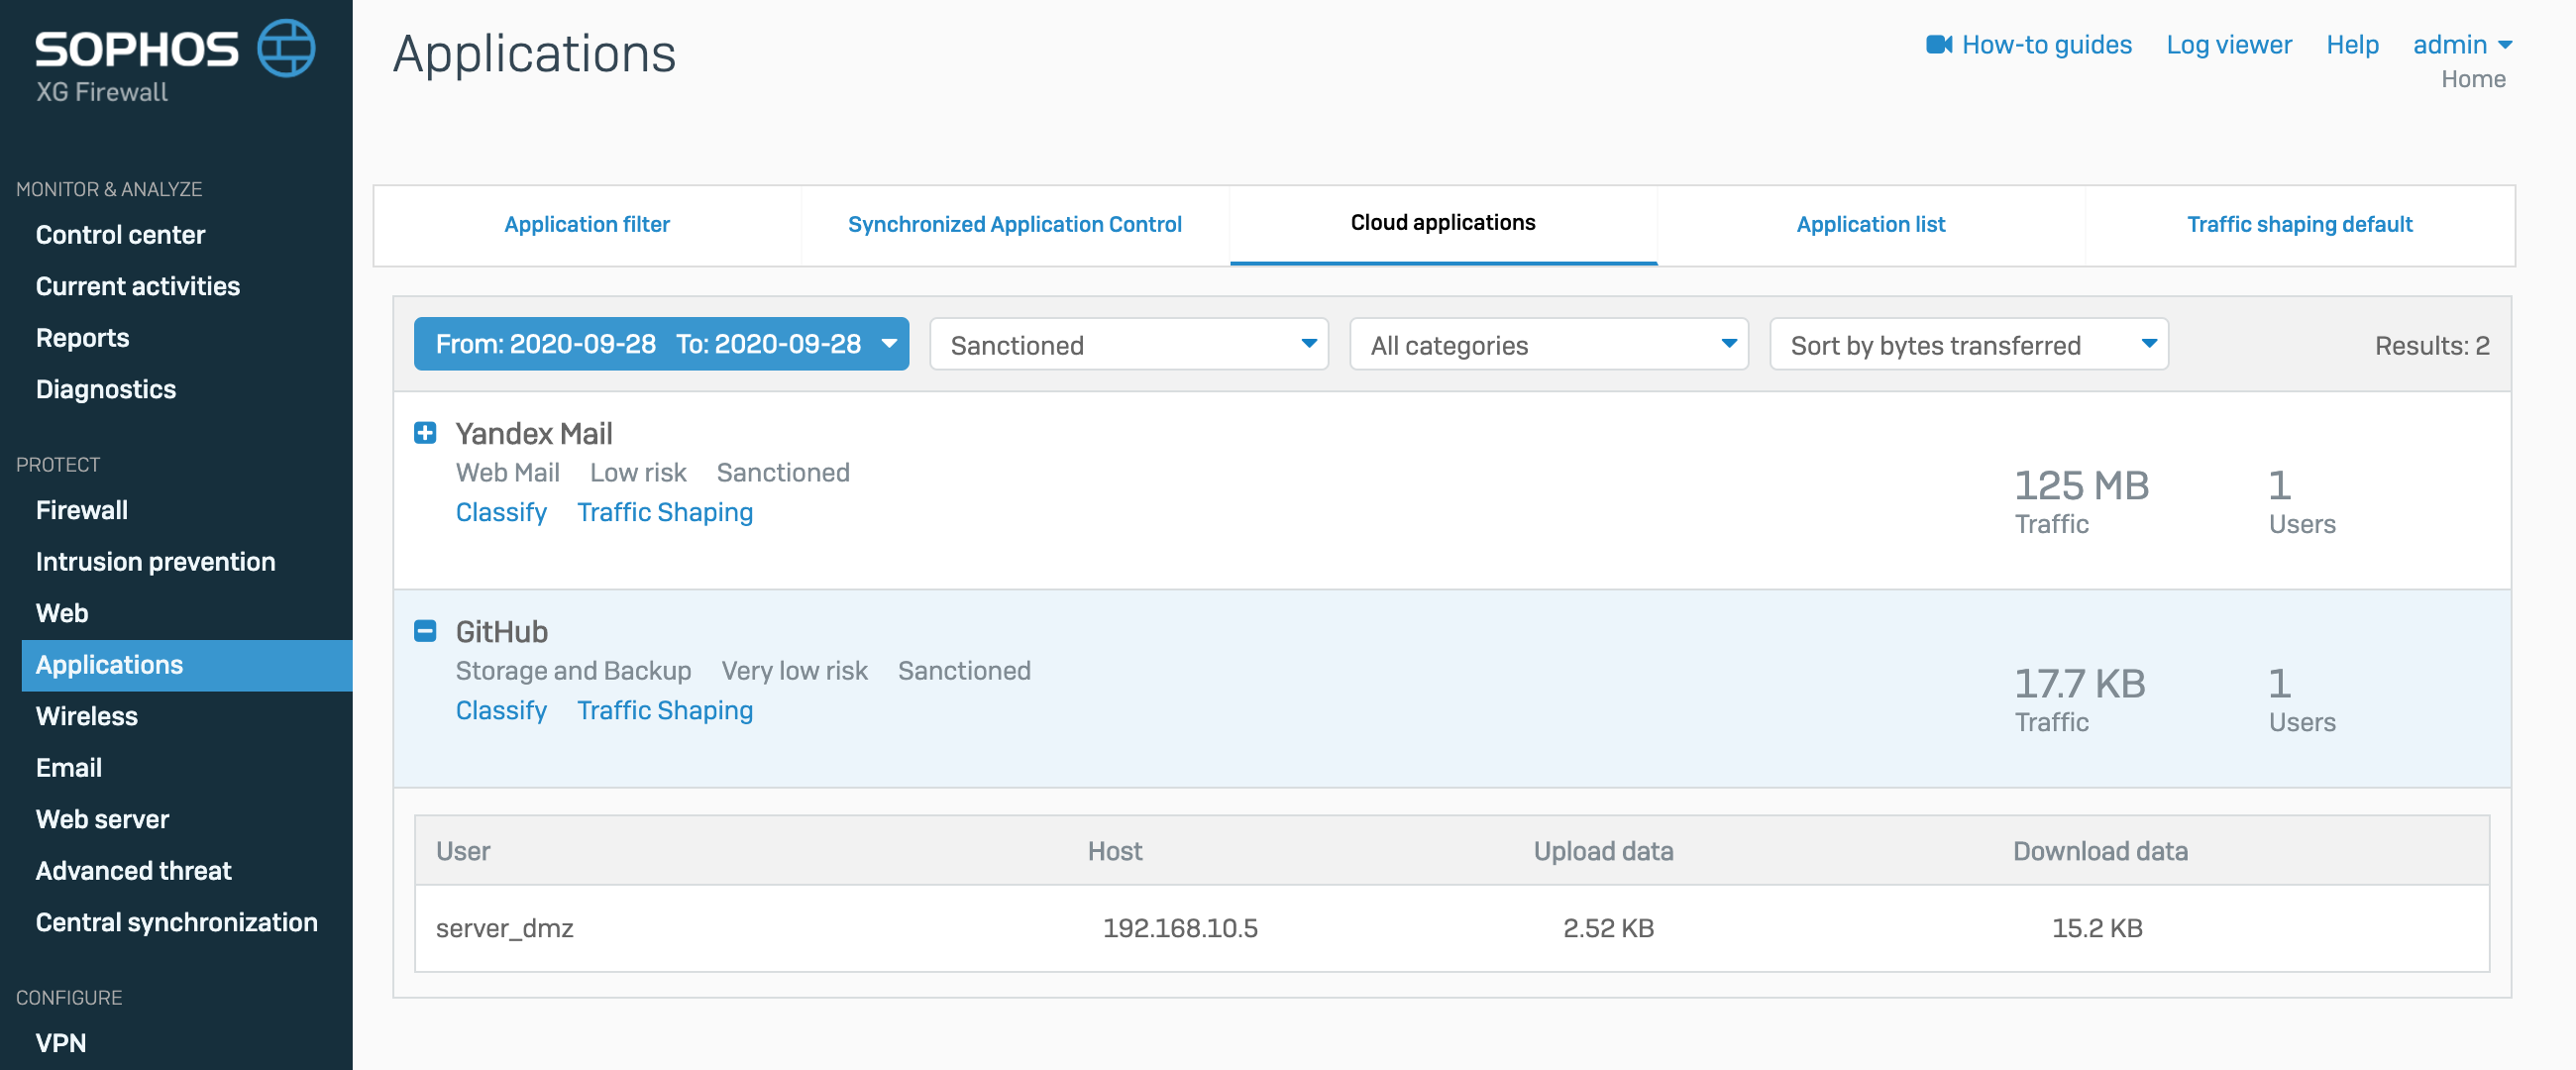
Also, it is worth highlighting the Cloud Applications section. In it, you can see the presence in the local network of applications that use cloud services. Their total number, incoming and outgoing traffic. If you click on this widget, then we will fall through to the information page on cloud applications, where we can see in more detail what cloud applications are on the network, who uses them and information about traffic
User & device insights block
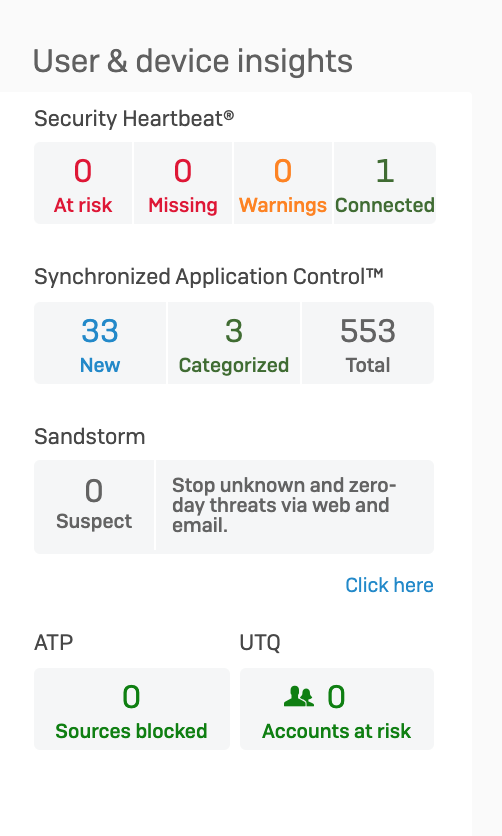
This block shows information about users. The top line shows us information about the infected computers of users, collecting information from the antivirus from Sophos and transferring it to the Sophos XG Firewall. According to this information, the Firewall can, during infection, disconnect the user's computer from the local network or network segment at the L2 level, blocking all connections with it. More details about Security Heartbeat were in this article . Next two lines are application control and cloud sandbox. Since this is a separate feature, it will not be covered in this article.
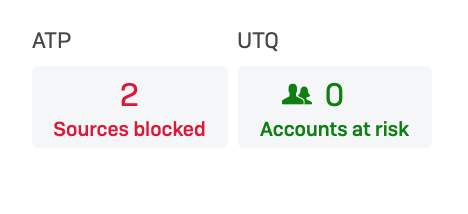
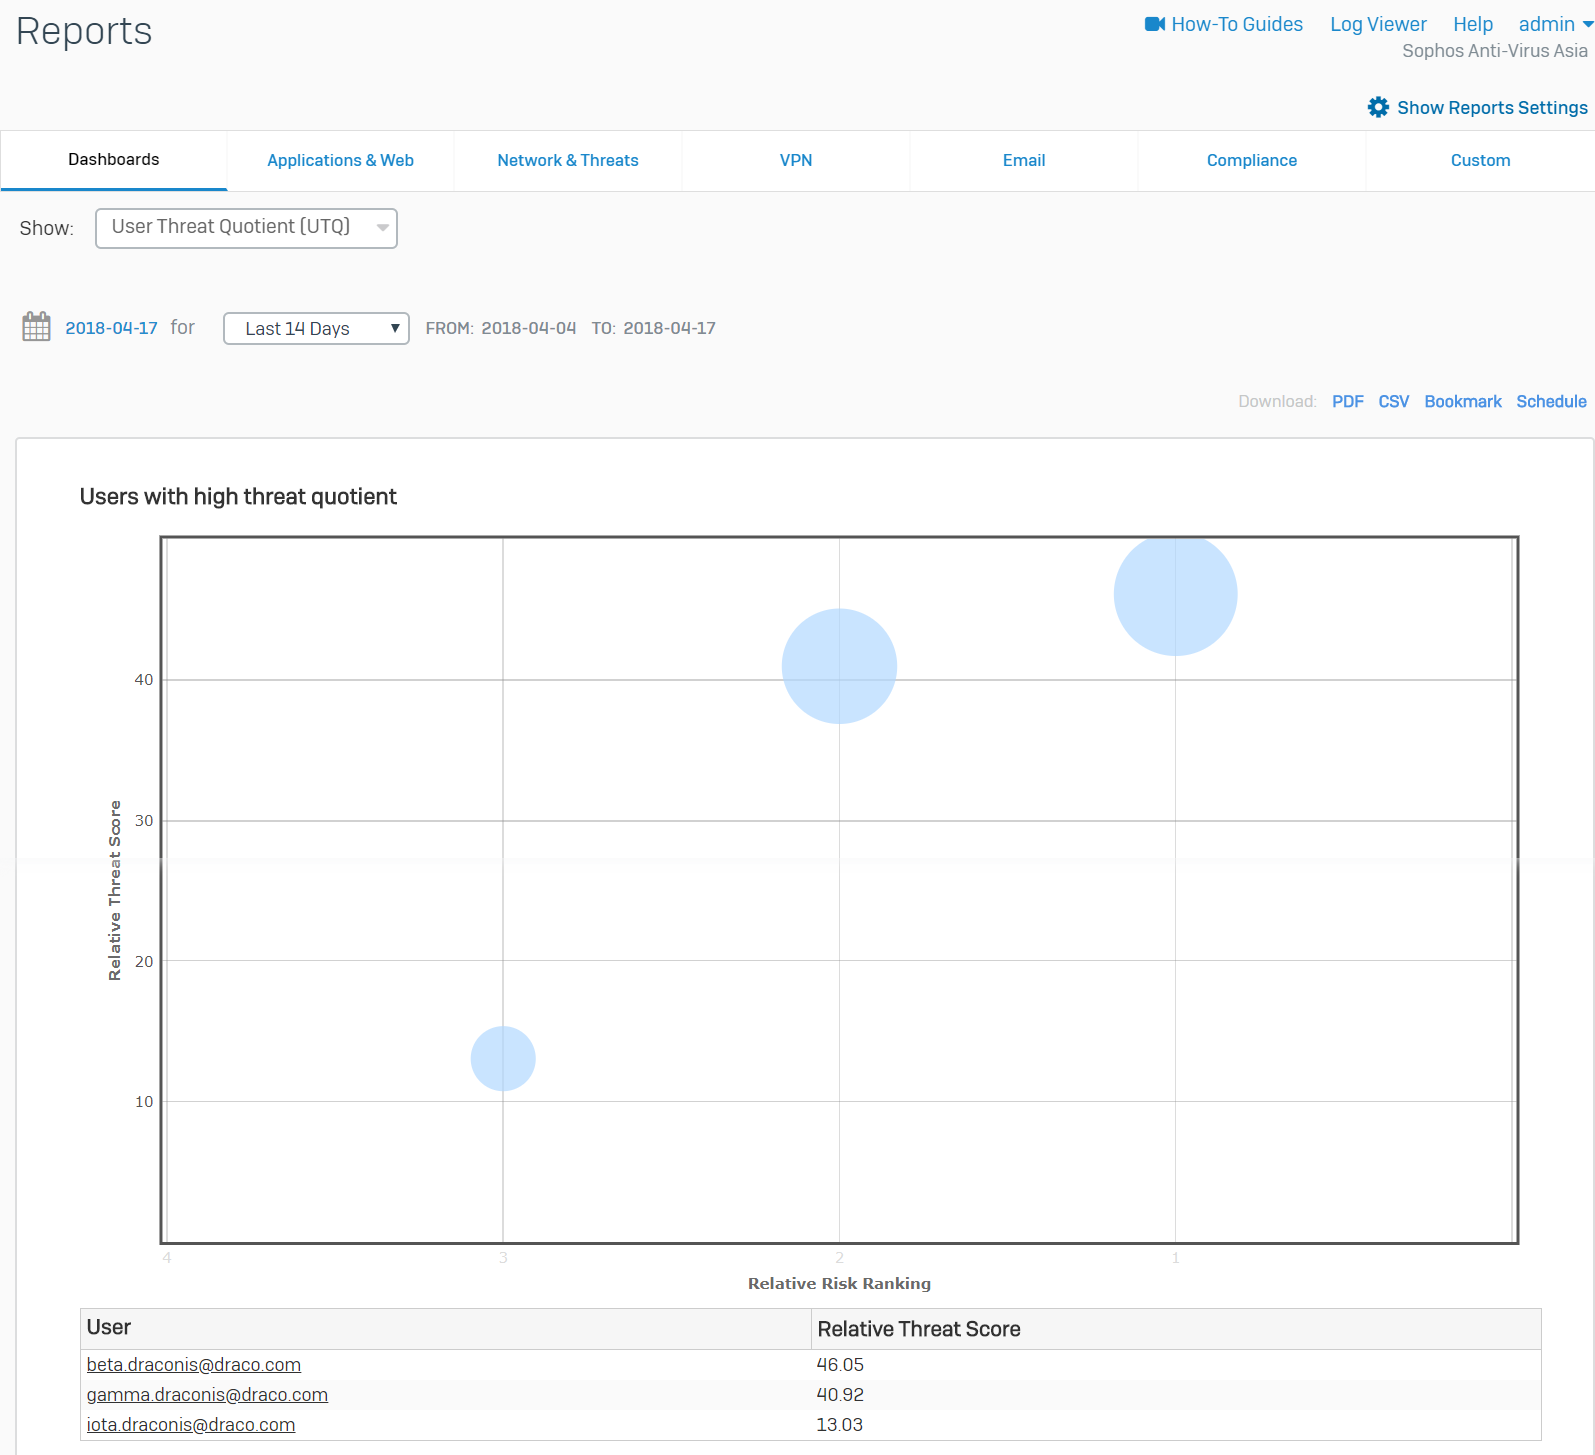
It is worth paying attention to the two lower widgets. These are ATP (Advanced Threat Protection) and UTQ (User Threat Quotient).
The ATP module blocks connections with C&C, managing botnet network servers. If a device on your local network gets into a botnet network, this module will report it and will not allow you to connect to the control server. It looks like this

The UTQ module assigns a security index to each user. The more a user tries to go to prohibited sites or run prohibited applications, the higher his rating becomes. Based on this data, it is possible to conduct training in advance for such users without waiting for the fact that, in the end, his computer will be infected with malware. It looks like this
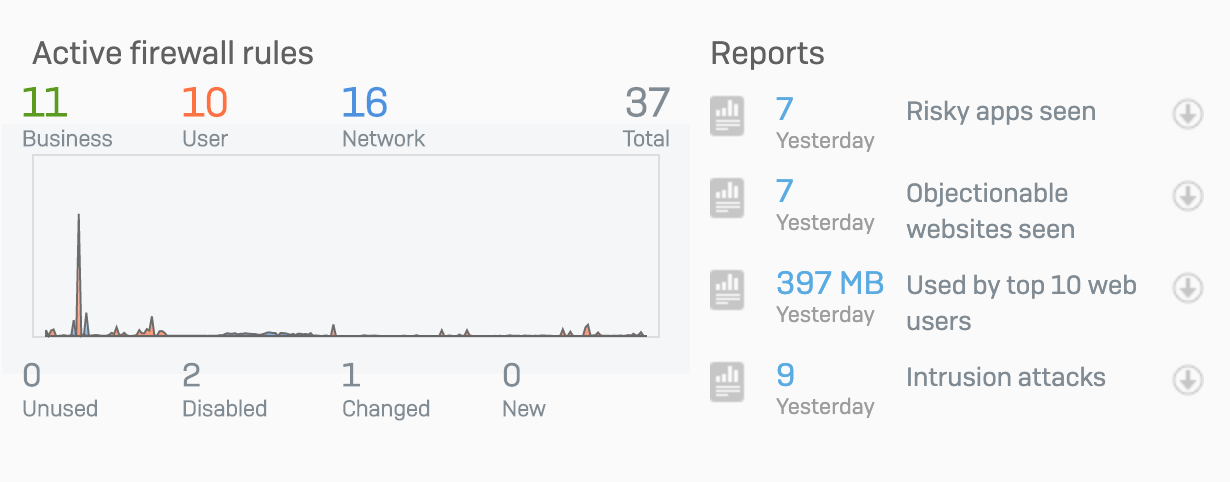
Next is a section of general information about active firewall rules and hot reports that can be quickly downloaded in pdf format
Let's move on to the next menu section - Current activities
Current activities
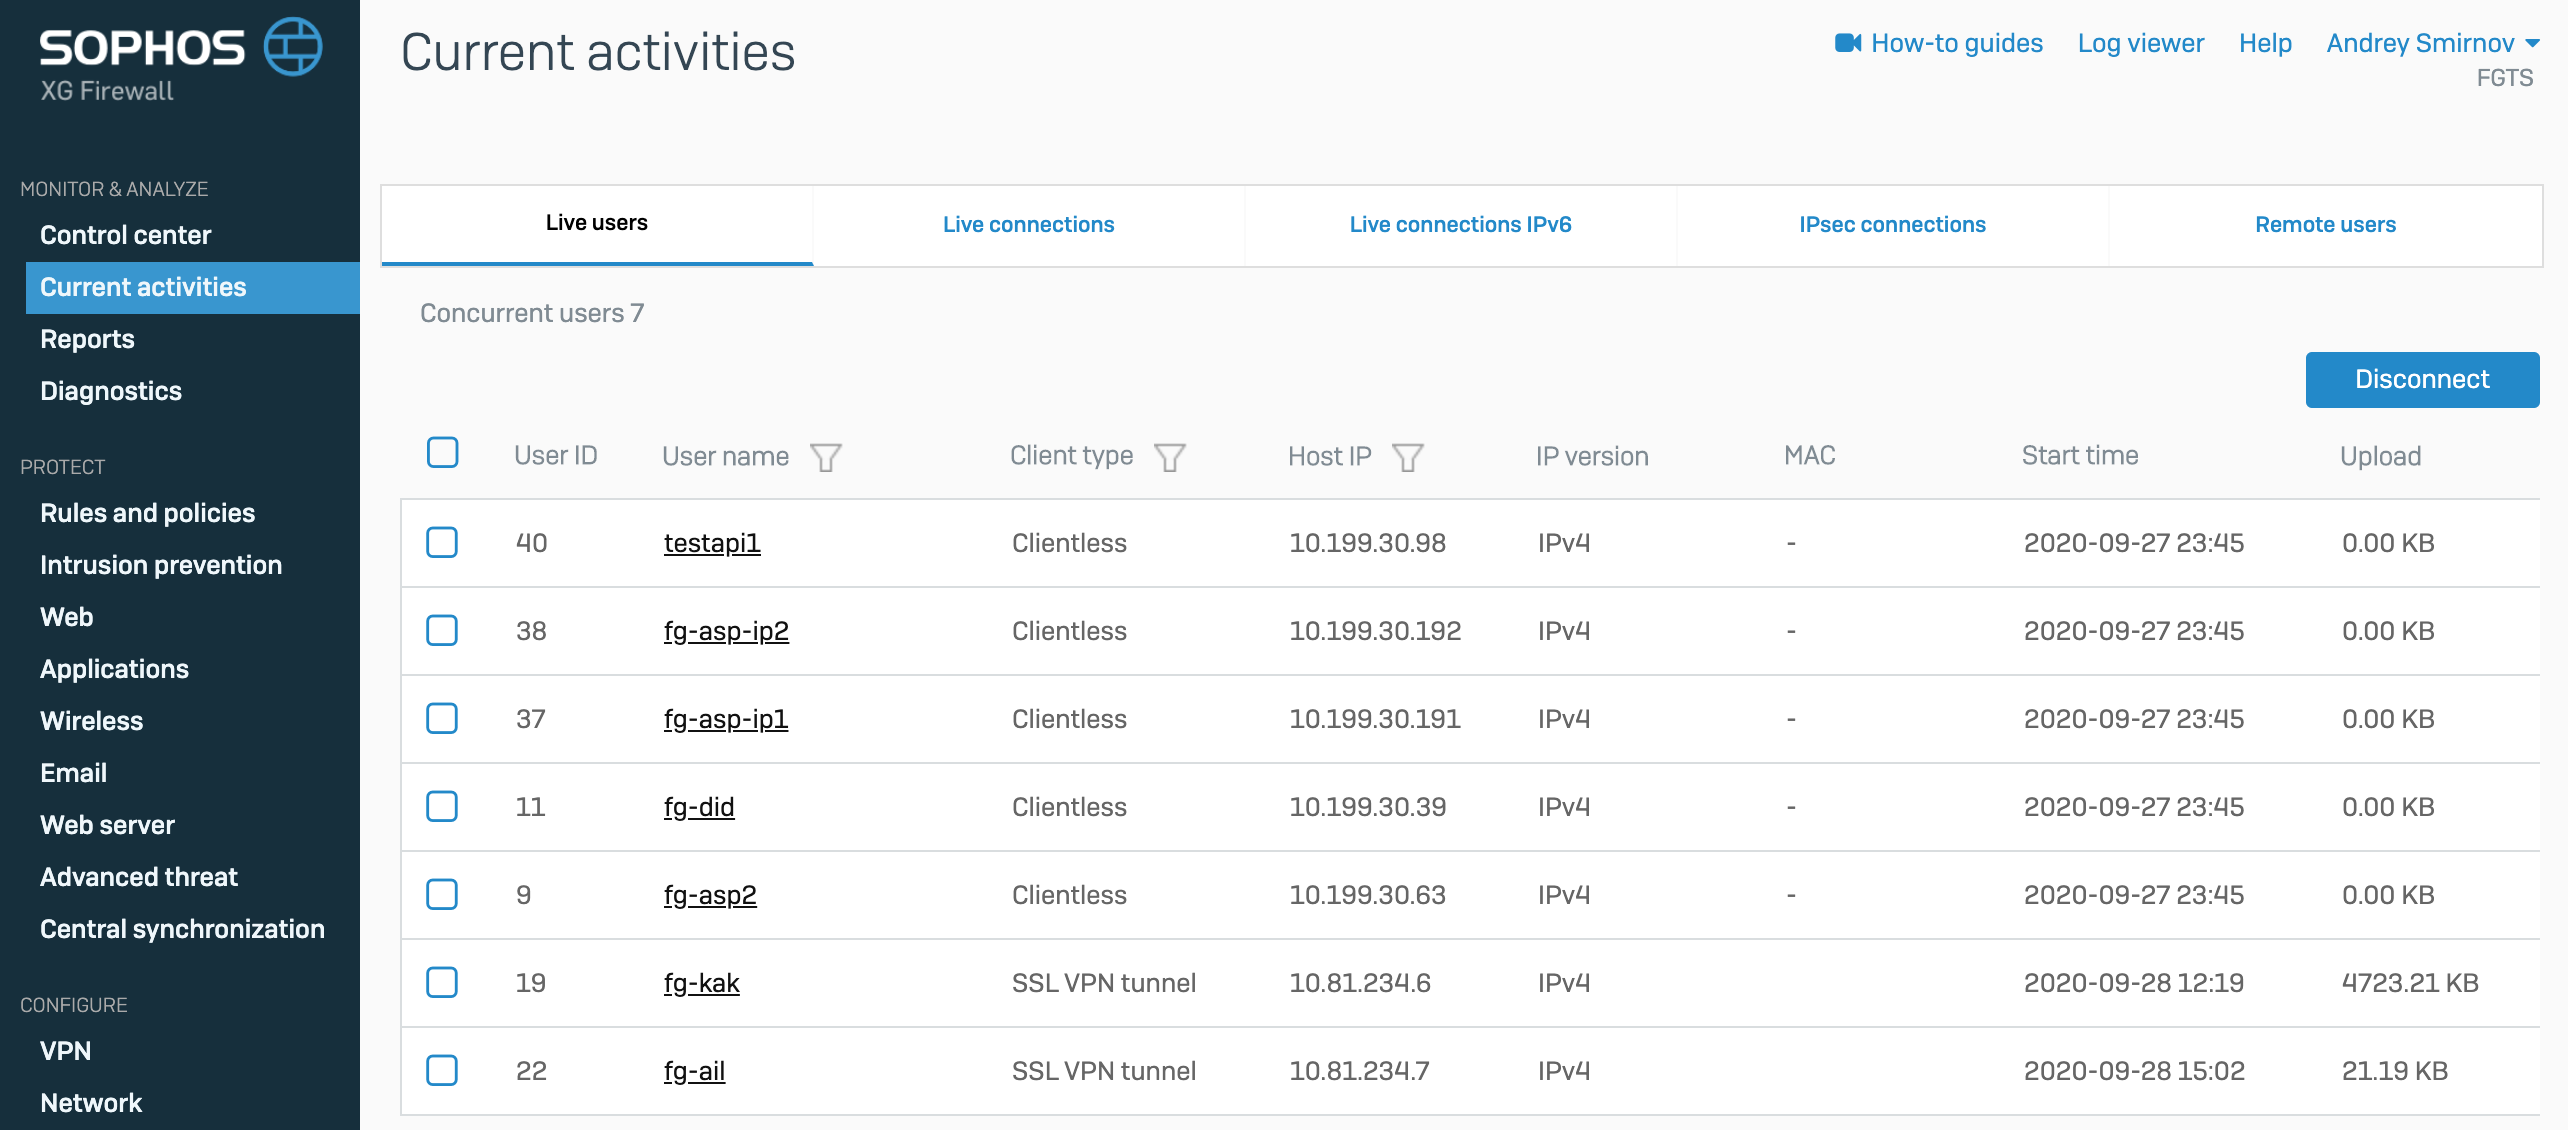
Let's start with the Live users tab. On this page, we can see which of the users is currently connected to the Sophos XG Firewall, the authentication method, the ip address of the machine, the connection time and the volume of traffic.
Live connections

This tab displays active sessions in real time. This table can be filtered by applications, users and IP addresses of client machines.
IPsec connections

This tab displays information about active IPsec VPN connections
Remote users tab
The Remote users tab contains information about remote users who have connected via SSL VPN.

Also, on this tab, you can view traffic by users in real time and forcefully disconnect any user.
Let's skip the Reports tab, since the reporting system in this product is very voluminous and requires a separate article.
Diagnostics
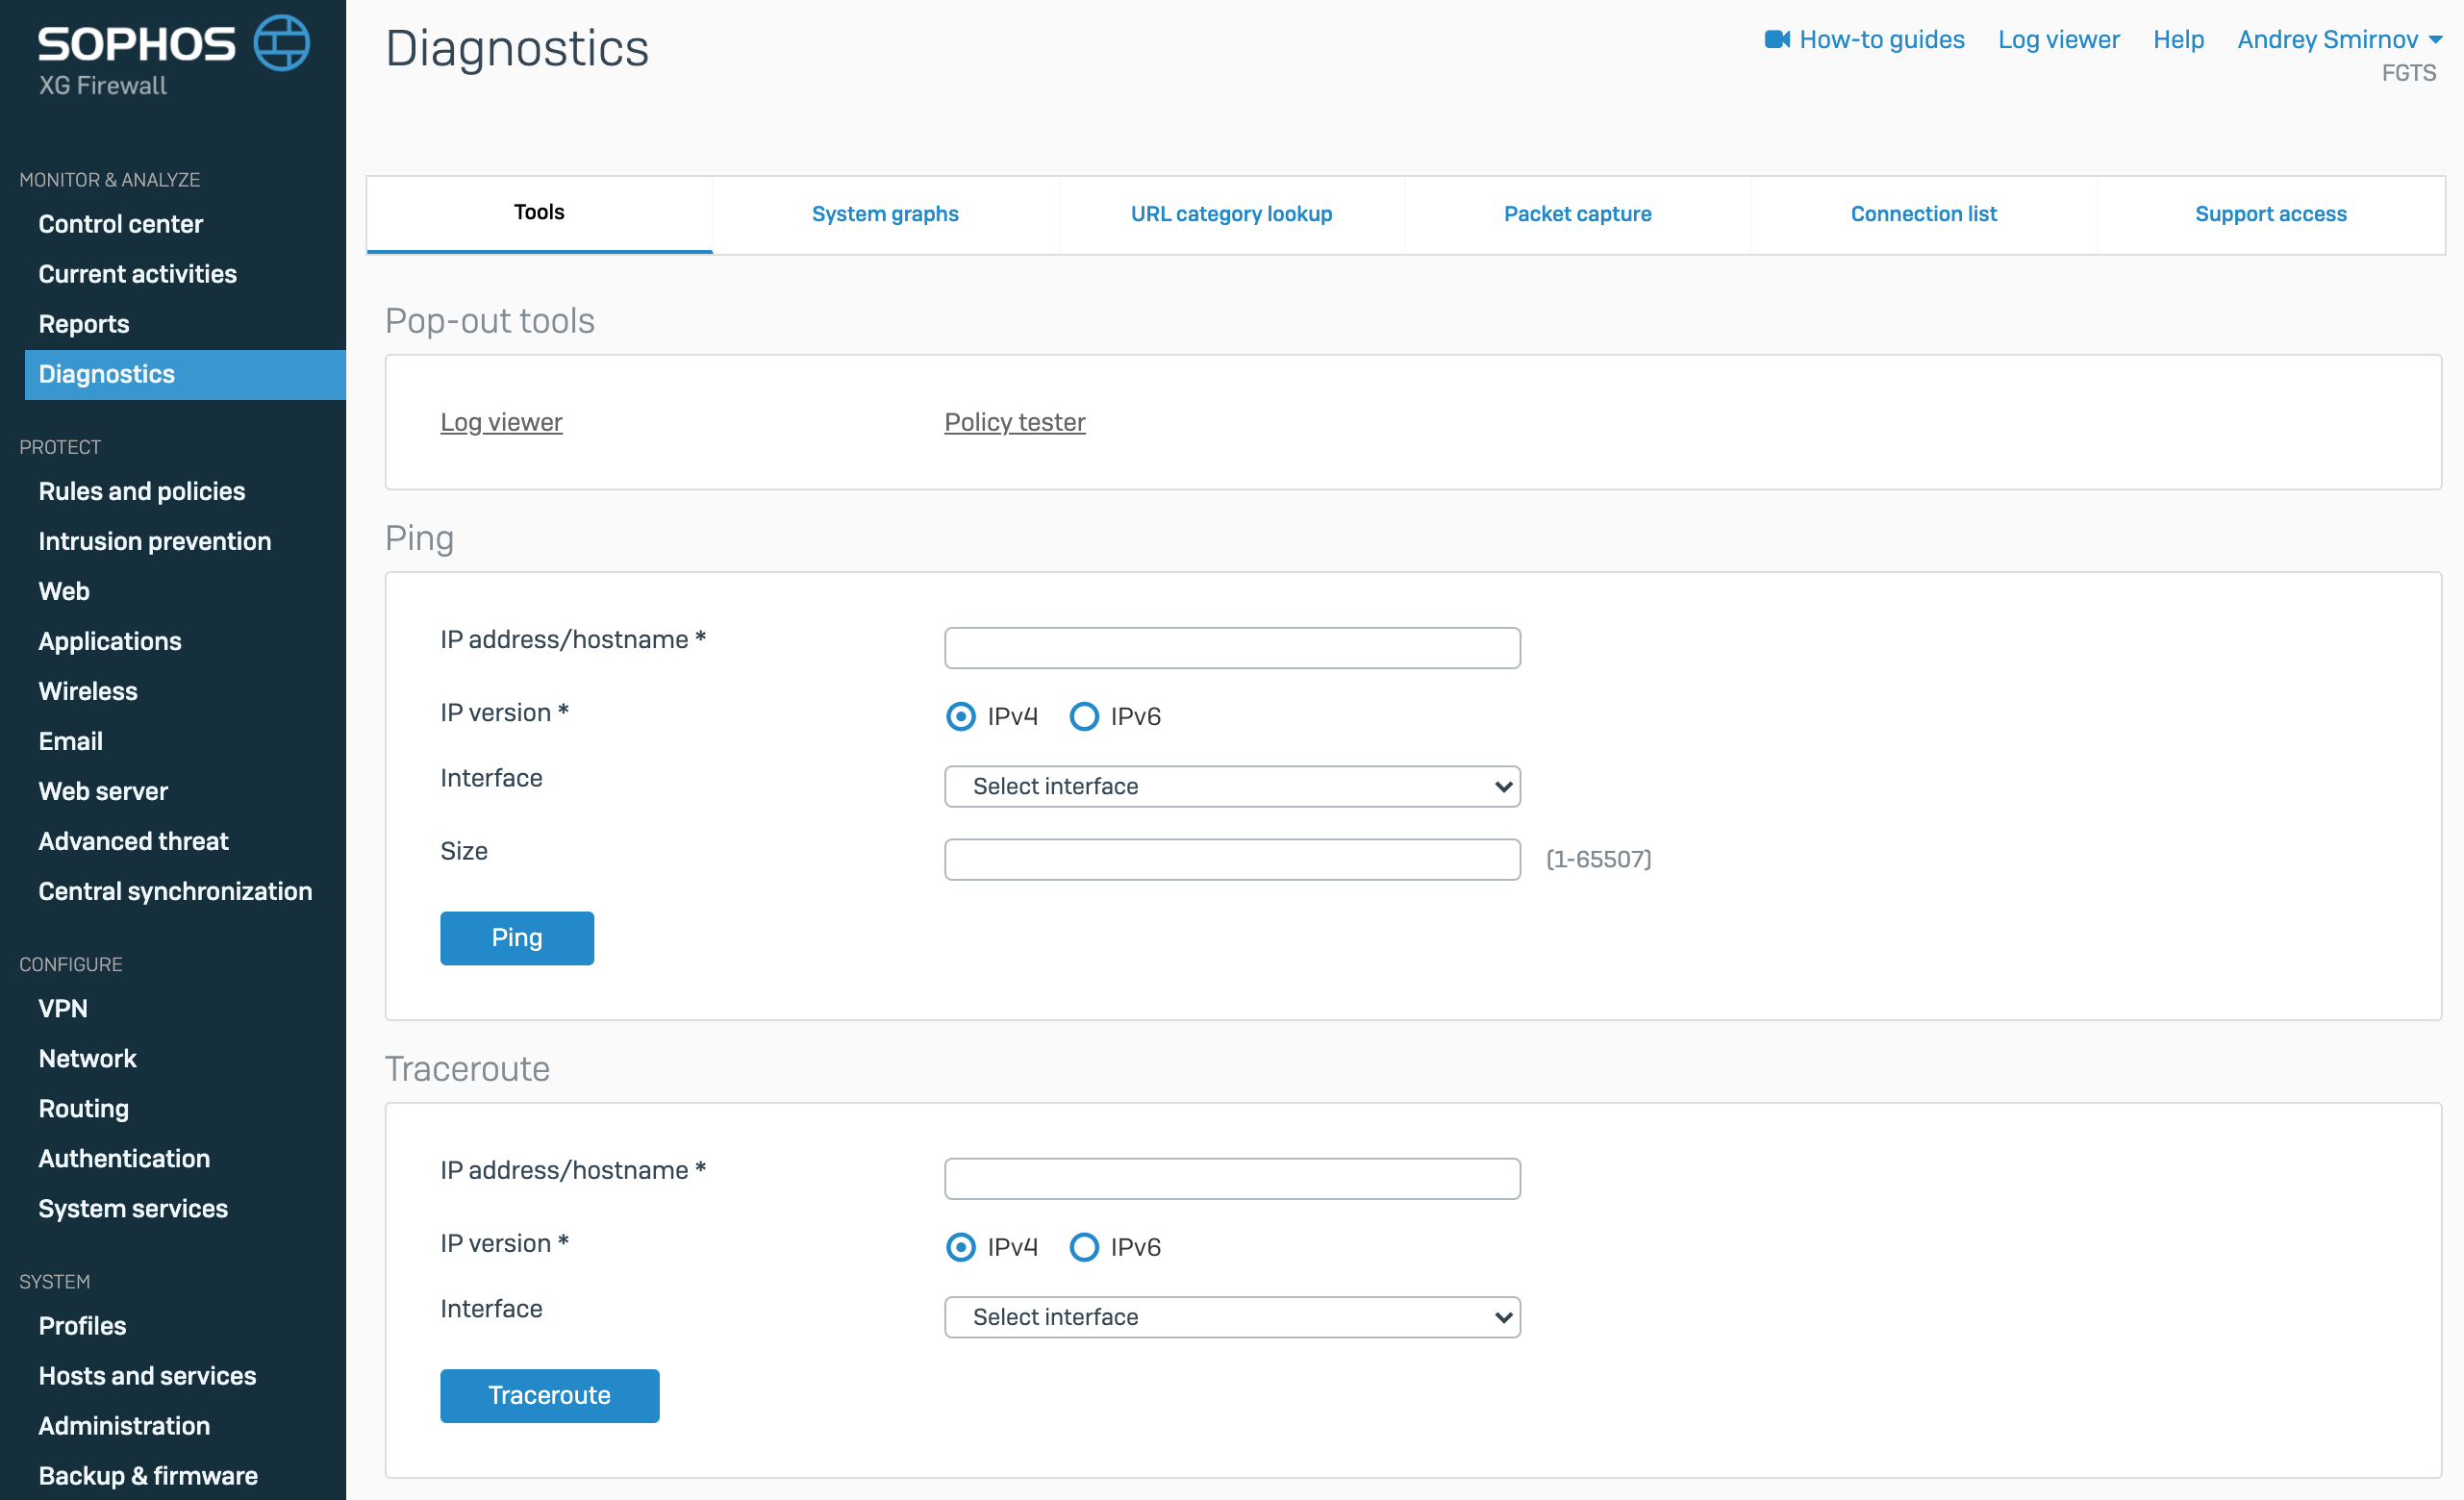
A page with various problem search utilities opens immediately. These include Ping, Traceroute, Name lookup, Route lookup.
Next is a tab with system graphs of hardware and ports loading in real time
System graphs
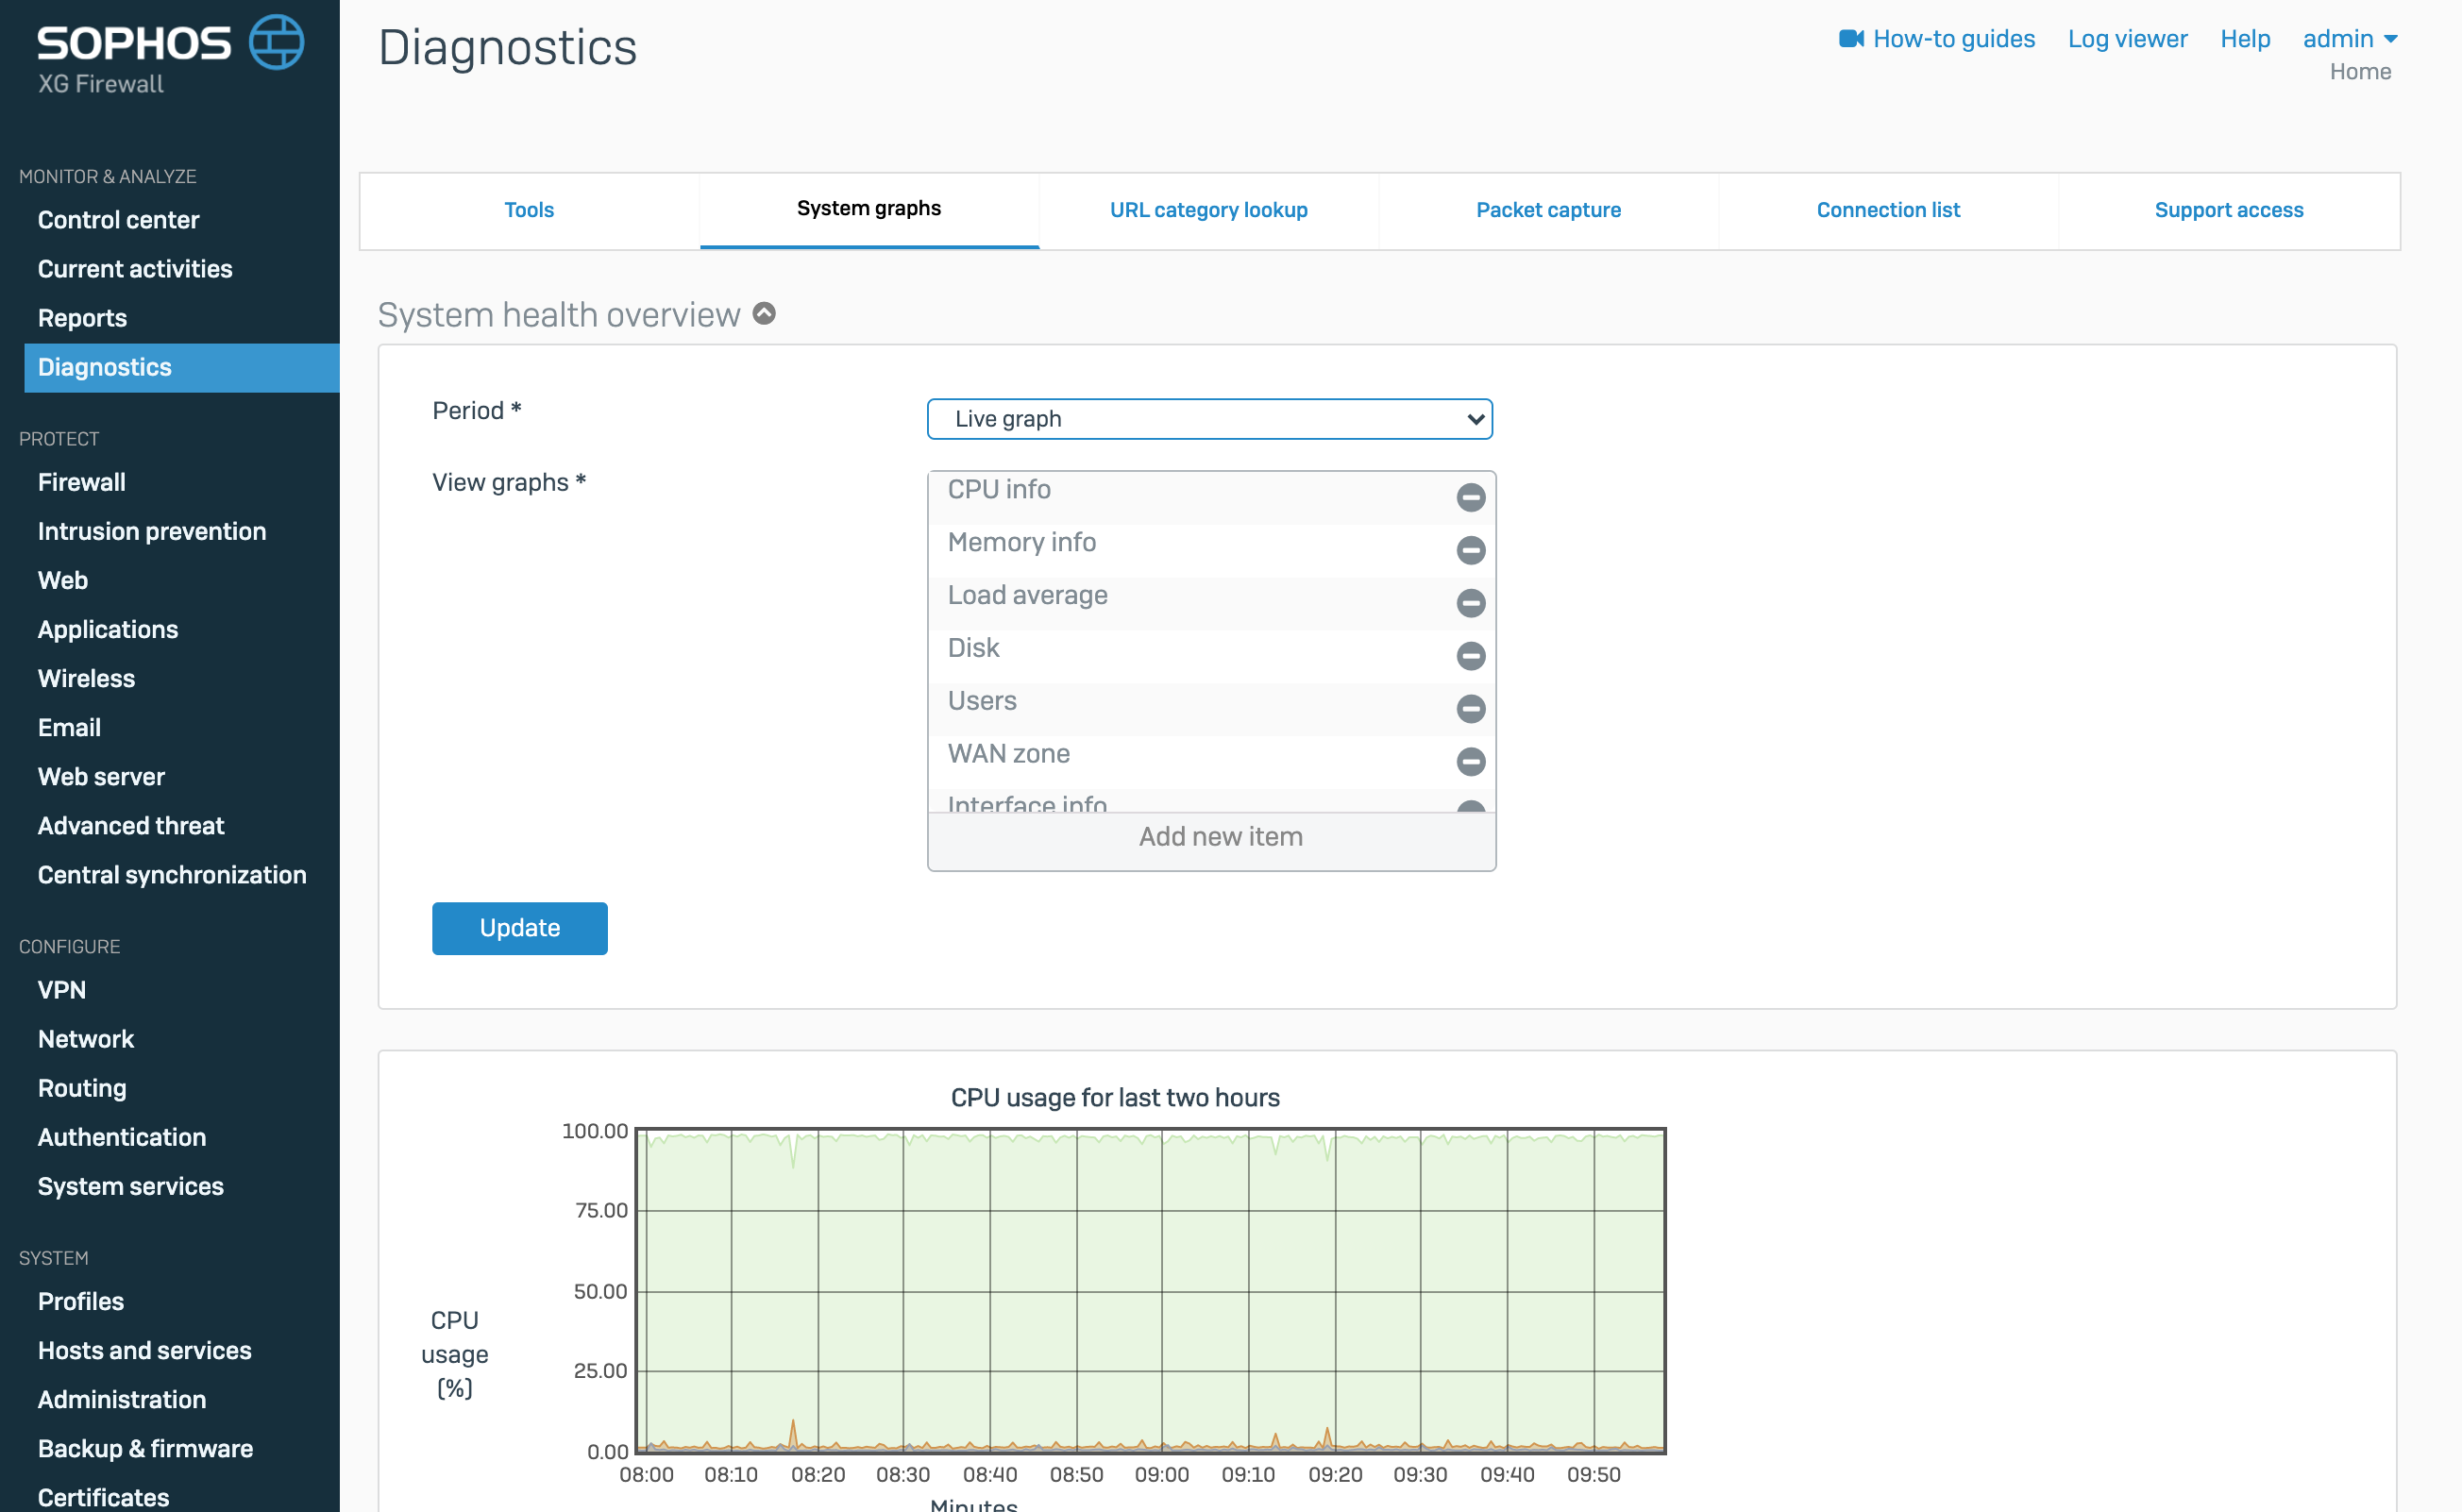
Then a tab where you can check the category of the web resource
URL category lookup

The next tab Packet capture is, in fact, a built-in tcpdump web interface. Filters can also be written
Packet capture
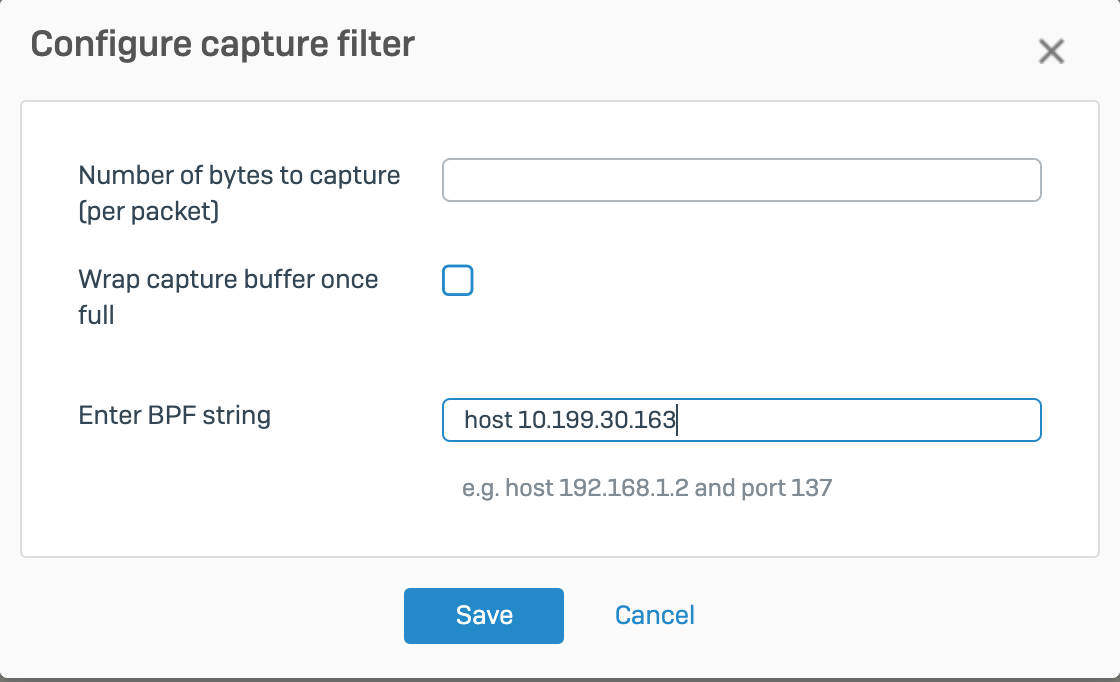
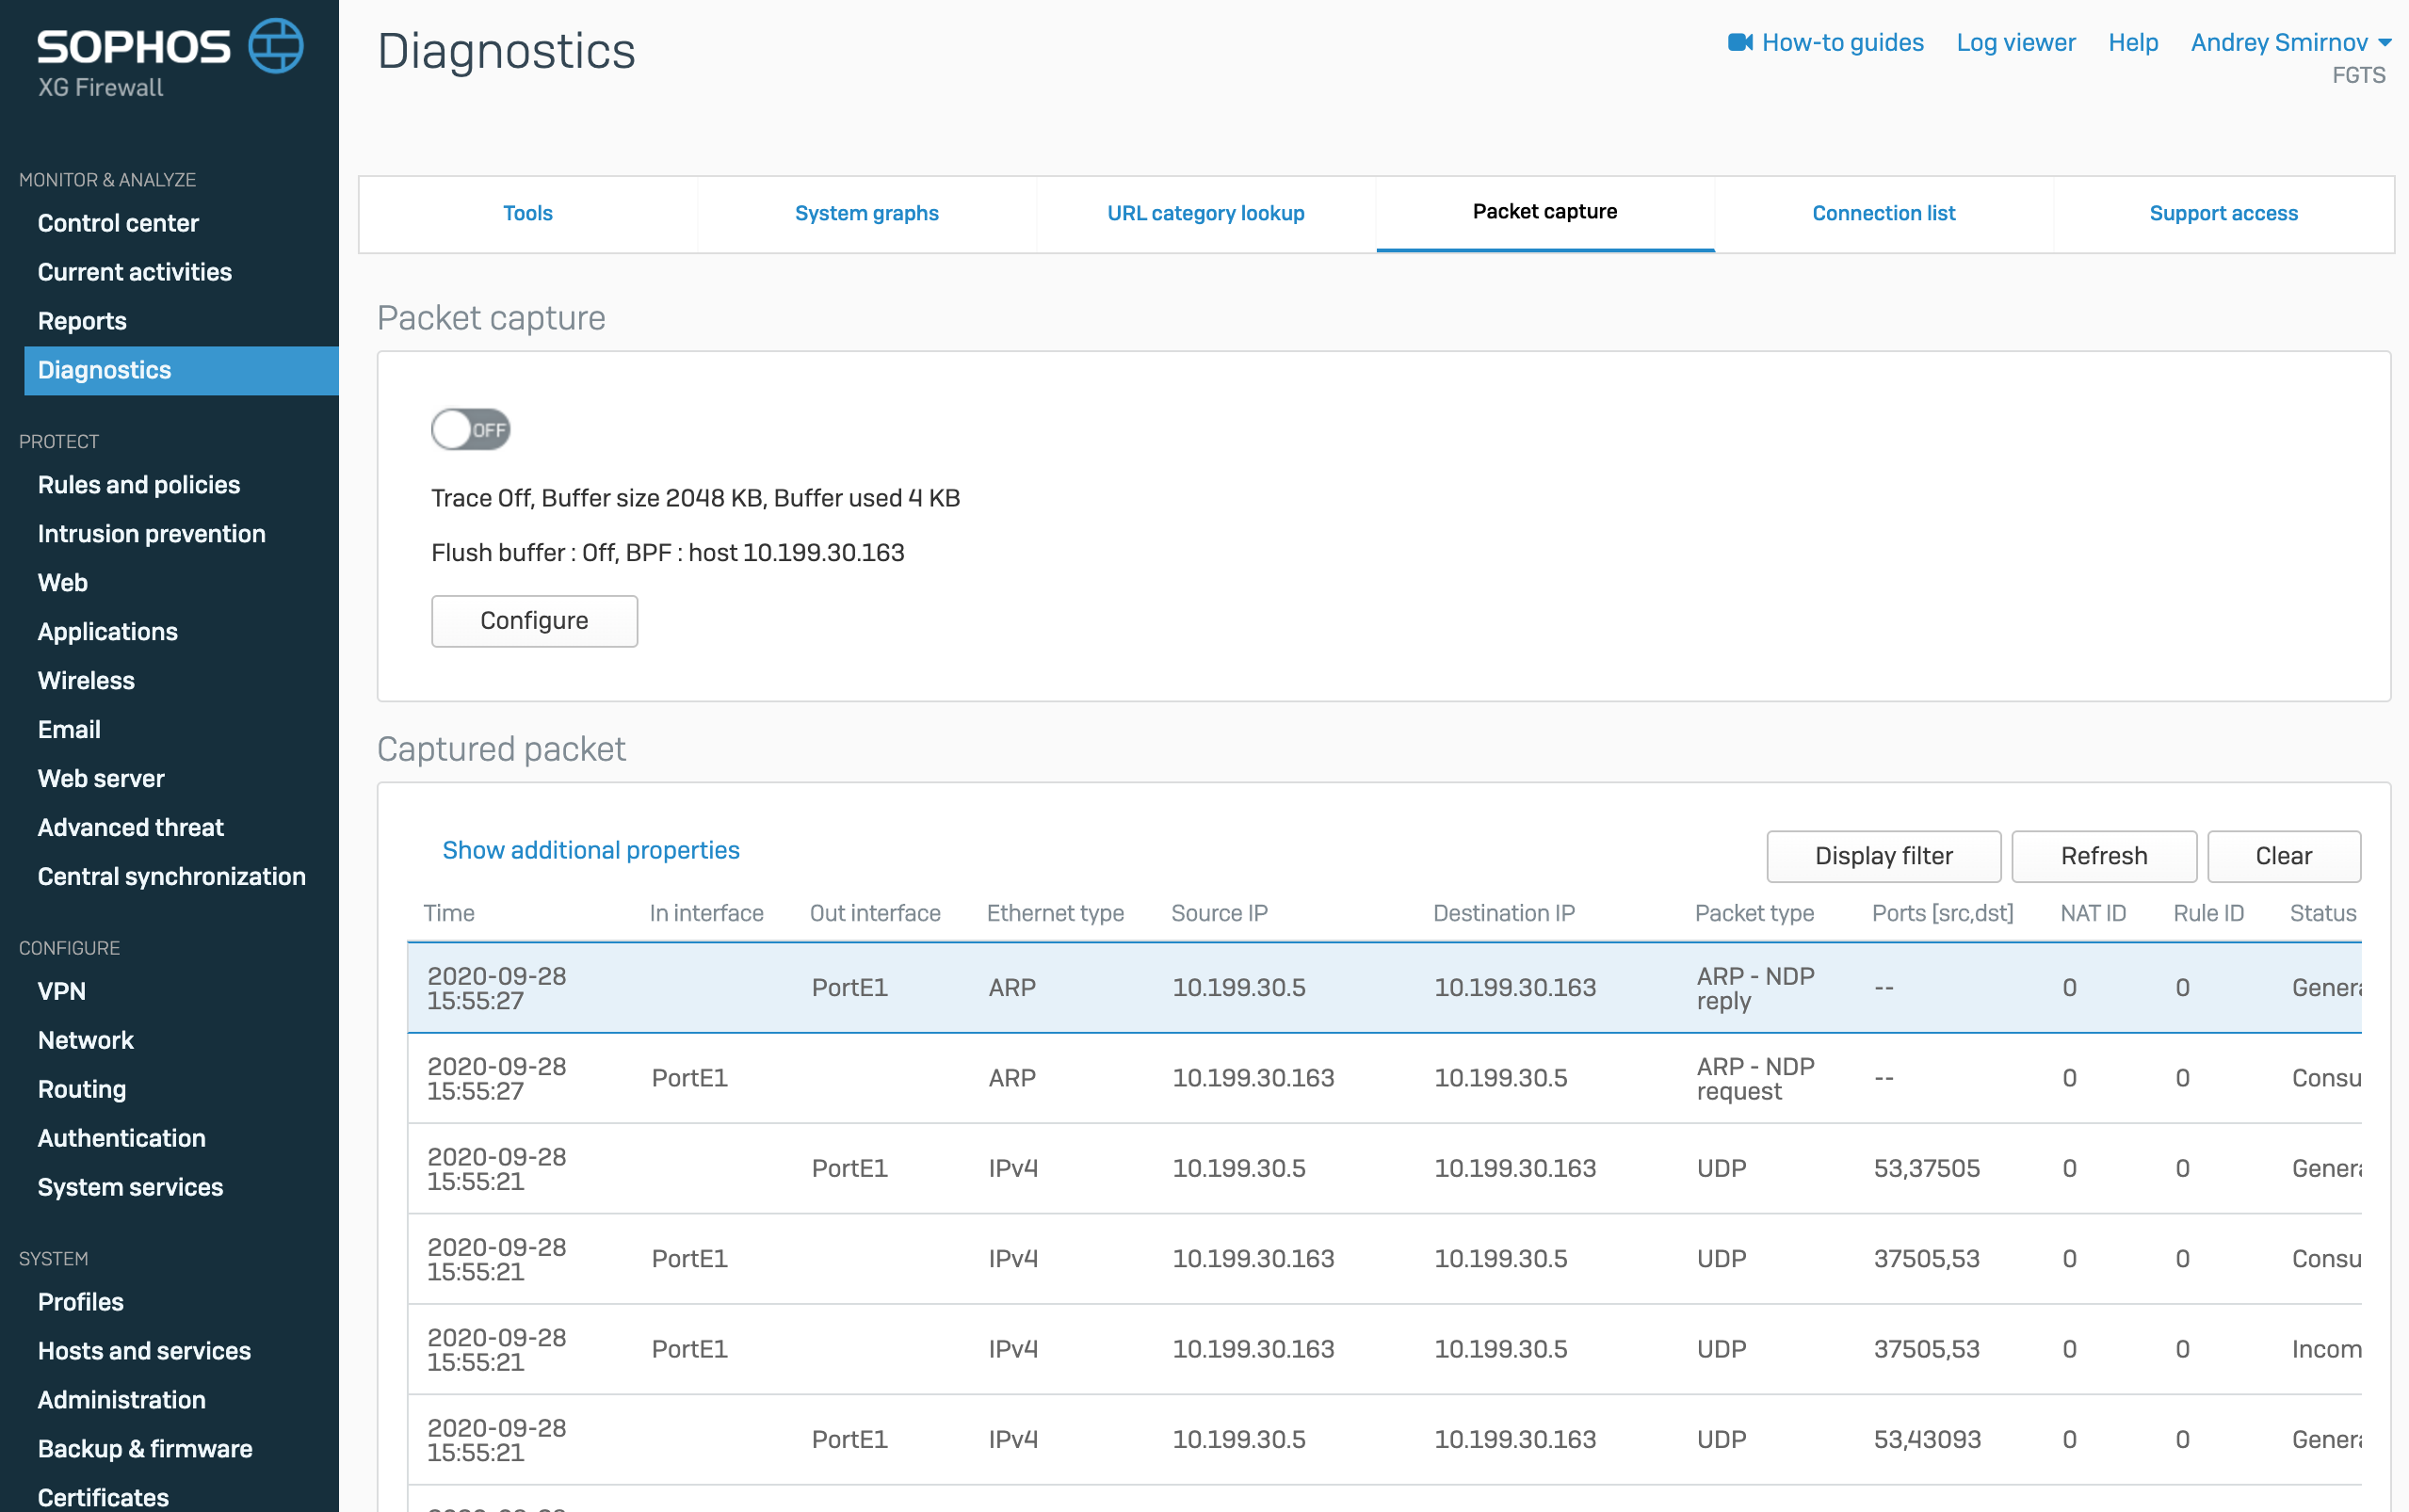
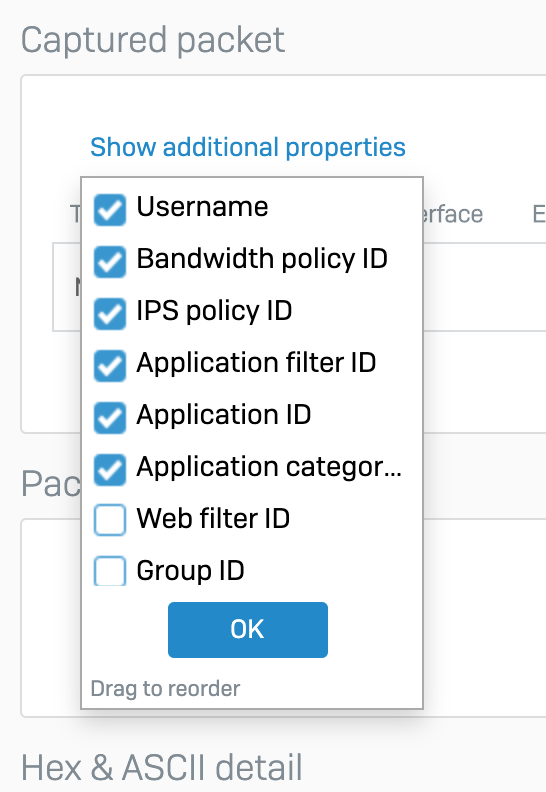
Interestingly, it is worth noting that the packages are converted into a table where you can disable and enable additional columns with information. This functionality is very convenient for finding network problems, for example, you can quickly understand which filtering rules were applied to real traffic.
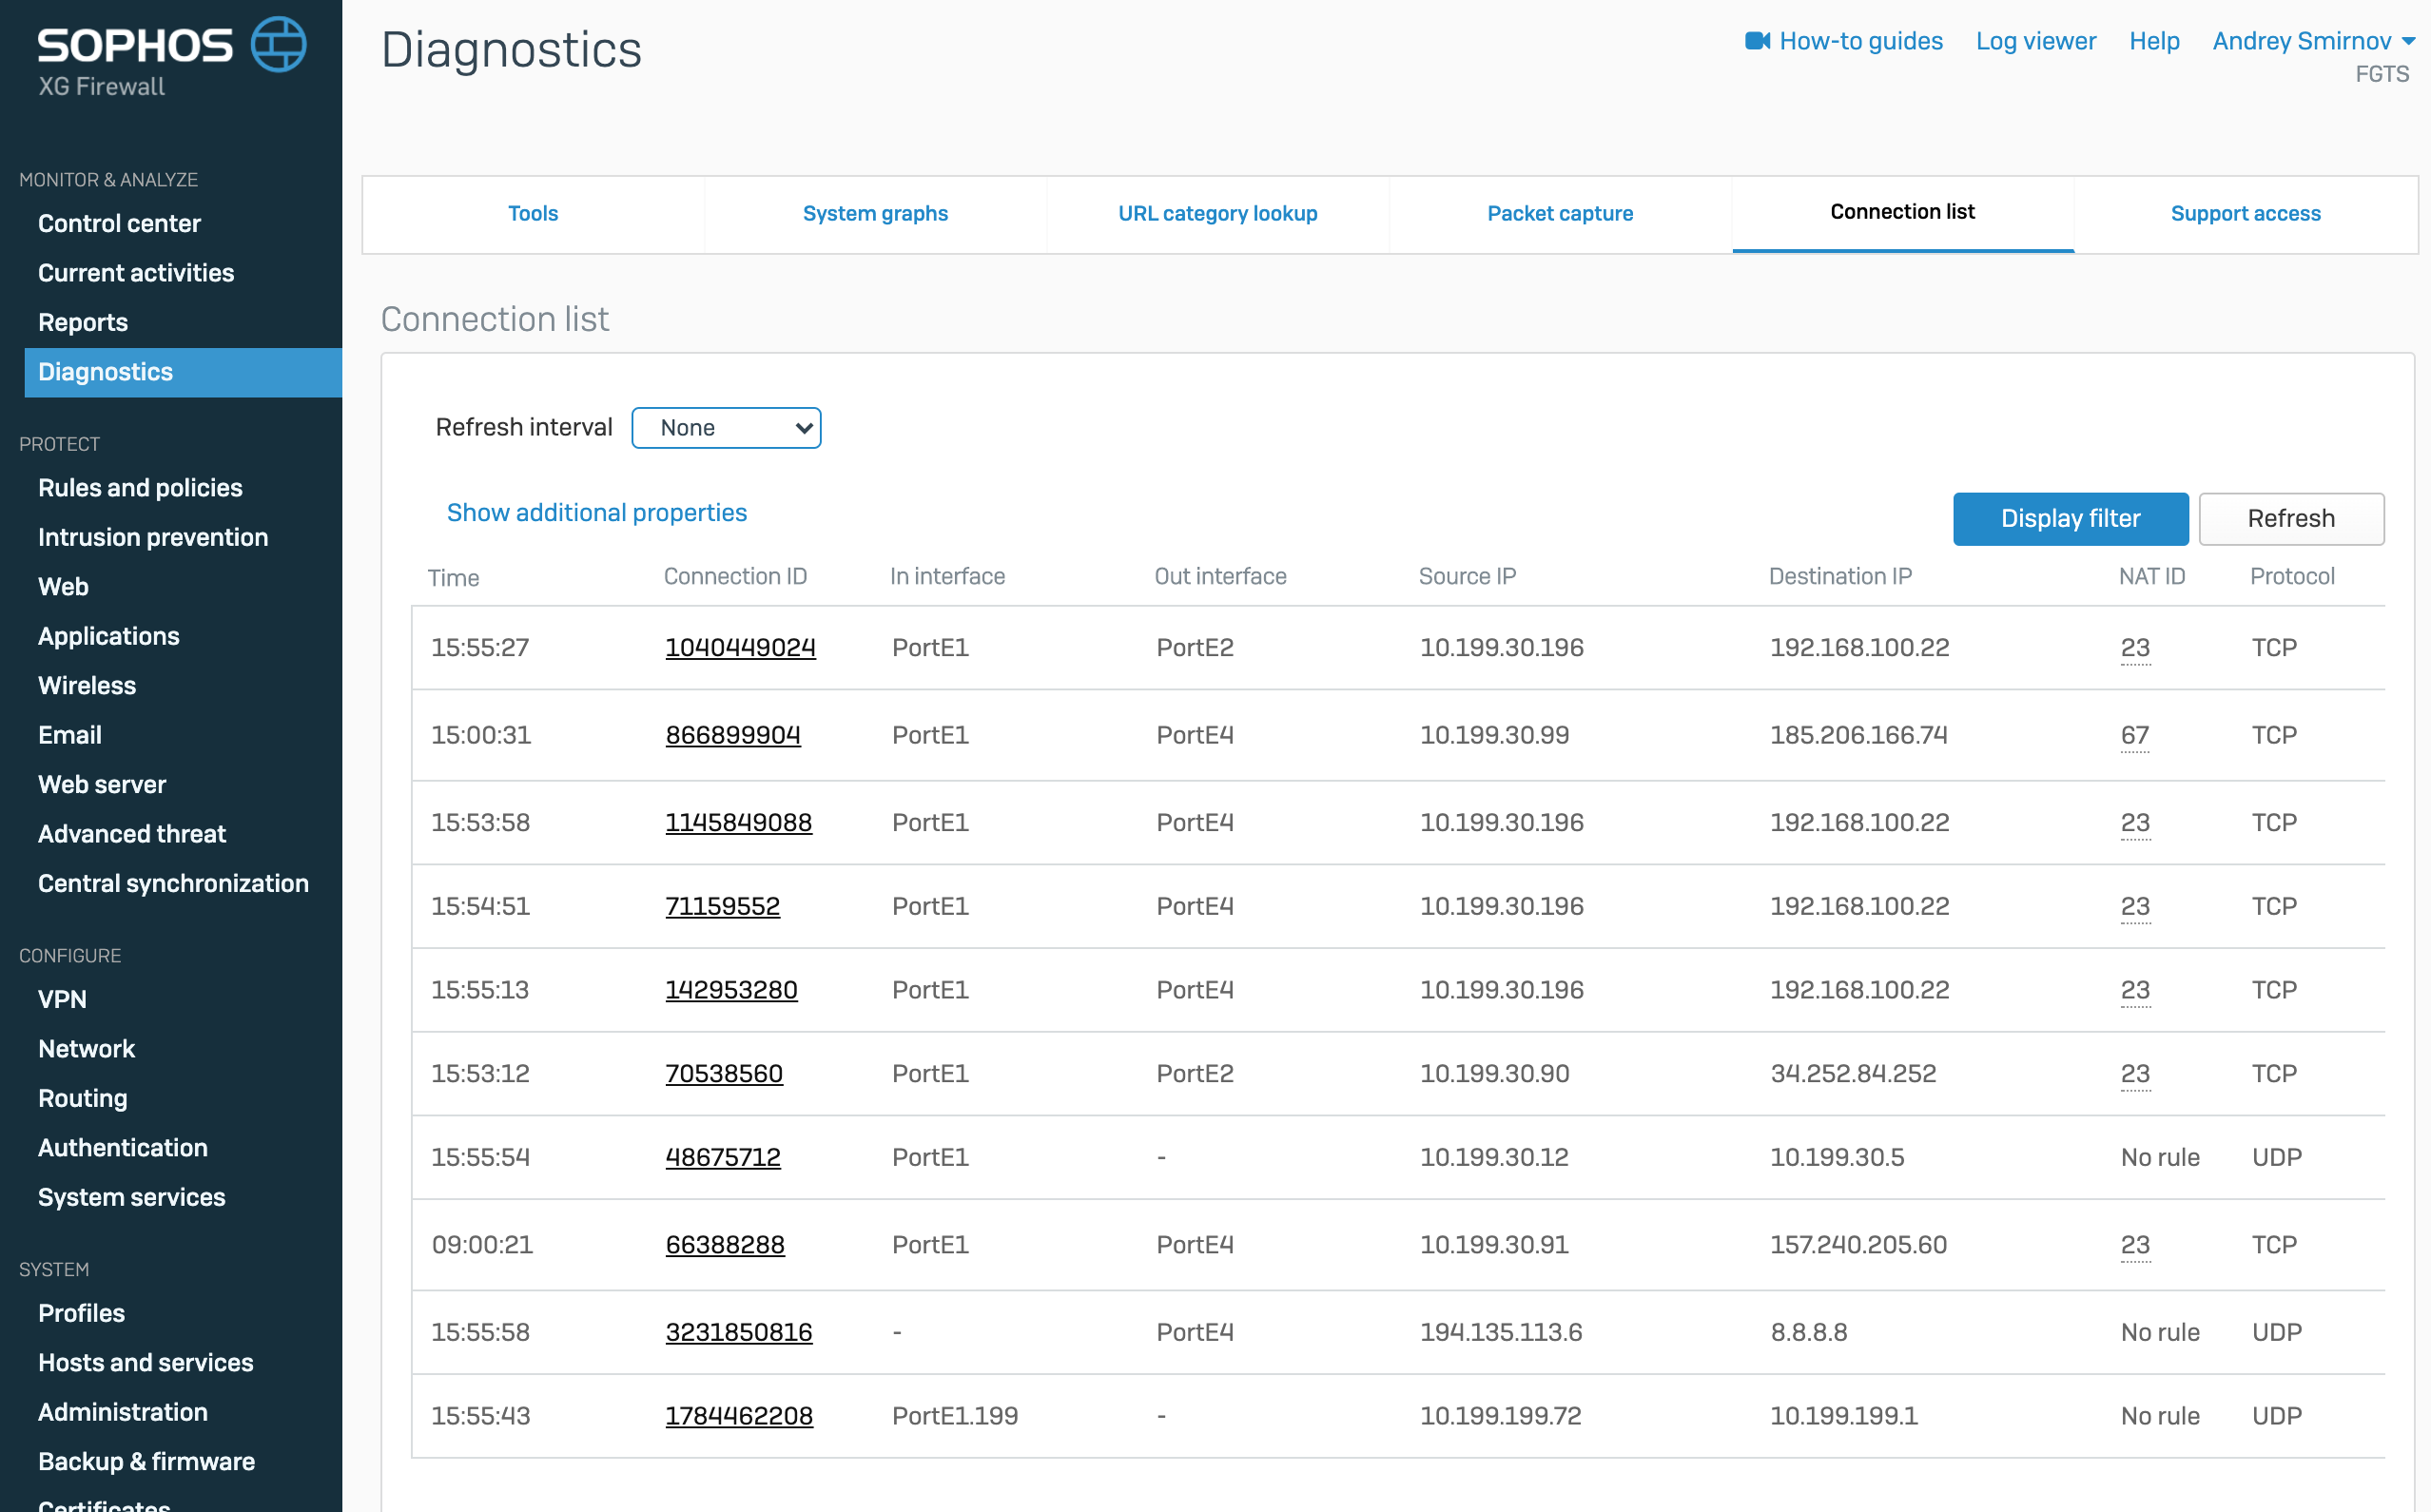
On the Connection List tab, you can view all existing connections in real time and information on them
Connection List
Conclusion
This concludes the first part of the review. We have considered only the smallest part of the available functionality and did not touch on protection modules at all. In the next article, we will analyze the built-in reporting functionality and firewall rules, their types and purposes.
Thank you for your time.
If you have any questions about the commercial version of XG Firewall, you can contact us - Factor Group , a distributor of Sophos. It is enough to write in free form to sophos@fgts.ru .