11 tips for those using Chrome as a development environment.

So, for one reason or another, you decided to focus on Chrome when developing. You open the developer tools and start debugging your code.
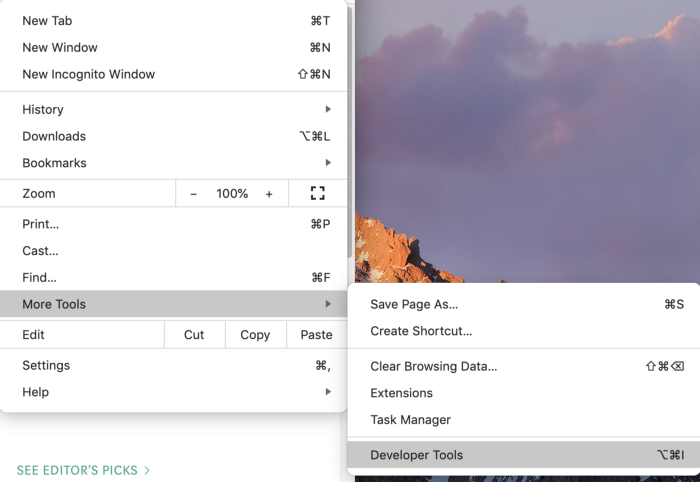
Sometimes you open the console to see your program output, or the Elements tab to check the CSS styles of DOM elements.
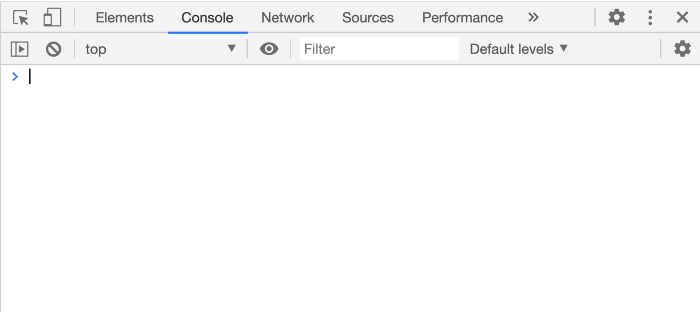
Are you really good at Chrome DevTools? In fact, developer tools have many powerful features that make life easier, but few people know about them.
I will tell you about the most useful ones.
Let's start by looking at the command menu. The command menu in Chrome is like the command shell in Linux. In it, you can write commands to control Chrome.
Open up Chrome Developer Tools. To access the command menu, use the hotkeys:
- Windows : Ctrl + Shift + P
- macOS : Cmd + Shift + P
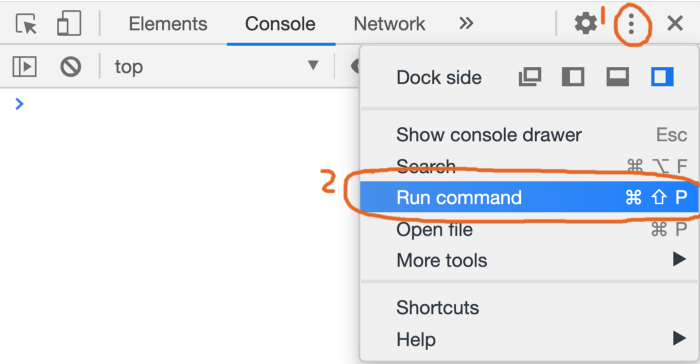
You can also open it through a graphical interface, like this:
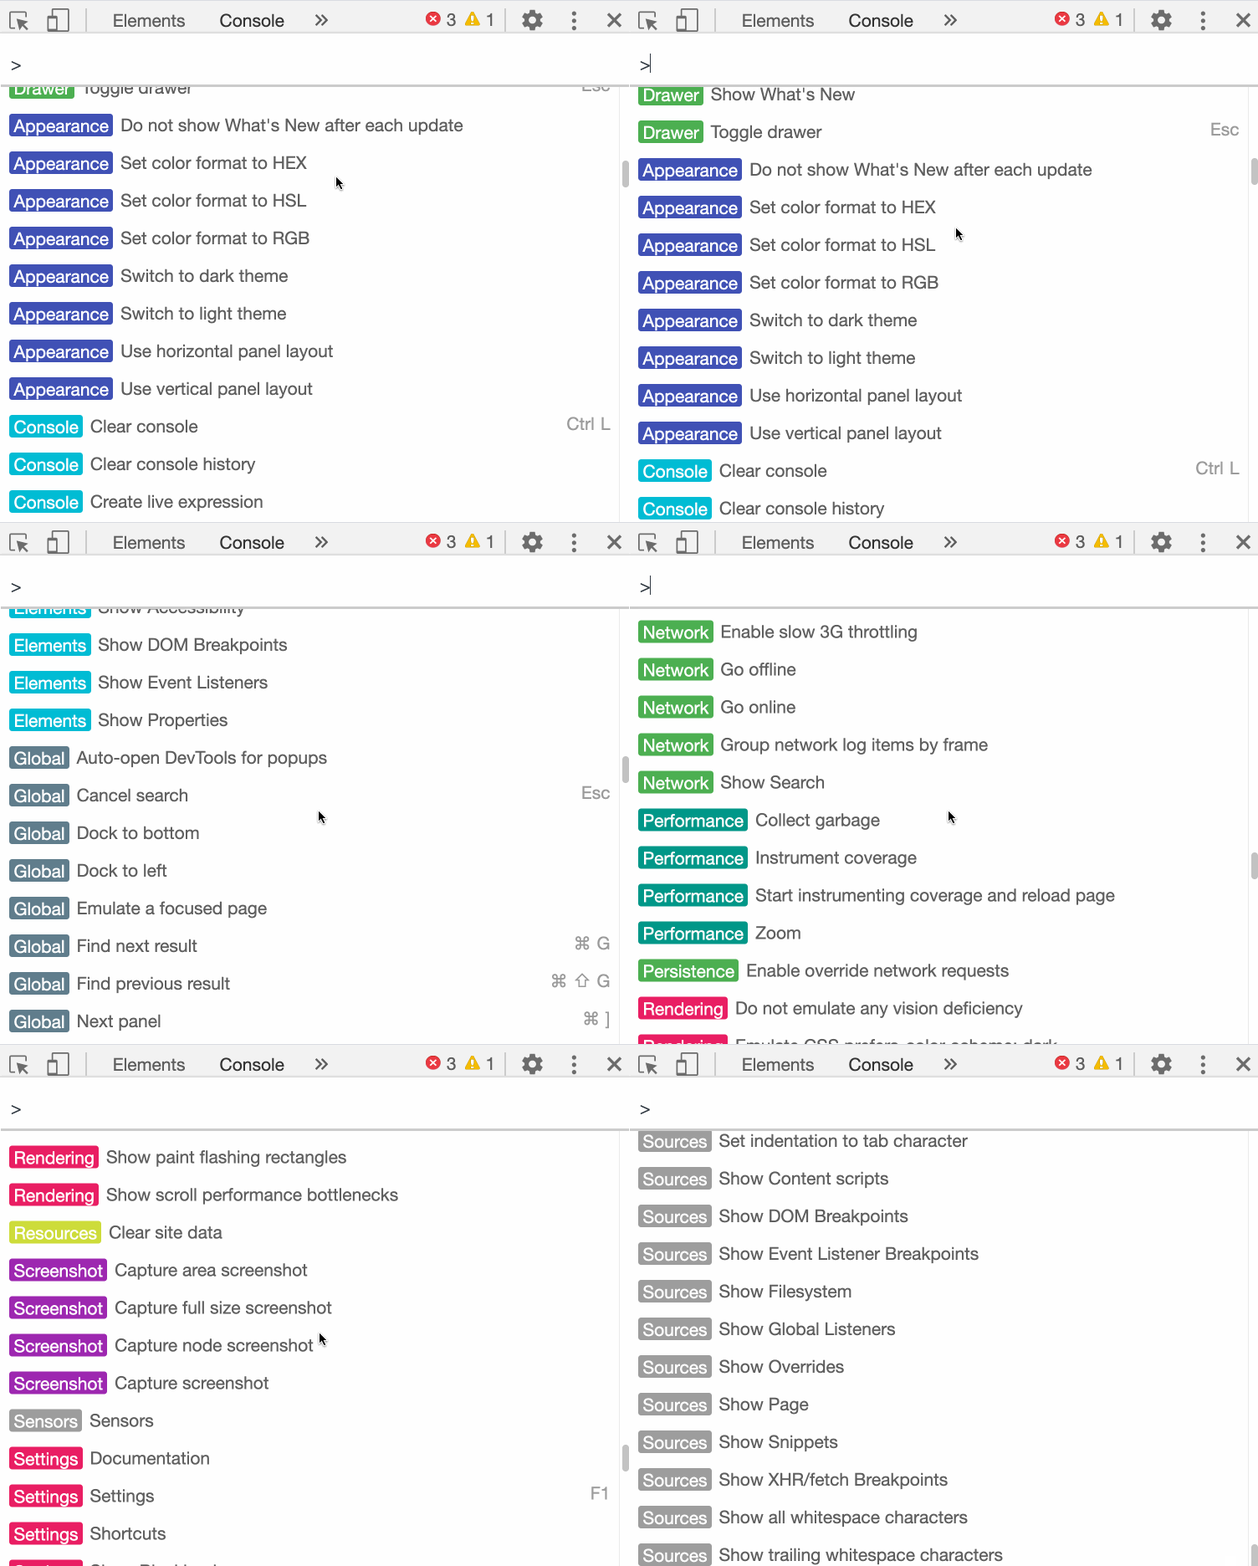
In this area you can see a long list of commands that give access to many useful functions.
Advanced screenshot features
You have to take screenshots of a part of the screen quite often, and I have no doubt that convenient programs are installed on your computer for this. Can they:
- take a screenshot of the entire page, including content outside the viewport?
- grab the content of a single DOM element?
This is often necessary, but most of the system tools for creating screenshots do not cope with these tasks. Luckily, we have dedicated Chrome commands to take screenshots like this one.
Here they are:
- Screenshot Capture full size screenshot
- Screenshot Capture node screenshot
Example
Open any web page, such as the most popular JavaScript articles on Medium: medium.com/tag/javascript .
Open the command menu and run the command
Screenshot Capture full size screenshot.
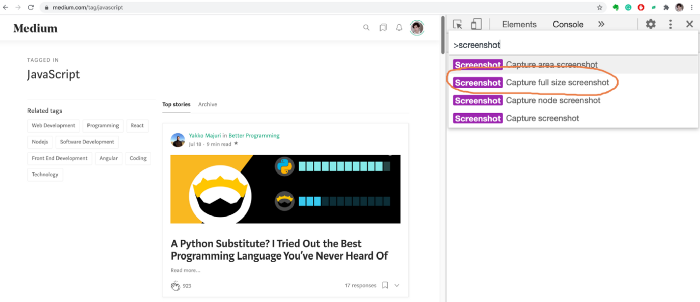
We took a snapshot of the entire current page as a whole.

The original screenshot has good quality, but here I have uploaded a compressed image to save your bandwidth.
If you want to take a screenshot of a DOM element, you can use the system tools, but they won't be able to capture the element perfectly accurately. Chrome has a dedicated command for this
Capture node screenshot.
First open the Elements tab and select the desired element. Then run the command.
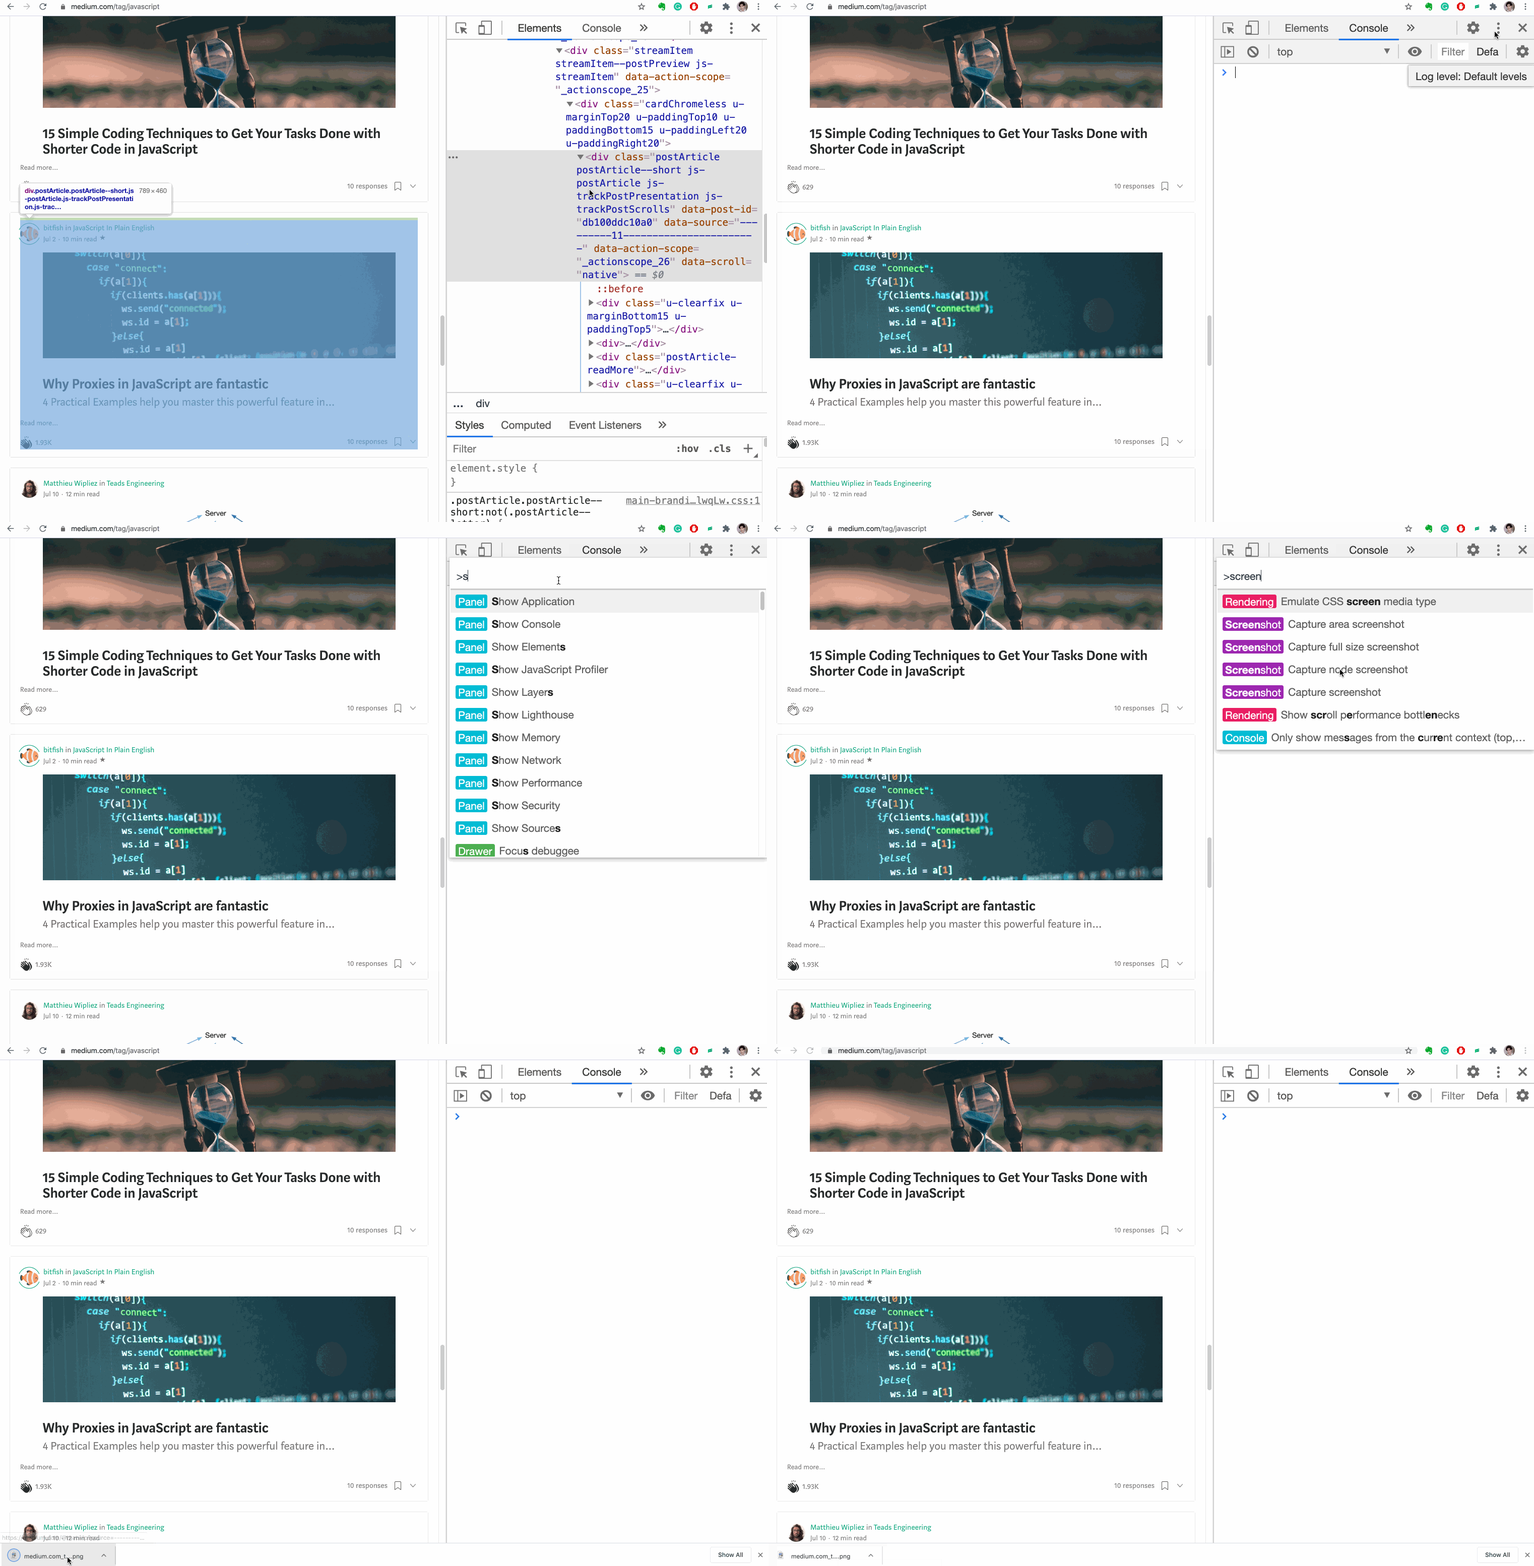
Here's the result:

Using the result of the last operation in the console
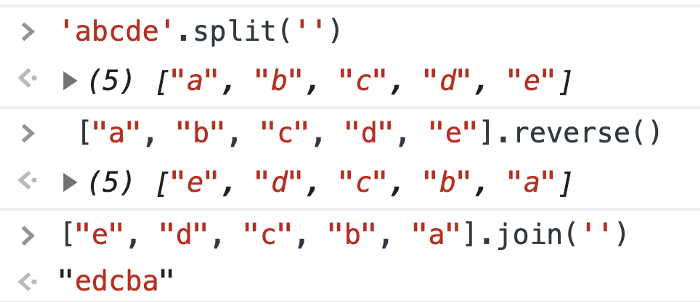
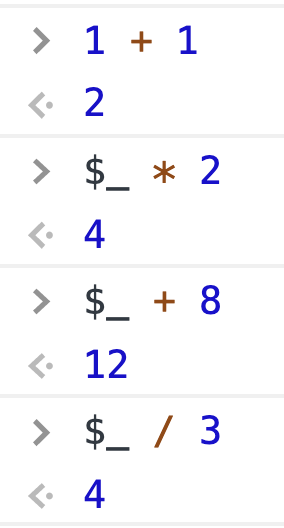
We often debug code in the console. Let's say you want to know how to reverse a string in JavaScript. You are looking for the information you need on the Internet, and you come across this piece of code. Yes, this code reverses the line. But you is not yet clear how the method works , , and what result gives each of them. You can step through this code step by step by writing it something like this: Now we know what value each method returns. But why write so much? It is easy to make a mistake in such a long entry and it is difficult to understand. Let me tell you a secret: there is a magic variable in the console that stores the result of the last operation.
'abcde'.split('').reverse().join('')

split()reverse()join()
$_
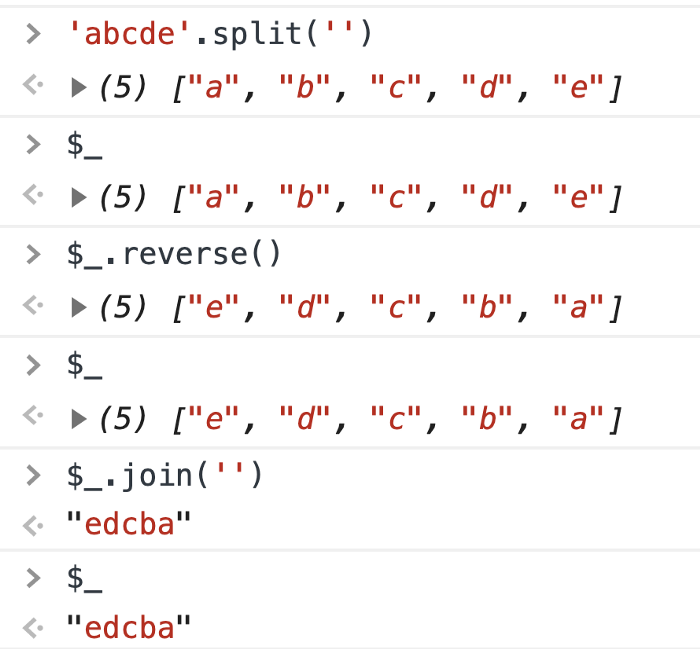
$_Is a special variable whose value is always equal to the result of the last operation performed in the console. This trick makes the debugging process a lot easier.
Resend XHR Request
In front-end projects, you often need to use XHR to send requests to receive data from the server. What if I need to resend my request?
Inexperienced developers refresh the page, but this is very inconvenient. In Chrome, we can debug the code right from the Network tab.
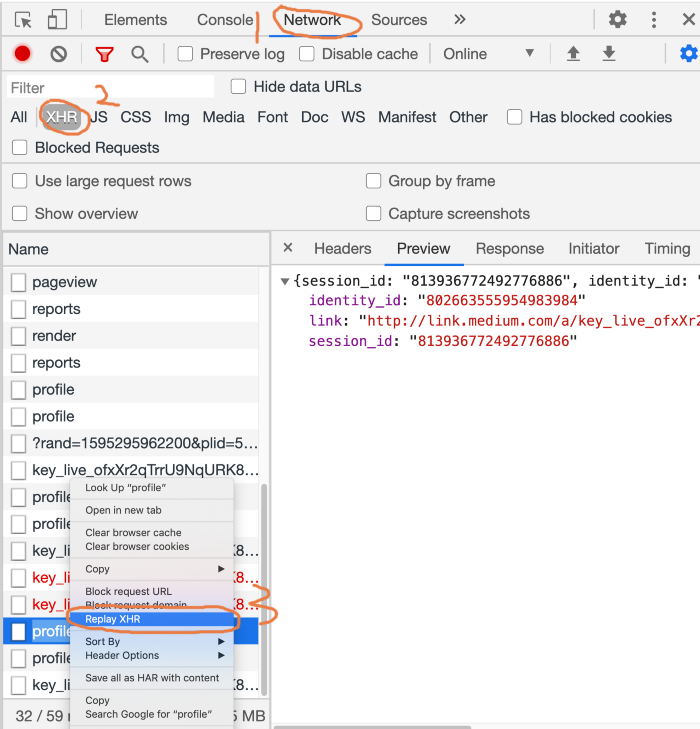
- Open the Network tab.
- Press the XHR button.
- Select the XHR request you want to resend.
- Select Replay XHR from the context menu to replay the request.
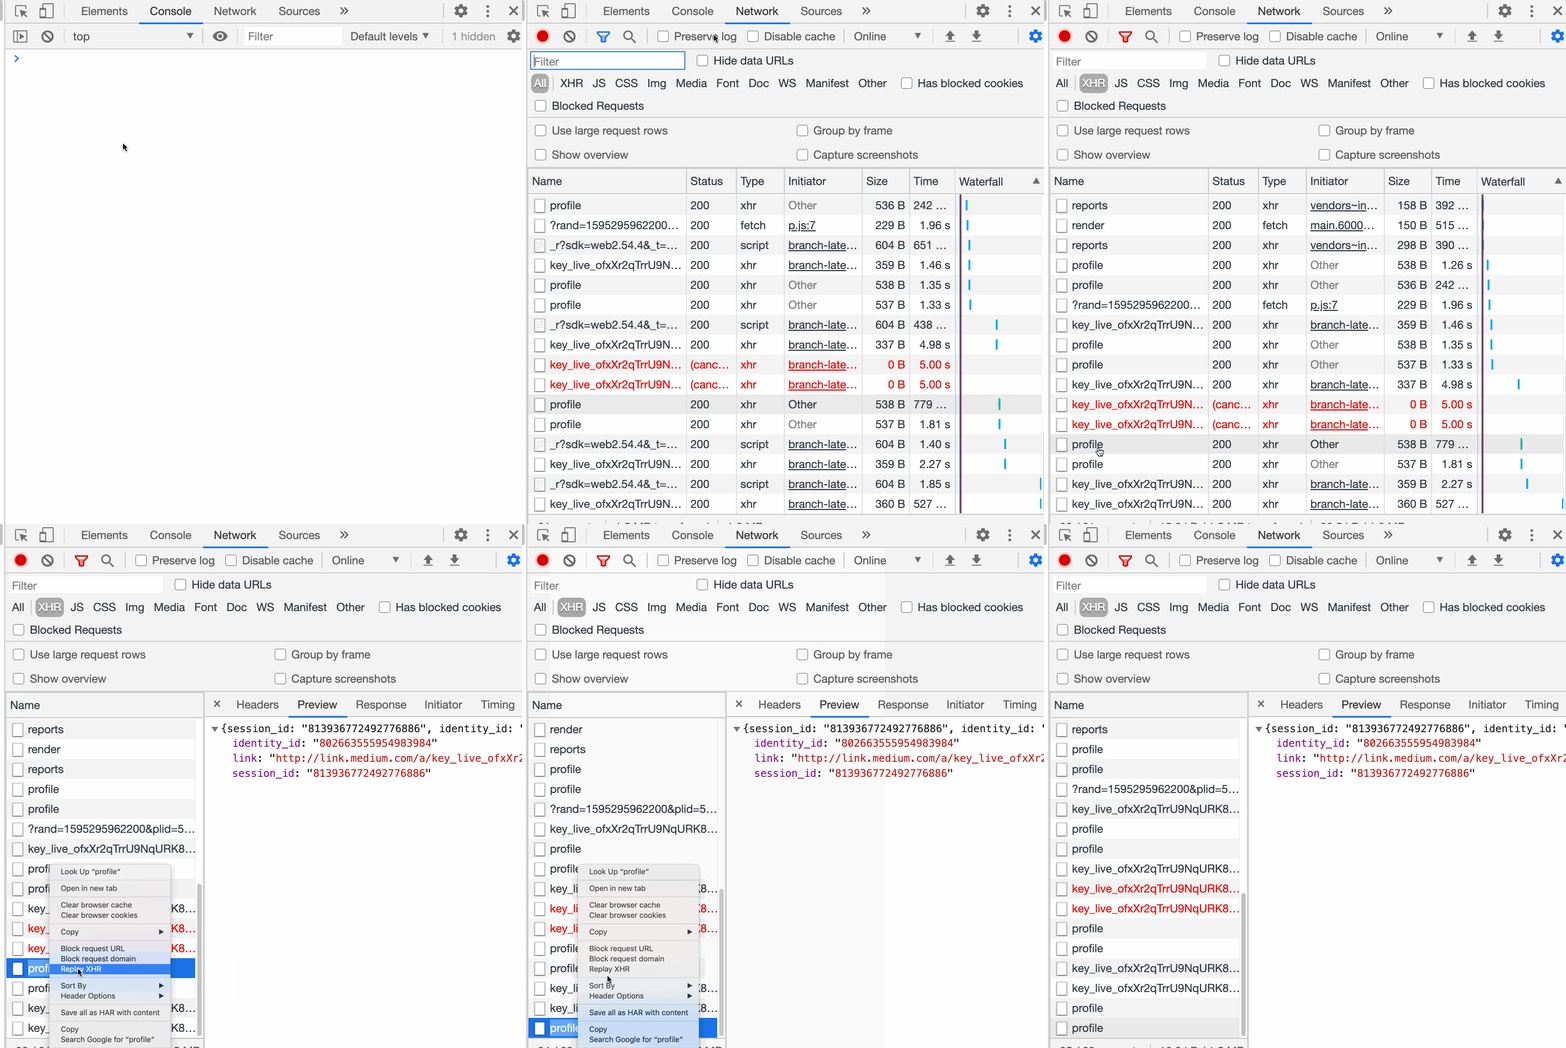
Here's an animated example:
Track page load status
It can take more than ten seconds for the page to fully load. In such cases, you need to control the page loading process at each separate time.
In Chrome DevTools, you can take screenshots of a page while it is loading by checking the box next
Capture Screenshotsto the Network tab.
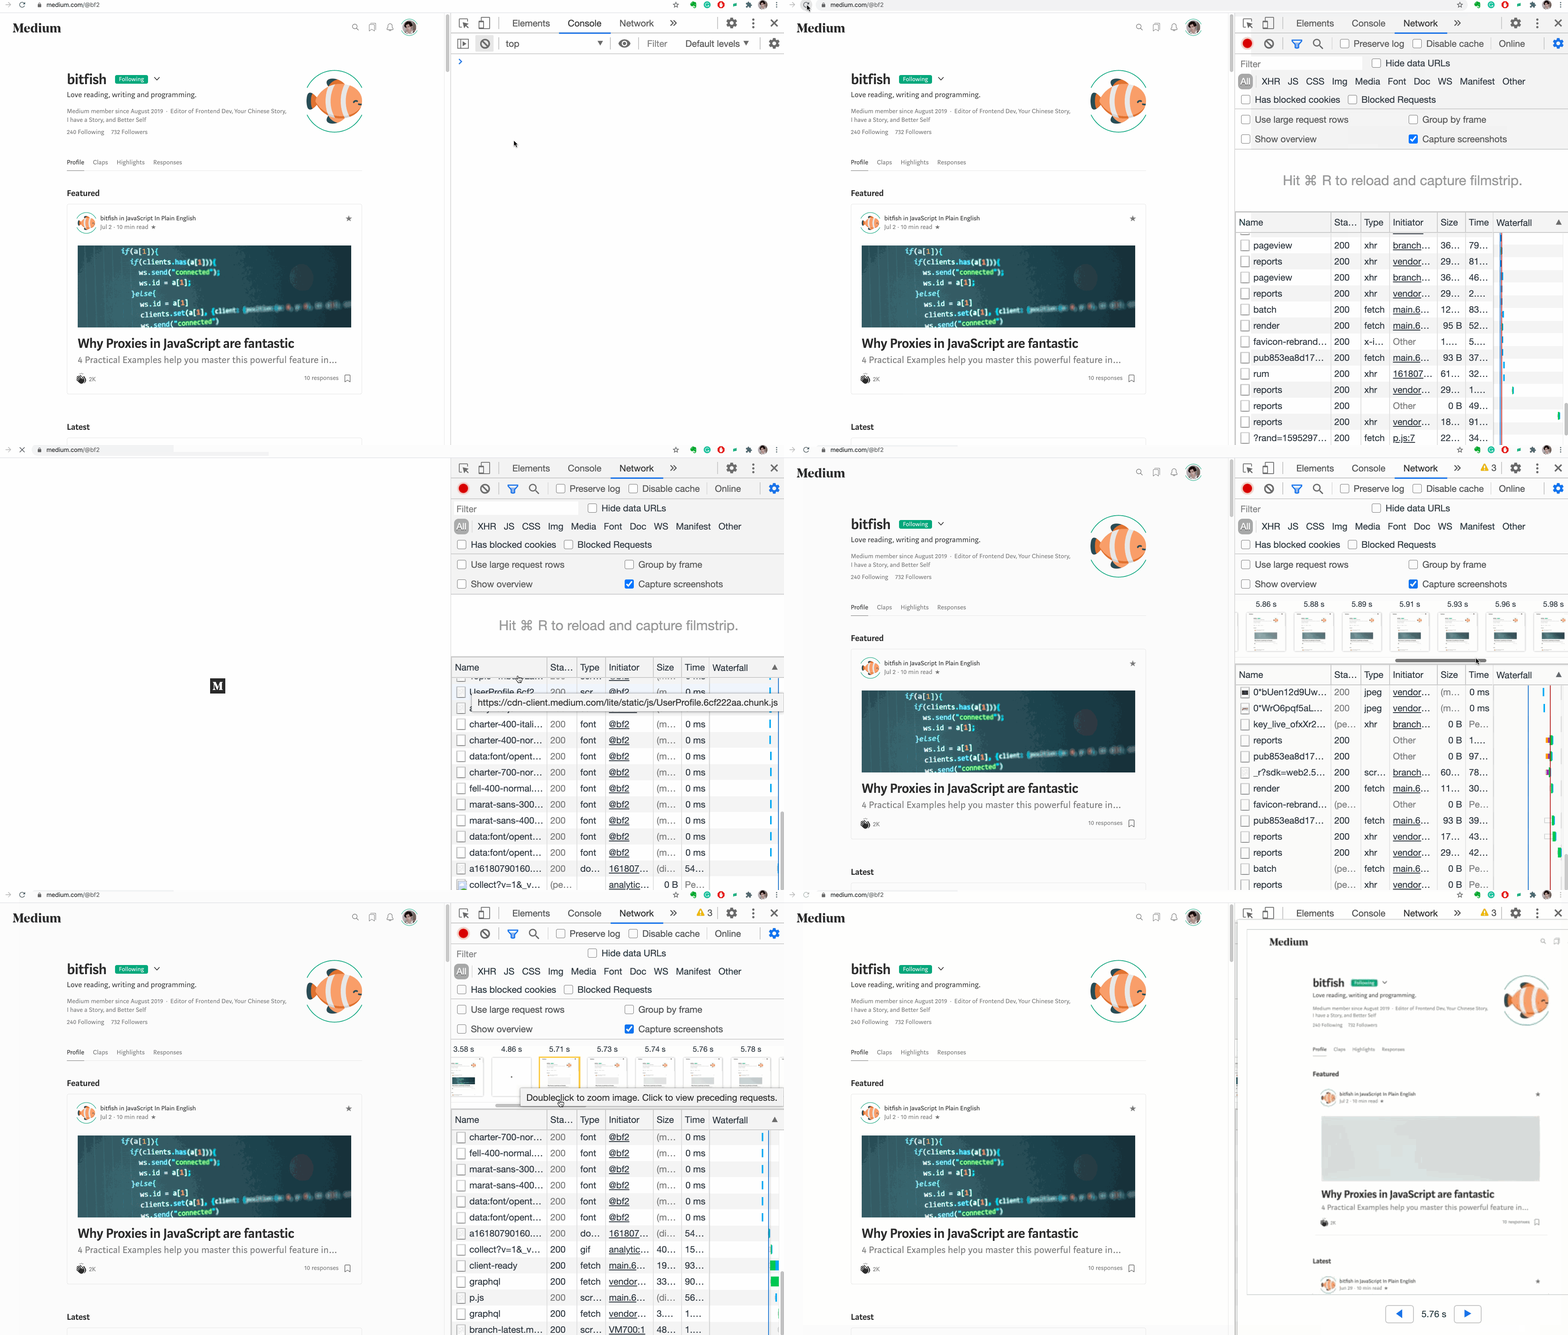
Select the screenshot to view information about the corresponding network requests. This visualization will give you a better understanding of the network requests that are sent to the server at specific points in time.

Copying Variables
Do you know how to copy the value of a JavaScript variable to the clipboard?
It seems like an impossible task, but Chrome provides a special function to solve it
copy.
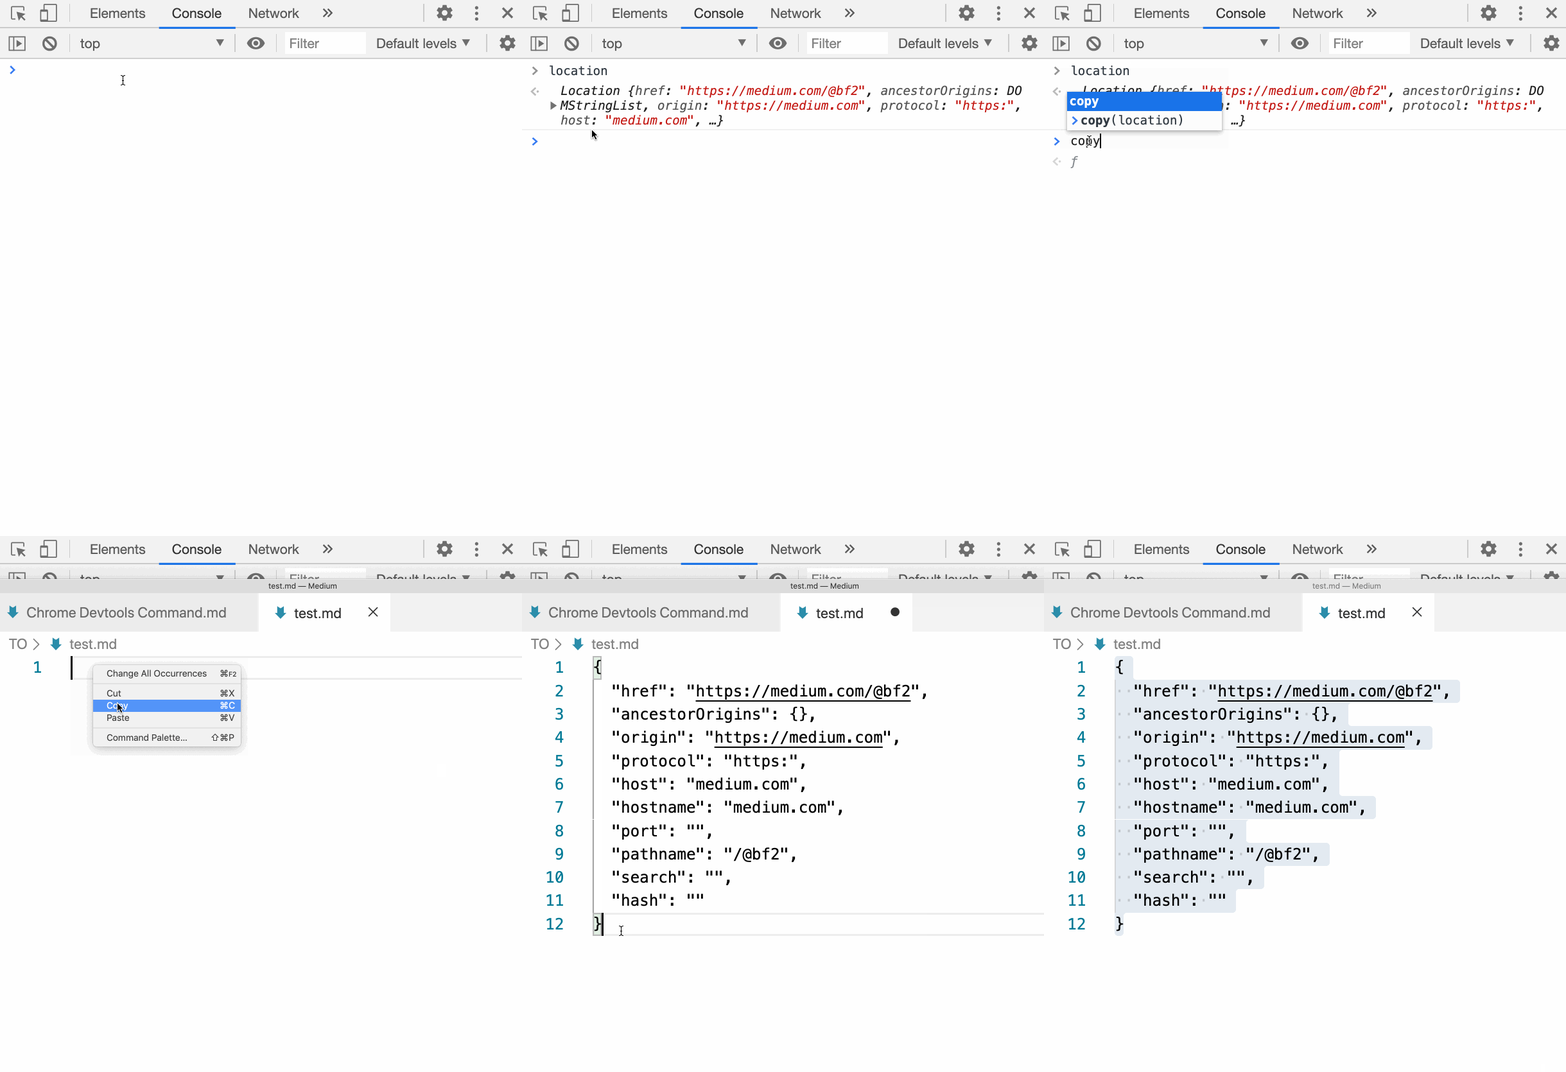
ECMAScript does not contain a definition for the copy function, it is a Chrome function. It can be used to copy the value of a JavaScript variable to the clipboard.
Copying an image as a URI with the "data:" prefix
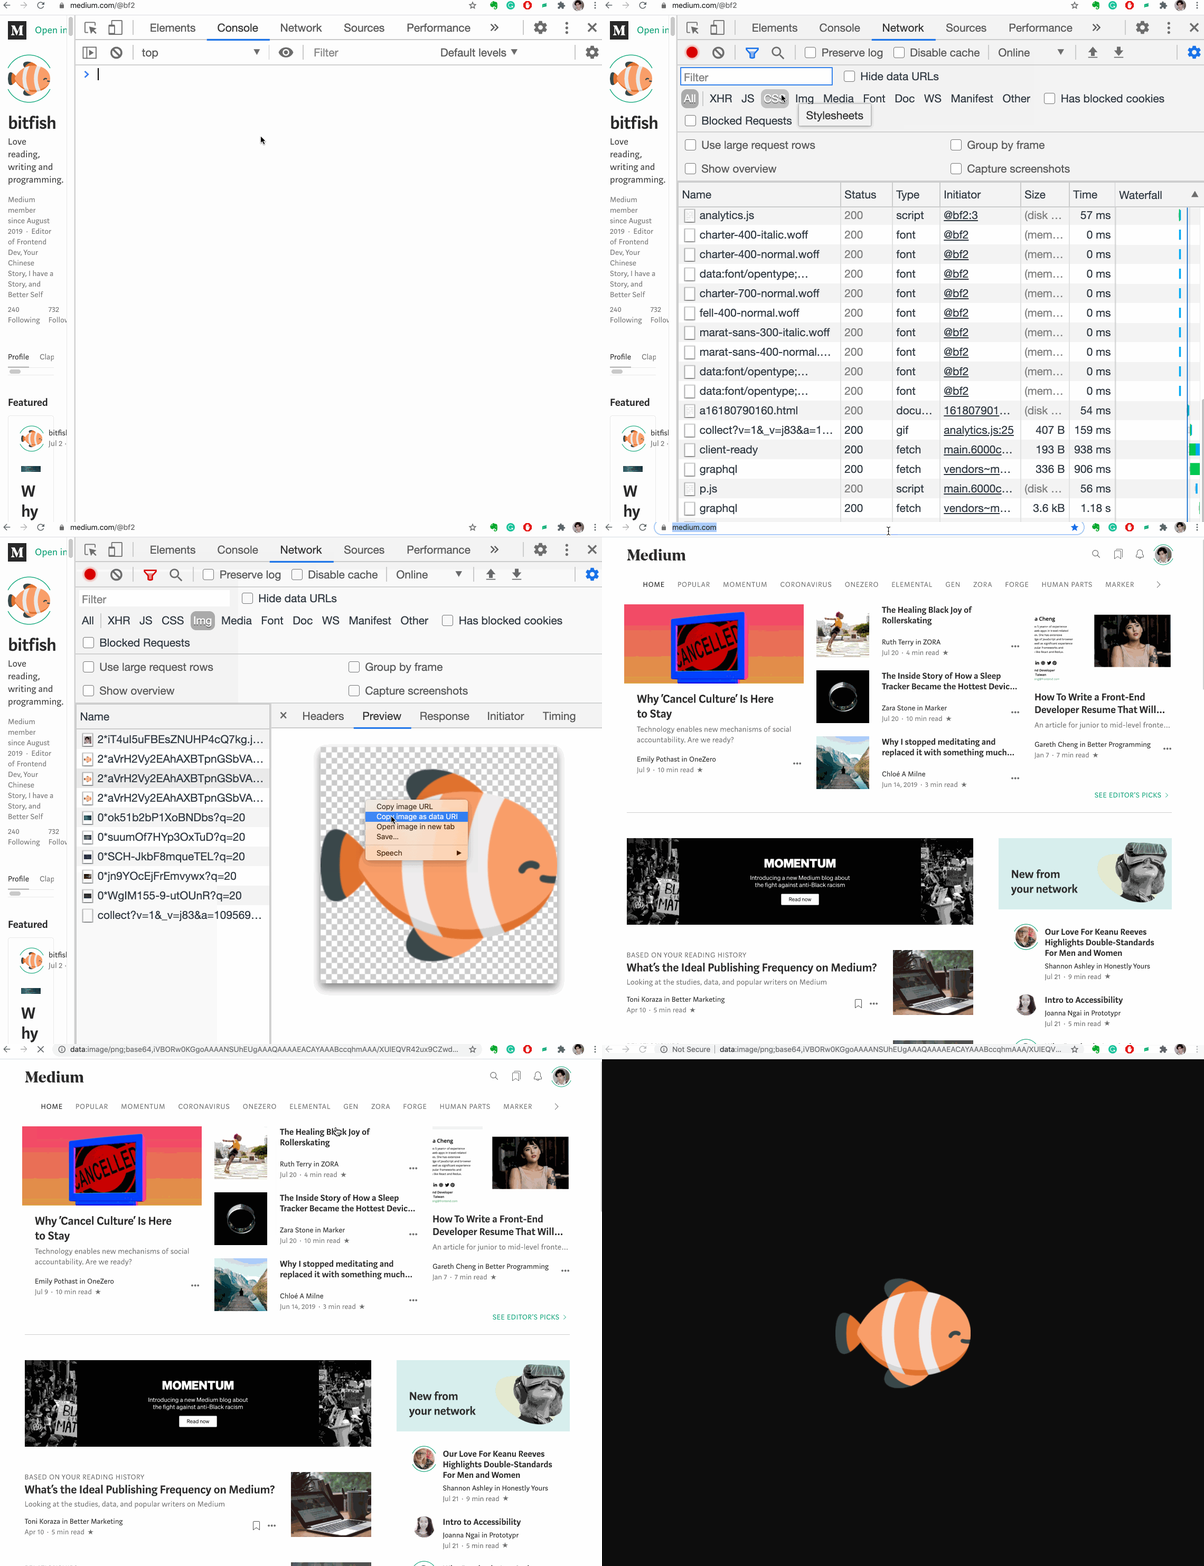
There are two ways to insert an image into a page: you can link to an external file, or you can embed an image using the data: URL .
Data: URL (Prefixed URL
data:) is a scheme for embedding small files in a document as inline elements. It used to be called "data: URI", but the WHATWG has dropped that name.
Embedding small images directly into the data: URL scheme reduces the number of HTTP requests to the server, which makes the page load faster.
How do I do this in Chrome?
Watch the animation:
Outputting an array of objects to a table
Let's say we have an array of objects:
let users = [{name: 'Jon', age: 22},
  {name: 'bitfish', age: 30},
  {name: 'Alice', age: 33}]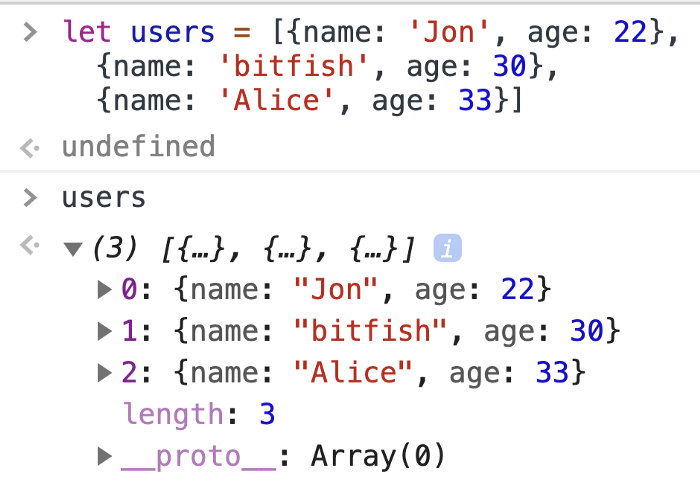
Perceiving such information in the console is difficult. And if the array is longer and contains more complex elements, then it is even easier to get lost in it.
Fortunately, Chrome has a function that outputs an array of objects to a table.

It will be useful to you, and more than once.
Dragging on the Elements tab
Sometimes you need to move some DOM elements on the page in order to test the user interface. On the Elements tab, you can drag any HTML element anywhere in the code:
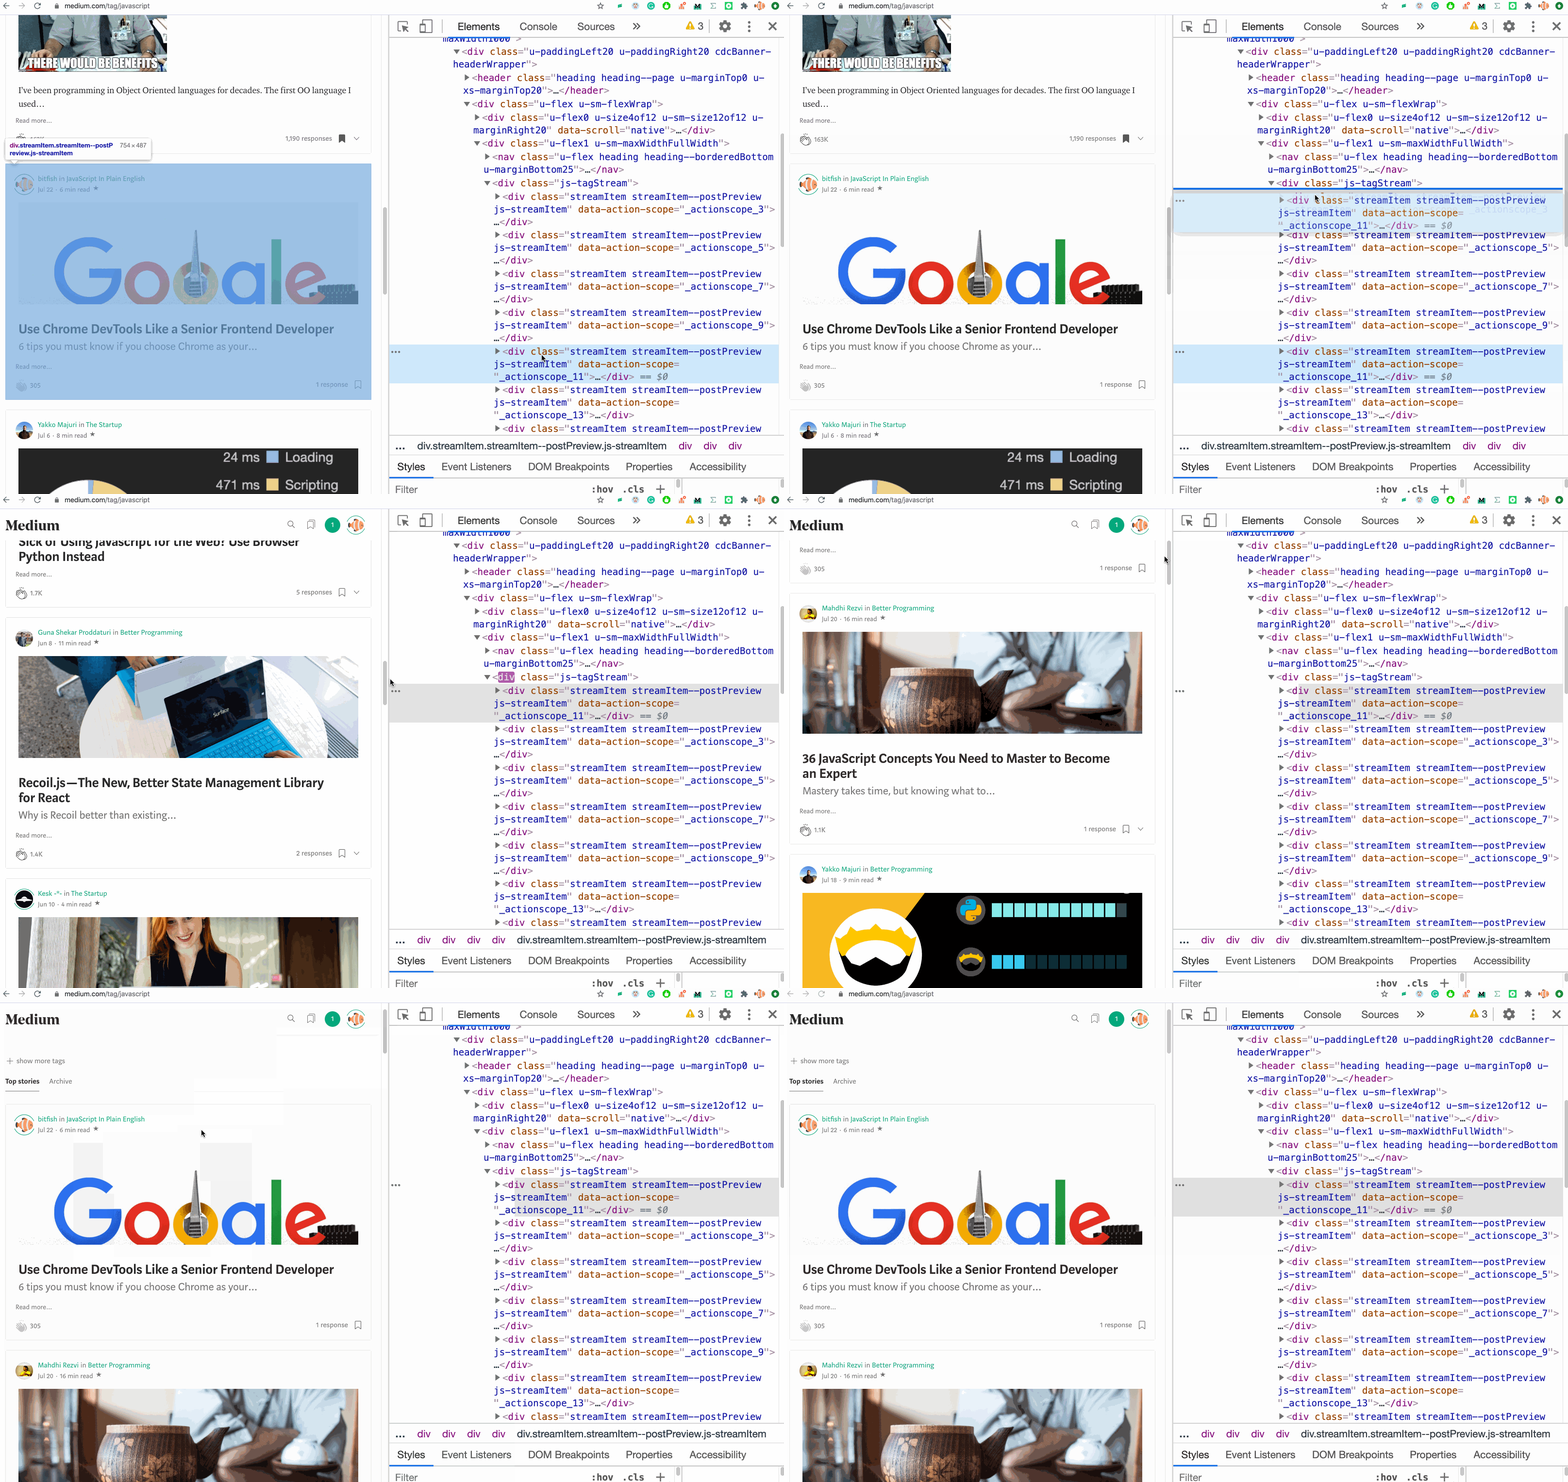
In this example, I dragged an element on the Elements tab, and its position on the web page also instantly changed.
Referencing the currently selected item in the console
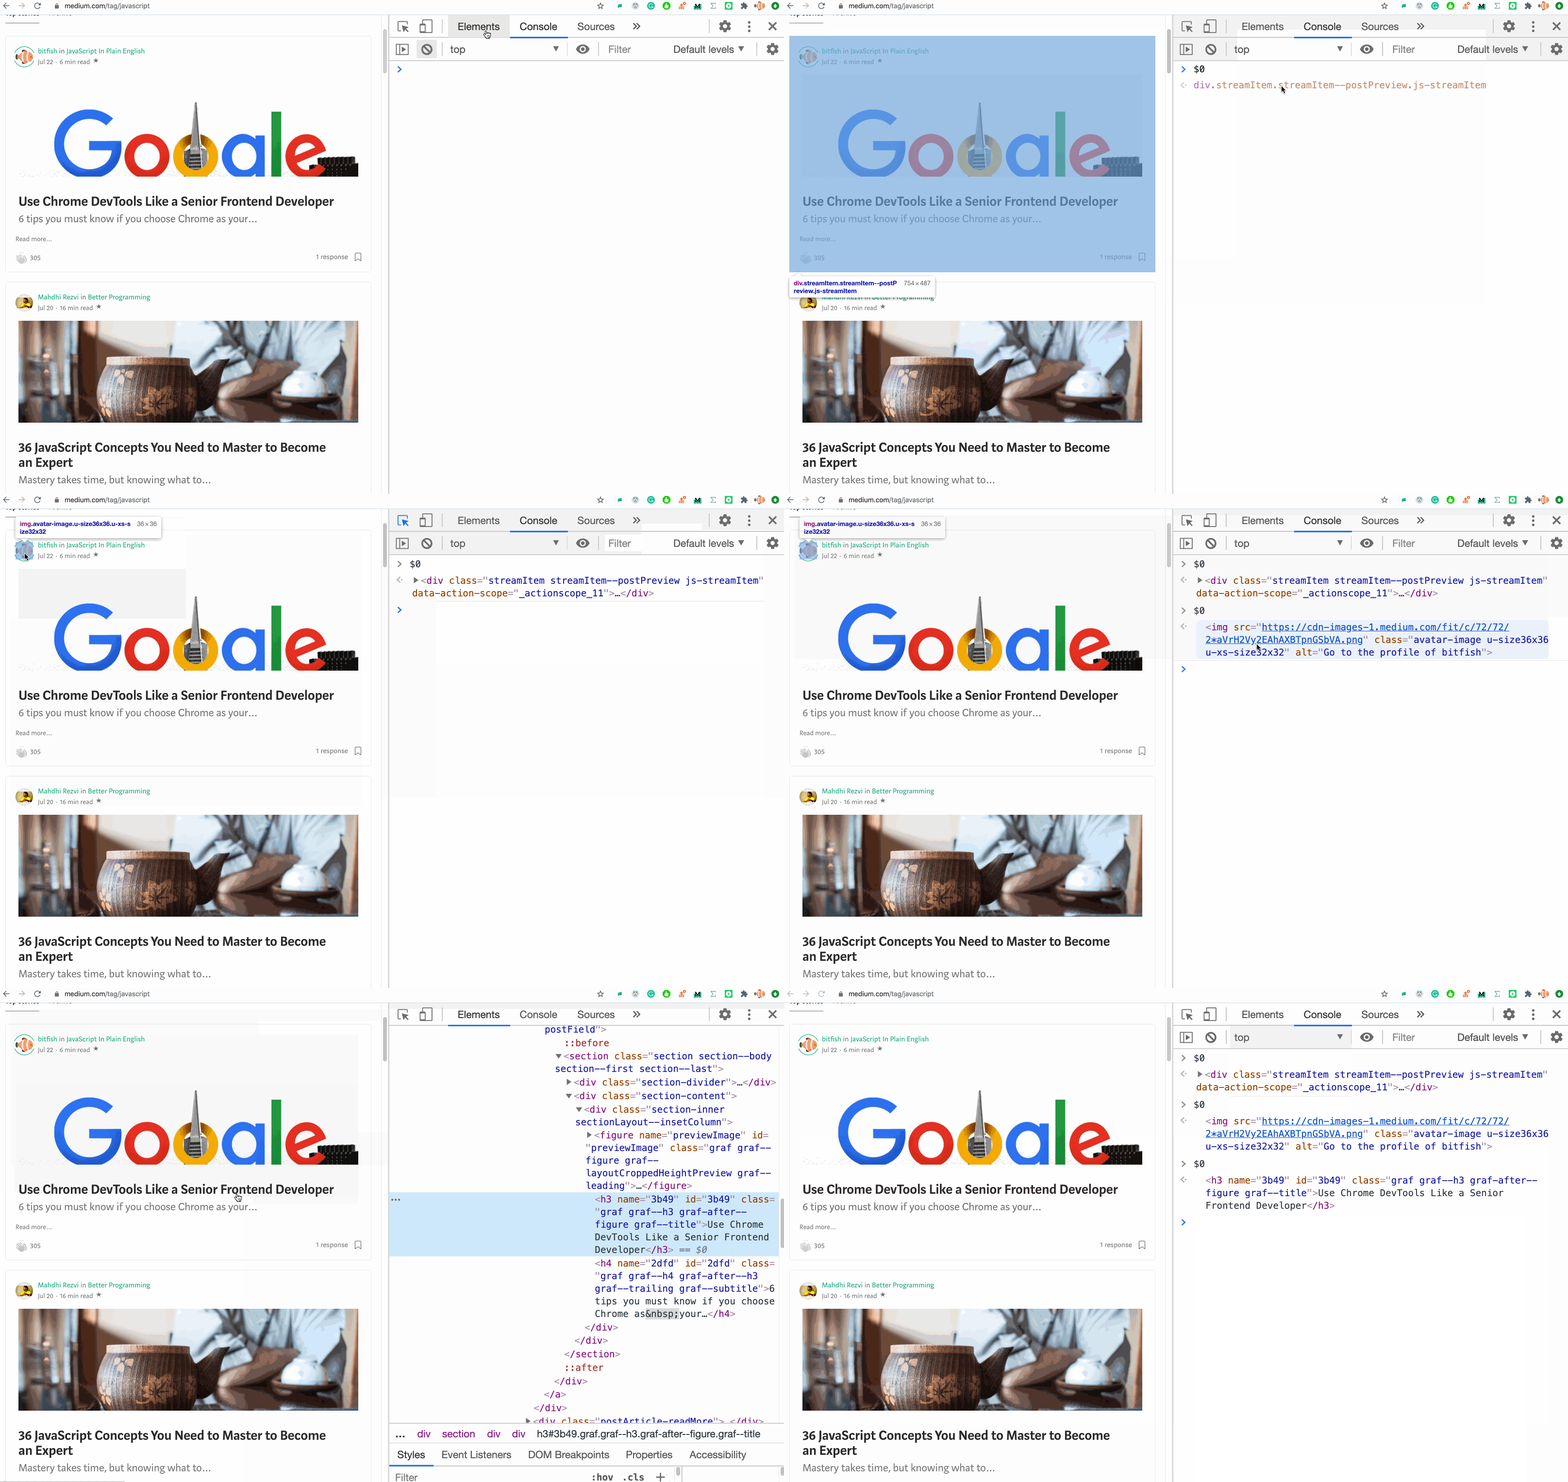
$0 Is another magic variable that contains the element selected in the Elements tab.
Activating CSS pseudo-classes
Pseudo-classes allow you to style an element not only based on its location in the document tree, but also depending on external factors such as browsing history (for example : visited ), content state (for example : checked in some forms), pointer position mouse (for example, the : hover pseudo- class changes the style of the element when you hover over it).
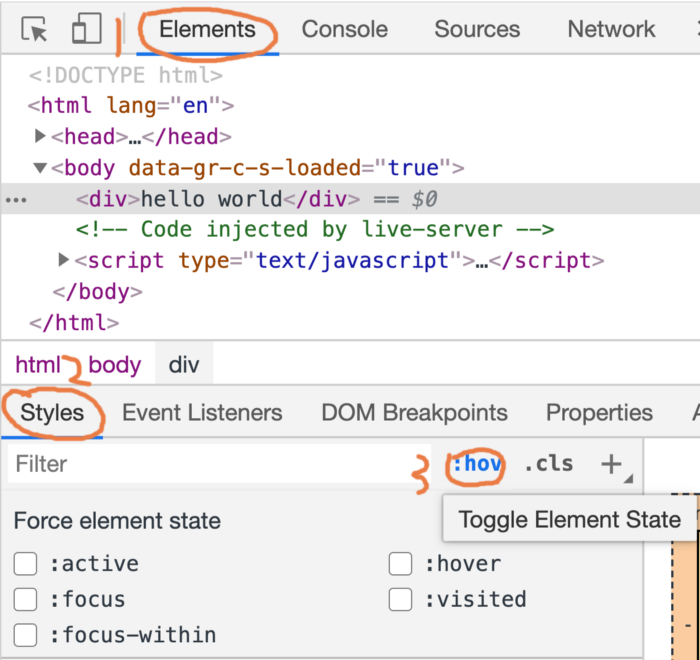
Multiple pseudo-classes can be written for one element. To make it easier to test styles, pseudo-classes can be activated directly from the Elements tab.
Example
Look at the page code:
<!DOCTYPE html>
<html lang="en">
<head>
<meta charset="UTF-8">
<meta name="viewport" content="width=device-width, initial-scale=1.0">
<title>Document</title>
<style>
body{
font-size: 150px;
}


div:hover{
color: red;
}
div:active{
color: blue;
}
div:focus{
color: brown;
}
</style>
</head>
<body>
<div>hello world</div>
</body>
</html>
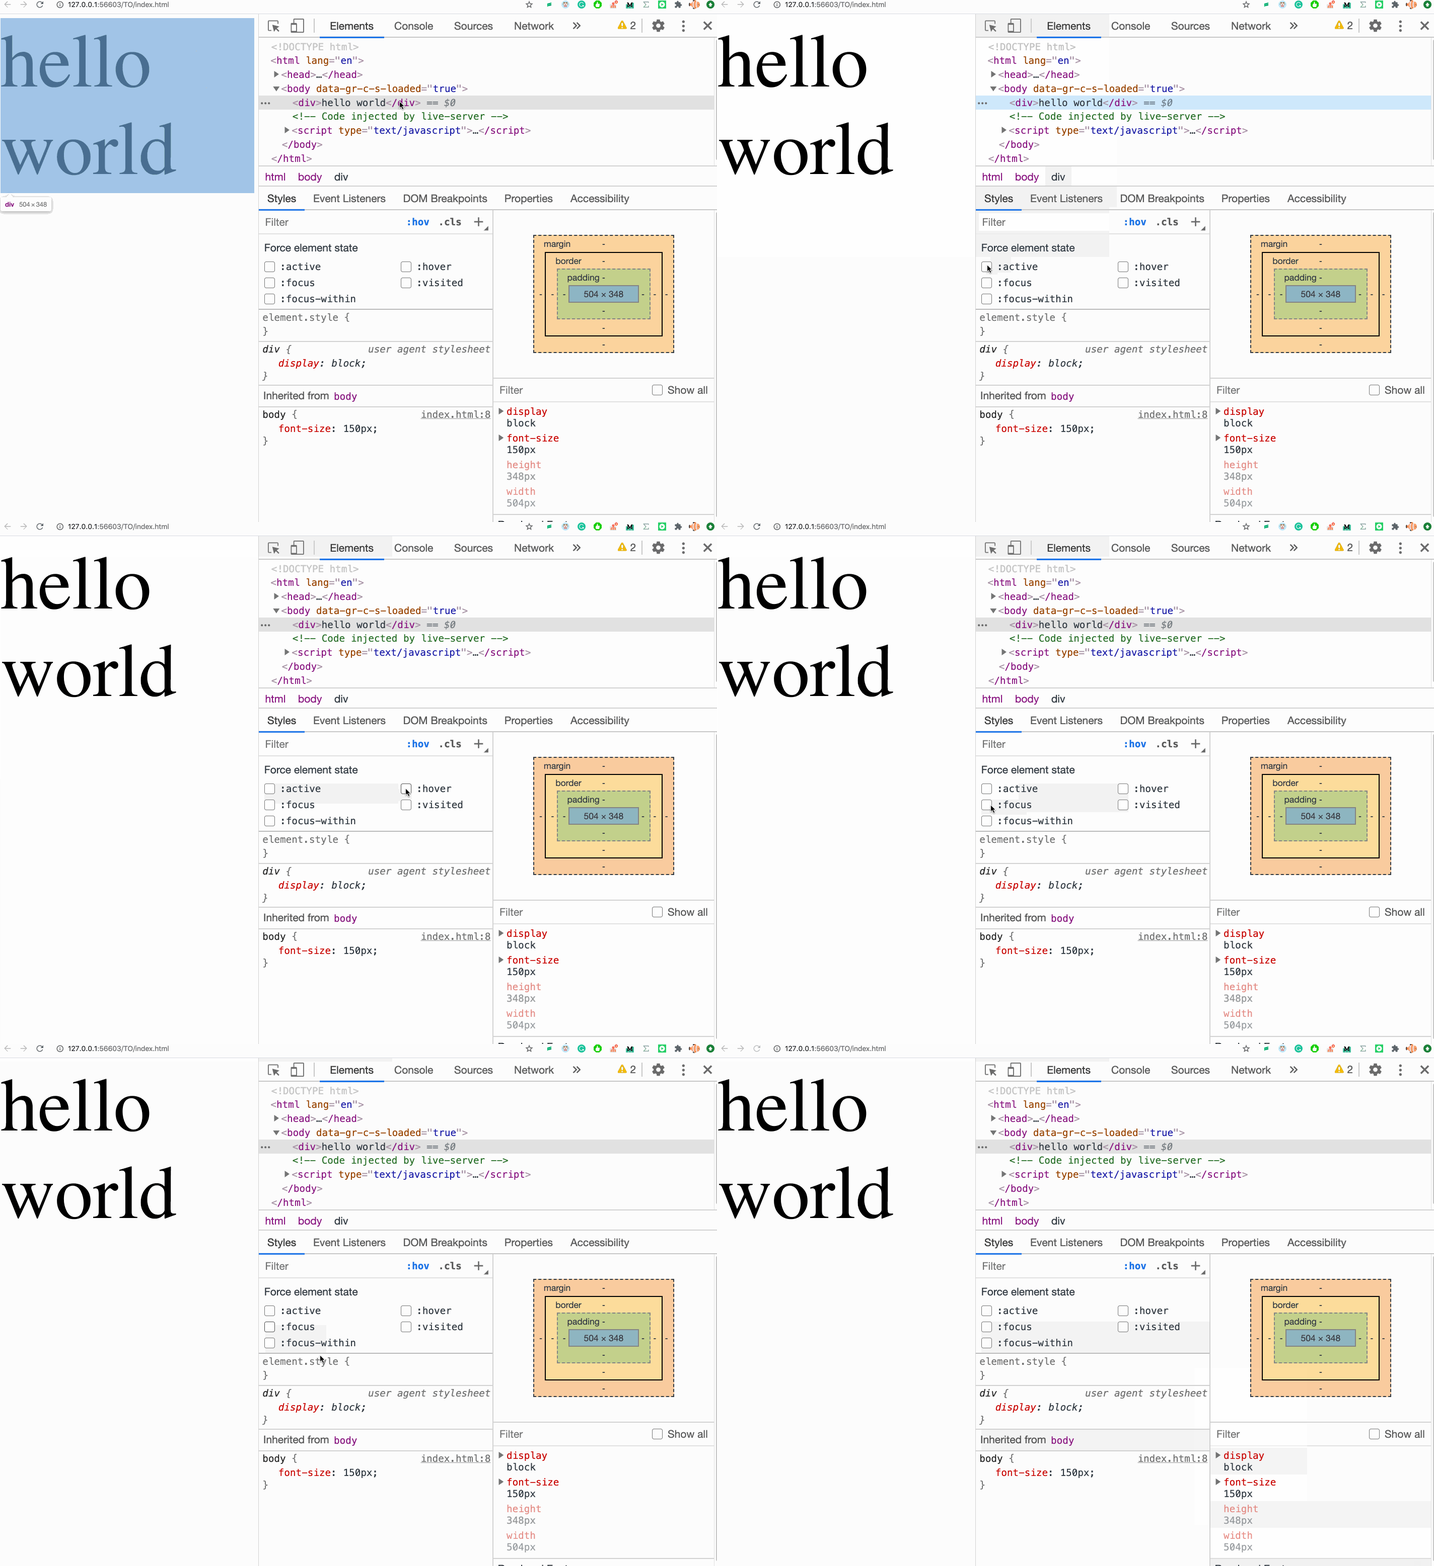
We open the page in a browser, check how the pseudo-classes work in the Elements tab, and make changes if necessary.
Hotkey for hiding items
When debugging CSS styles, it is often necessary to hide an element. Chrome does this quickly: you just need to select an item and press a key
H.
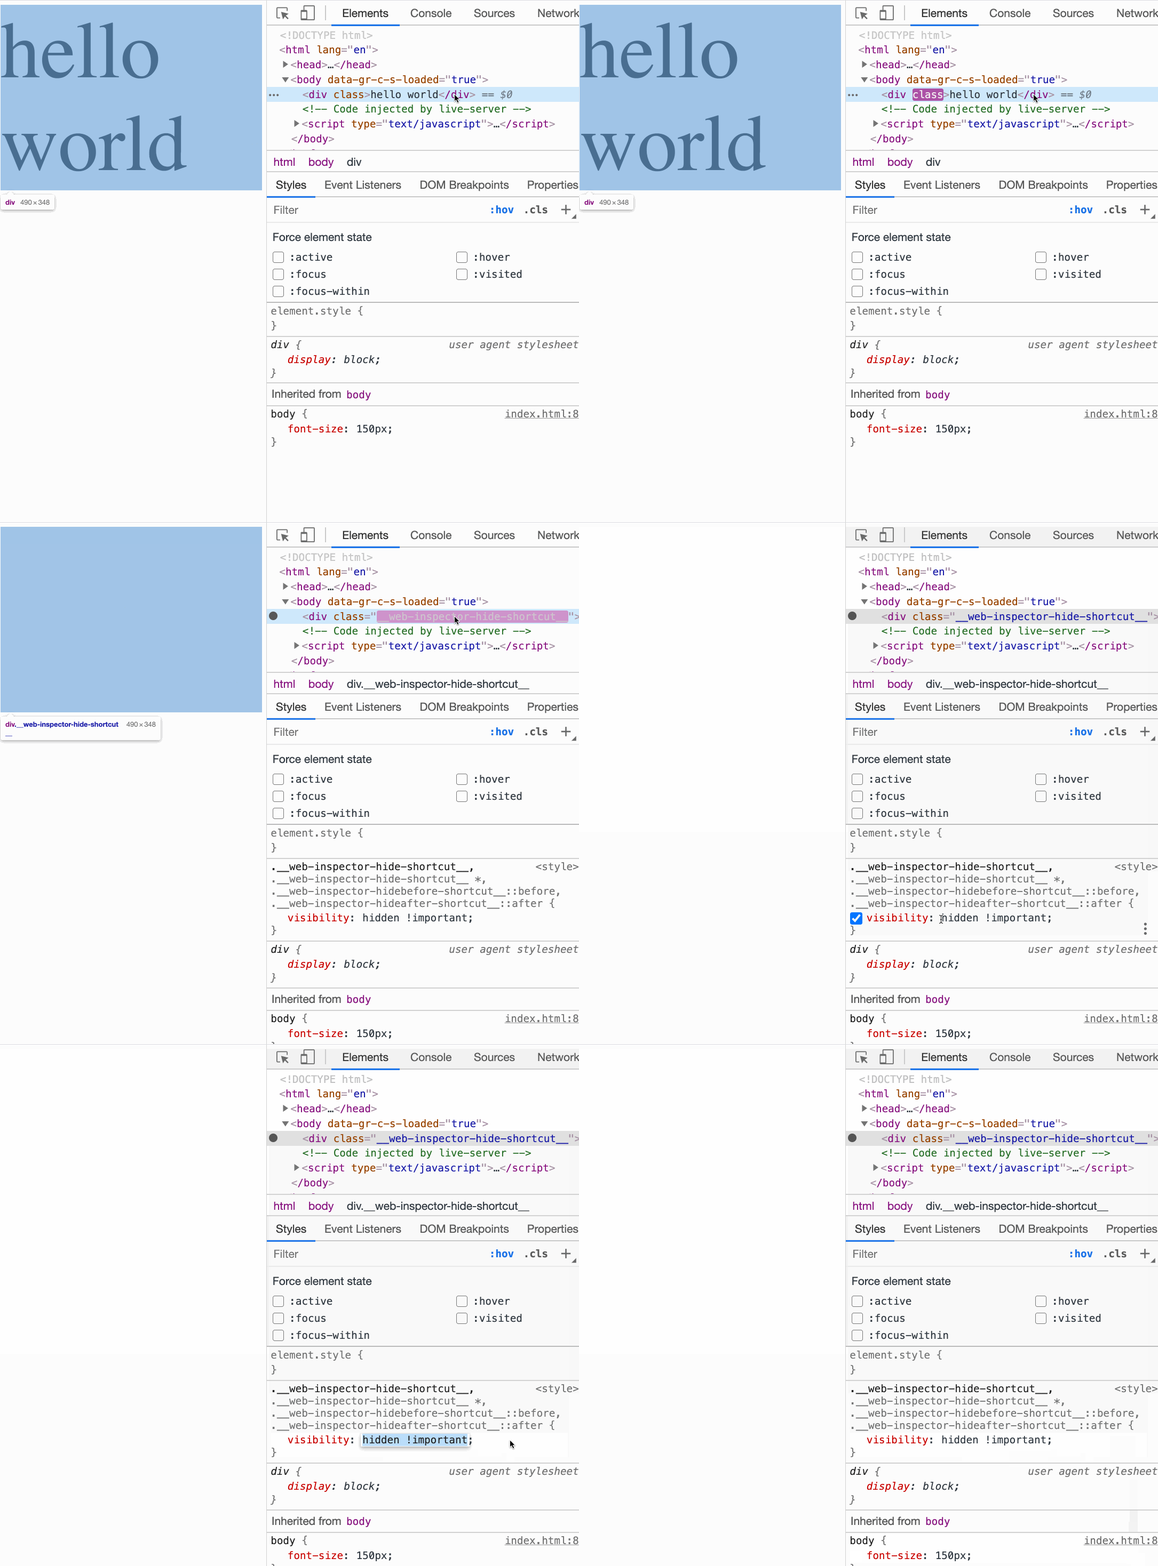
Press H on your keyboard
This operation applies a style to an element
visibility: hidden !important;.
Storing DOM element as a global temporary variable
If we want to quickly reference a DOM element in the console, we can do it like this:
- Select an item.
- Open the context menu with the right mouse button.
- Select Store as a global variable.
