
Companies can help their developers maximize productivity in a number of ways, from changing office space to acquiring better tools and cleaning up source code. But which decisions will have the greatest impact? Drawing on the literature on software development and industrial / organizational psychology, we identified productivity-related factors and interviewed 622 developers from three companies. We were interested in the factors mentioned and how people themselves assess their own productivity. Our findings suggest that self-esteem is most influenced by non-technical factors: enthusiasm at work, support for new ideas by your peers, and getting useful feedback on your productivity. Compared to other knowledge workers,software developers' assessment of their productivity depends more on the variety of tasks and the ability to work remotely.
1. Introduction
Improving developer productivity is important. By definition, when they complete their tasks, they can spend the free time on other useful tasks: introducing new features and new checks. But what helps developers be more productive?
Companies need practical guidance on which factors to manipulate to maximize productivity. For example, should a developer spend time looking for better tools and approaches, or should they turn off notifications during the day? Should a leader invest in refactoring to reduce code complexity, or give developers more autonomy? Should bosses invest in better development tools or a more comfortable office? In an ideal world, we would invest in various factors to increase productivity, but time and money are limited, so we have to choose.
This article is about the broadest study of software developer productivity forecasting to date. As described in section 3.1, productivity can be measured objectively (for example, in lines of code per month) or subjectively (as estimated by the developer himself). While neither approach is preferable, we have tried to cover the topic broadly with subjective judgment to answer three questions:
- What factors are the best predictors of how a developer will evaluate their productivity?
- How do these factors change from company to company?
- What predicts a developer's assessment of their productivity, in particular, compared to other knowledge workers?
To answer the first question, we conducted a study at a large software company.
To answer the second question, which helps to understand to what extent the results obtained can be generalized, we conducted a study in two companies from different industries.
To answer the third question, which helps to understand how developers differ from others, we conducted a study among representatives of other professions and compared it with the results obtained in the study of developers.
Our results show that in the companies we studied, self-esteem for their productivity is strongly influenced by enthusiasm at work, peer support for new ideas, and useful feedback about their productivity. Compared to other knowledge workers, software developers' assessment of their productivity is more dependent on the variety of tasks and the ability to work remotely. Companies can use our findings to prioritize productivity-related initiatives (Section 4.7).
Section 2 describes the companies we studied. Section 3 describes the research methodology. Section 4 describes and analyzes the results obtained. Section 5 describes other works on this topic.

2. Companies researched
2.1. Google
Google has about 40 development offices around the world, employing tens of thousands of developers. The company values close collaboration within teams, and offices are usually open-plan to bring team members closer together. The company is relatively young (founded in the late 1990s), its organizational structure is rather flat, and developers have a lot of autonomy. The promotion process includes feedback from peers, and developers do not need to transition to managerial positions to advance. Developers plan their time themselves, their calendars are displayed on the corporate network. Google uses agile development processes (like Agile), usually applied to the entire team.
Google values openness. Most developers work on a common monolithic codebase, making changes to the code of other people's projects is encouraged. The company has a strong culture of testing and code review: code submitted to the repository is reviewed by another developer, usually using tests. Most write server-side code that is released frequently and makes it relatively easy to roll out fixes. The development toolkit is largely unified (excluding editors) and built internally, including analysis and continuous integration tools, and the infrastructure for release.
2.2. ABB
ABB has well over 100,000 employees worldwide. As an engineering conglomerate, the company employs a wide variety of professions. There are about 4,000 common software developers and over 10,000 application developers who build industrial systems using industry-specific visual and textual languages. To operate its large IT infrastructure, the company maintains a significant staff of employees whose responsibilities include scripting and simplified programming.
Although ABB has taken over a number of smaller companies, it has a central organization responsible for unifying software development processes. So, despite the differences between departments, most of the tools and approaches are consistent. The same is true for most career paths: for techies from junior to senior developer, and for executives, from group leader to department leader and central management.
2.3. National Instruments
National Instruments was founded in the 1970s. Software development is mainly concentrated in four international research and development centers. Employee calendars are visible to the entire company, anyone can make an appointment with any other employee.
Job responsibilities facilitate development processes. Developers cannot independently choose a project, but they can take on specific tasks or features. Most work with a common monolithic codebase, with its different logical parts having specific owners. The entered code must be approved by the "owner". It is desirable that the code is analyzed by tech leads. This policy is optional, but many follow it.
Developers have a lot of freedom in their choice of tools. There are no generic tools unless there is an immediate benefit. For example, the choice of IDE is highly dependent on the task. There are a number of custom build and test tools available. Different parts of the company have standardized different systems for source code management and analysis. Software updates are usually released on a quarterly or yearly basis, with the exception of rare critical patches.
Table 1. Profiles of the three companies studied:
| ABB | National Instruments | ||
| The size | Big. | Big. | Petite. |
| Offices | Open offices. | Open and closed offices. | Open offices. |
| Tools | Mostly unified development tools. | Same tools. | Flexibility in the choice of tools |
| Development type | Mostly server-side and mobile code. | A combination of web development, embedded and desktop software. | Mostly embedded and desktop software. |
| Repository | Monolithic repository. | Separate repositories. | Monolithic repository. |
| Bias | Software development. | Engineering conglomerate. | Development of software and equipment. |
3. Methodology
Our goal: to find out what factors can predict the productivity of software developers. To do this, we conducted a study containing a set of questions, a set of productivity factors, and a set of demographic variables.
3.1 Assessing your productivity
First, let's describe how we will measure productivity. Ramírez and Nembhard have proposed a classification of performance measurement techniques described in the literature, including function point analysis, self-assessment, peer assessment, proportionality of results and efforts, and professional use of time [2]. These techniques can be divided into objective (for example, how many lines of code are written per week) and subjective (for example, self-assessment or peer review).
Neither technique is preferred; both categories have disadvantages. Objective measurements lack flexibility and playfulness. Let's take the number of lines of code per week. A productive developer can write a one-line fix for a hard-to-find bug. And an unproductive developer can easily inflate the number of lines. On the other hand, subjective measurements can be inaccurate due to cognitive biases. Take peer ratings: they may dislike a productive developer, and therefore will get worse ratings even if peers strive for objectivity.
Like the team of researchers led by Meyer who analyzed the productivity of software developers [3], we used our research questions as a subjective measure of productivity. There are two main reasons. First, as noted by Ramirez and Nembhardt, research is "a simple and popular way to measure the productivity [of knowledge workers]." Second, research provides responses from developers in different roles, and also allows respondents to add different information to their performance assessments.
Figure: 1. Research methodology:

We asked the respondents how much they agree with the statement:
I regularly achieve high productivity.
With it, we wanted to measure productivity as broadly as possible. We first formulated eight options for the question, and then reduced them to the above by talking informally with five Google developers about their interpretation of the phrase (Figure 1, bottom left). We added the words “high” and “regularly” to the question for three reasons. First, we wanted to capture a state with which people can compare themselves. Second, we wanted this state to be high in order to avoid the effects of reaching the ceiling in respondents' answers. Third, we wanted respondents to focus on two specific measures of productivity - intensity and frequency. In the future, researchers can apply more detailed measures by dividing intensity and frequency on two separate issues.
We put it to the test by asking three executives at Google to send it out to their teams asking, "What did you consider when responding to a productivity statement?" We received responses from 23 developers (Figure 1, bottom center). The option was considered acceptable for our purposes because the respondents' considerations coincided with our expectations regarding the value of productivity. These considerations covered workflow problems, work outcomes, being in a zone or flow, happiness, goals achieved, programming efficiency, progress, and minimizing waste. We did not analyze these responses in this paper, but the study included four additional, refined measures of productivity taken from previous works [2], [4], [5].
We chose two convenient measures of productivity to add objective data to contextualize self-esteem, and then correlated them with each other on Google. The first objective measure was the number of lines of code changed by a developer per week - a popular but difficult measure of productivity [6], [7]. The second measure was the number of changes made by the developer to the main Google codebase per unit of time. It is almost equivalent to the monthly pull request used by the team led by Vasilescu [8]. To assess our productivity, we used responses to a similar survey on Google (n = 3344 responses). We could not use data from our study for this analysis because the responses did not contain participant IDs.by which objective measures of productivity could be compared. In that study, they asked a similar question: "How often do you feel that you are highly productive at work?" Participants could answer "Rarely or never", "Sometimes", "About half the time", "Most of the time" and "Always or almost always." We then created a linear regression with self-reported performance as the ordinal dependent variable (coded 1, 2, 3, 4, and 5, respectively). Linear regression assumes equal distance between productivity ratings. Given the words used in the question, we consider this assumption to be justified. For ordered logistic regression, this assumption is not required. The application of this technique here gives reliable results: the same coefficients are significant in a linear,and in an ordered model.
We use logarithmic objective measures as independent variables, because they both have positively skewed. For control, we took the job code (for example, software engineer, research engineer, etc.) as a categorical variable, as well as the rank (junior, middle, senior, etc.) as a number (for example, 3 for software entry-level engineer at Google). Job code was statistically significant for two worker roles in each linear model. There were three models in total: two with one of the objective measures and one with both objective measures.

Figure: 2: Models predicting a subjective assessment of productivity based on two objective measures. ns means a statistically insignificant factor with p> 0.05, ** means p <0.01, *** means p <0.001. A full description of the models is given in the Supplementary Materials.
The contextualization results are shown in Fig. 2. Each model demonstrates a statistically significant level with a negative rating, which we interpreted as: higher ranked developers tend to rate themselves as slightly less productive. This is a strong argument for rank control (section 3.7.). The first two models demonstrate an important positive relationship between objective and subjective measures of productivity. That is, the more lines of code are written or changes are made, the more productive a developer considers himself to be. The resulting combined model and estimates for the first two models suggest that the number of changes made is a more important indicator of productivity than the number of lines written. But note that in all models the parameter R 2, representing the proportion of variance explained, is rather low - less than 3% for each model.
In general, the results obtained indicate that the number of lines of code and changes made affect the developers' assessment of their productivity, but not significantly.
3.2. Productivity factors
Then, during the course of the study, we asked participants about factors that in other works are considered to be related to productivity. We have collected questions from four sources (Figure 1, middle left). These sources are taken because, to our knowledge, they represent the most comprehensive overviews of individual productivity factors in the research of programmers and other knowledge workers.
First sourceIs a tool created by a team led by Palvalin to review productivity measures for knowledge workers [4]. The tool, called SmartWoW, has been used by four companies and covers aspects of physical, virtual and social workspace, personal work practices, and well-being at work. We've changed some of the questions to better reflect current developer terminology and better match American English. For example, SmartWoW asks:
I often telework for carrying out tasks that require uninterrupted concentration.
We have paraphrased:
I often work remotely for carrying out tasks that require uninterrupted concentration.
From SmartWoW, we first selected 38 questions for our study.
A second source is a review by Hernaus and Mikulić of the impact of work environment characteristics on the productivity of knowledge workers [9]. Their proven work reflects previous productivity studies: a work environment design questionnaire [10], a diagnostic work environment study [11], an assessment of group collaboration [12] an assessment of the “nature of tasks” [13]. We've changed the questions to be short and consistent. For the same purpose, we took questions directly from work [12], which is devoted to working groups with little considerations about personal productivity.
Third source- a structured review of Wagner and Ruhe of productivity factors in software development [14]. Unlike other sources, this work has not been thoroughly verified by the scientific community and does not contain original empirical research. But to the best of our knowledge, this is the most comprehensive survey of programming productivity research. The factors formulated by Wagner and Rouet are divided into technical and non-quantifiable factors, and then the factors of environment, corporate culture, project, product and development environment, capabilities and experience are additionally highlighted.
The fourth sourceIs a Microsoft developer study led by a team led by Meyer. From it, we gleaned five main reasons for productive work days, including goal setting, work meetings, and breaks from work [15].
We also added three factors that, in our opinion, were not properly taken into account in previous works, but which turned out to be important in the context of Google. One is the productivity assessment of knowledge workers [16], an unpublished precursor to SmartWoW. We adapted it like this:
The information provided to me (bug reports, user scripts, etc.) is accurate.
The second factor is taken from the work environment design questionnaire and adapted as follows:
I get useful feedback on my work productivity.
And we created a third factor that was important in the ABB environment:
I need direct access to certain hardware to test my software.
First, we picked 127 factors. To reduce them to such a number of questions that respondents can answer without significant fatigue [17], we used the criteria shown in the center of Fig. 1:
- Removed duplicates. For example, in SmartWoW [4] and Meyer et al. [15], goal setting is considered an important factor in productivity.
- Similar factors combined. For example, Hernaus and Mikulich describe different aspects of interaction between work groups that increase productivity, but we have reduced them to one factor [9].
- The preference was given to factors with obvious utility. For example, SmartWoW [4] has the following factor:
Employees have the opportunity to see each other's calendars.
At Google, this is true everywhere and is unlikely to change, so the factor has low utility.
We have applied these criteria jointly and iteratively. First, a large poster of all the candidate questions for use in the study was printed. Then we put up a Google poster next to our office. Then each of us independently analyzed the questions based on the above criteria. The poster hung for several weeks, we periodically supplemented and revised the list again. Finally, a final list of questions was drawn up.
Our study included 48 factors in the form of statements (Fig. 4, left column). The respondents indicated their degree of agreement with these statements on a five-point scale, from “Strongly disagree” to “Strongly agree”. Factors can be grouped into blocks related to methodology, focus, experience, job, opportunity, people, project, software and context. We also asked one open-ended question about factors that respondents felt we might have missed. The complete questionnaire from our study is provided in the Supplementary Materials.

Figure: 3: Example question from research.
3.3. Demography
We asked questions about several demographic factors, as shown in Figure 1:
- Floor.
- Position.
- Rank.
The authors of previous works have suggested that gender is associated with factors of productivity of software developers, for example, with the success of debugging [18]. Therefore, the study had an optional question about gender (male, female, refuse to answer, my own). The respondents who did not answer the question were assigned to the “refuse to answer” group (Google n = 26 [6%], ABB n = 4 [3%], National Instruments n = 5 [6%]). We treated this data as categorical.
As for the position, we took the seniority at Google from the HR department. This was not possible with ABB and National Instruments, so we added an optional question to the study. At ABB, in the absence of responses (n = 4 [3%]), we took 12 years of experience, this is the average of the collected data. At National Instruments, we took 9 years for the same reason (n = 1 [1%]). It can be made more difficult [19], for example, using substitutions to predict missing values based on the available data. Let's say that the missing rank information can be filled out fairly accurately based on position and gender. However, we substituted just average statistical values, since demographic factors were not of primary importance for us, they were only accompanying information for control. We processed this data as numbers.
In terms of rank, on Google we asked participants to indicate their level as a number. The missing answers (n = 26 [6%]) we referred to the most common value.
At ABB, contributors could optionally indicate “junior or senior software developer,” although many indicated “different” title. If the answer included the words:
- older
- leading
- manager
- architect
- researcher
- main
- scientist
then we referred such answers to "senior" ones. The rest were referred to as "junior". The missing answers (n = 4 [3%]) we attributed to the most common meaning - “senior”.
National Instruments had options:
- challenger
- staff
- older
- principal architect / engineer
- chief architect / engineer
- honored engineer
- participant
- other
The only “other” turned out to be an intern, whom we transferred to the “applicants”. The missing answers (n = 3 [4%]) we attributed to the most common meaning - “senior”.
We have coded ranks in all companies by numbers.
3.4. Comparison with non-developers
Next, we were interested in what exactly allows us to predict how developers evaluate their productivity. For example, we assumed that productivity was influenced by being off work, but that could be said for any knowledge worker. Therefore, a natural question arises: does this somehow affect developer productivity in a special way?
To answer this question, we chose professions comparable to software developers. First, we tried to select based on positions in Google. Although some positions indicated that they were knowledge workers, the most common and, in our opinion, the most reliable indicator of a suitable non-developer was the presence of the word "analyst" in the position. We decided to compare Google analysts and developers, rather than compare Google analysts with developers from all three companies. We decided that this would allow us to control the characteristics of the company (for example, if suddenly Google employees are statistically more or less sensitive to interruption than employees of other companies).
We then adapted our research for analysts. Removed questions clearly related to software development, such as "My software requirements change frequently." We have remade other questions specifically for analysts. For example, instead of "I use the best tools and techniques to develop software," we wrote "I use the best tools and approaches to do my job."
Productivity scores were measured in the same way as developers. The same goes for assessing gender, position and rank. We tested the "analytic" version of the study on a convenient sample of five analysts who said the study was generally clear and made a few minor tweaks. We accepted them and conducted a full-fledged study of non-developers.

3.5. control qestion
In order to exclude answers that were given thoughtlessly, after about 70% of the beginning of the study, we inserted a question for attentiveness [20]: "Answer this," I rather disagree. " We did not take into account the forms that did not contain such an answer to this question.
3.6. Share of responses
At Google, we selected 1,000 random full-time employees from human resources who were in software development roles. We received 436 completed forms from them, that is, the response rate was 44%, which is a very high indicator for research among developers [21]. After deleting the forms with the wrong answer to the security question (n = 29 [7%]), 407 answers remained.
For a survey of knowledge workers, we selected 200 random full-time Google employees with the word “analyst” in their job titles. We decided not to research too many analysts because our target was software developers. 94 people, 47%, answered our questions. After deleting questionnaires with an erroneous answer to the security question (n = 6 [6%]), 88 remained.
We sent out our questionnaires to approximately 2,200 randomly selected software developers at ABB and received 176 responses. This is 8%, at the lower limit for such studies [21]. After deleting the wrong questionnaires (n = 39 [22%]), 137 remained.
Finally, we sent out the questionnaires to about 350 software developers at National Instruments and received 91 responses (26%). After deleting the wrong questionnaires (n = 13 [14%]), 78 remained.
3.7. Analysis
For each factor in each company, we applied individual linear regression models, using the factor as the independent variable (for example, "My project timeline is tight"), and the estimate of our productivity as the dependent variable. We ran separate models for each company for the sake of privacy, so that the raw data from different companies did not mix. To reduce the effect of collateral variables, we added existing demographic variables to each regression model. In interpreting the results, we focused on three aspects of the productivity factor ratio:
- Assessment . Indicates the degree of influence of each factor while maintaining a demographic constant. The higher the value, the higher the impact.
- . . , .
- . p < 0,05. 48 , p -, [22].
When interpreting the results, we focused more on the degree of influence (assessment) and less on statistical significance, because it can be extracted from large enough datasets, even if the practical significance is low. As we'll see below, statistically significant results were most often found on Google, with the highest response rate; least of all - in National Instruments, where the response rate was lower. We felt that this difference was due in large part to statistical power. We urge you to be more confident in statistically significant results.
To provide context, we also analyzed how demographic factors correlate with performance ratings. To do this, we ran multiple linear regression for each company with demographic variables as independent variables and an estimate of our productivity as the dependent variable. We then analyzed the overall predictive value of the resulting model, as well as the impact of each explanatory variable.
3.8. About causality
Our methodology allows us to assess the relationship between the factors of productivity and the assessment of their own productivity, although in essence we are interested in the degree of influence of each factor on the change in productivity. How correct is it to believe that there is a causal relationship between factors and productivity?
Correctness depends mainly on the strength of the evidence for causation in previous work. And this power is different for different factors. For example, a team led by Guzzo conducted a meta-analysis of 26 articles on evaluation and feedback, and the results provide excellent evidence that feedback does increase productivity in the workplace [23]. However, determining the strength of the evidence for each factor investigated requires a lot of work, which is beyond the scope of this article.
To summarize: although our study does not allow establishing a causal relationship, but based on previous work, we can confidently believe that these factors affect productivity, but interpret our results with some caution.

4. Results
To begin with, we describe the relationship between all factors of productivity and the assessment of their productivity when controlling demographic characteristics. These data will be used to answer each survey response, followed by a discussion of the results. We will then discuss the relationship between demographic characteristics and performance measurement. Finally, let's discuss the implications and risks.
4.1. Productivity factors
In fig. 4 shows the results of our analysis described in section 3.7. The first column lists the factors that were proposed to the participants in the form of statements; followed by the factor labels (F1, F2, etc.) that we assigned after the analysis was completed. Lack of data means that these factors are specific to developers and were not suggested to analysts (for example, F10).
Figure: 4: Relationships between 48 factors and how developers and analysts evaluate their own productivity in three companies:
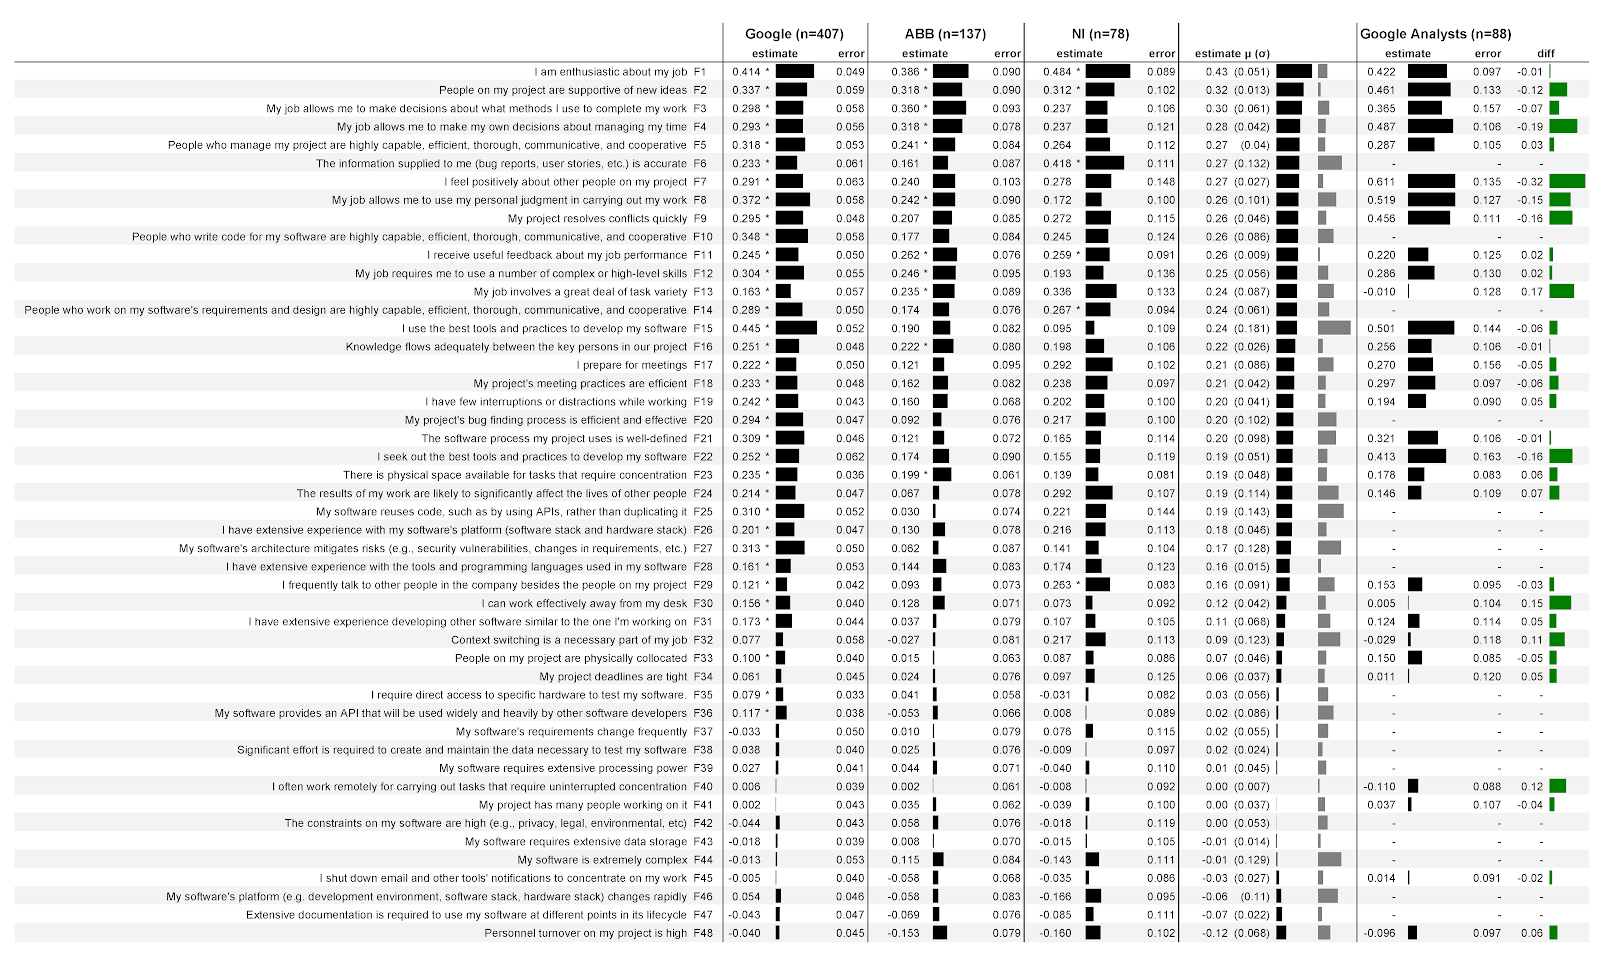
The next three columns are data from three companies, as well as data from Google analysts. Each of these columns is divided into two sub-columns.
Sub-column estimate(score) contains regression coefficients that quantify the strength of the association of a factor with an estimate of its productivity. The larger the number, the stronger the association. For example, in the first column of Google, the estimate is 0.414. In this case, this means that for each point of increasing agreement with the statement about enthusiasm in work (F1), the model predicts an increase in the respondent's productivity rating by 0.414 points with control of demographic variables. The ratings can be negative. For example, in all three companies, the more staff turnover in the team (F48), the lower the estimate of their productivity. Next to each score is an indicator that clearly reflects the score.
Please note that the scores do not mean higher ratings of factors, but a higher correlation between the factor and the rating of your productivity. For example, National Instruments (F1) scores higher on enthusiasm than other companies. This does not mean that developers there are more enthusiastic: in this company, he is a stronger factor in predicting the assessment of their productivity. We do not provide the ratings themselves, because this is prohibited under the terms of cooperation. Without full context, ratings can be misinterpreted. For example, if we report that developers at one company are less enthusiastic about their work than developers at another company, you might get the impression that it’s better not to work at that other company.
Second subcolumn error(error) contains the standard errors of the model for each factor. The lower the value, the better. Intuitively, lower values seem to indicate that when factors change, the model predicts its performance more reliably. The overall error values are fairly stable from factor to factor, especially on Google with a large number of respondents.
An asterisk (*) indicates that this factor was statistically significant in the model. For example, enthusiasm for work (F1) is statistically significant in all three companies, while preparation for meetings (F17) is only significant in Google.
The next column contains the mean ( μ ) score for all three companies with standard deviation in parentheses ( σ). The first indicator clearly shows the value of the average score, the second indicator - the value of the standard deviation. For example, the average score for enthusiasm at work (F1) was 0.43, the standard deviation was 0.051. The table is sorted by average rating.
The last column contains the diffs between the software developer and analyst ratings at Google. Positive values mean higher developer ratings, negative mean higher analyst ratings. For example, in terms of enthusiasm (F1), analysts have slightly lower ratings than developers.
4.2. What factors best predict how developers will evaluate their productivity?
The strongest predictive factors are statements with the highest absolute average score. The weakest predictive factors are those with the lowest absolute average score. In other words, the factors at the top of the table in Fig. 4 are the best predictors. To understand which factor provides the most confidence in the result, we have highlighted results that are statistically significant for all three companies:
- Enthusiasm for work (F1)
- Peer support for new ideas (F2)
- Useful feedback on work performance (F11)
Discussion . Please note that the first 10 productivity factors are not technical. This is surprising given that, in our estimation, most of the research of software developers is focused on technical aspects. Therefore, an active reorientation towards the human factor can lead to a significant increase in the influence of researchers on the industry. For example, answers to the following questions can be particularly fruitful:
- What makes software developers enthusiastic about their work? What explains the difference in enthusiasm? What interventions can increase enthusiasm? This article can supplement the research on happiness [24] and motivation [25].
- ? , ? ?
- , ? ? ?
Another important feature is the ranking of factors from the COCOMO II line of research. These factors, obtained in the course of empirical studies of industry software projects and verified by numerical analysis of 83 projects [26], were originally formulated to estimate the cost of software development. For example, productivity factors from COCOMO II include base platform volatility and product complexity. It is curious that the factors COCOMO II taken into account in our study (F5, F10, F14, F16, F24, F26, F28, F32, F33, F34, F36, F38, F39, F43, F44, F46, F47, F48) received lower values. It can be assumed that they make it possible to predict productivity worse. The upper half of the predictive factors (F1 – F24) included only 5 of COCOMO II, and the lower half - 14 factors. We can offer two different interpretations. First:COCOMO II lacks several important productivity factors, and future iterations of COCOMO II may be more predictive if more of the factors we investigated, such as support for autonomy of work approaches, are introduced in the company. Another interpretation: COCOMO II is adapted for the current task - fixing productivity at the project level [6], [27], [28], [29], [30], [31] - but less suitable for fixing productivity at the individual developer level. This interpretation emphasizes the importance and novelty of our results.COCOMO II is adapted for the current task - fixing productivity at the project level [6], [27], [28], [29], [30], [31] - but less suitable for fixing productivity at the individual developer level. This interpretation emphasizes the importance and novelty of our results.COCOMO II is adapted for the current task - fixing productivity at the project level [6], [27], [28], [29], [30], [31] - but less suitable for fixing productivity at the individual developer level. This interpretation emphasizes the importance and novelty of our results.
In addition, all COCOMO II factors were relatively low and statistically insignificant predictive factors for productivity across all three companies. For instance:
- My software needs a lot of processing power (F39).
- My software needs a large data store (F43).
- My software platform (e.g. development environment, software or hardware stack) is changing rapidly (F46).
One explanation: In the 20 years since the creation and testing of COCOMO II, platforms have become less diverse in terms of productivity. It is likely that standardized operating systems are now protecting developers from productivity losses due to hardware changes (like Android in mobile development). Likewise, cloud platforms can protect developers from productivity losses due to process scaling and storage needs. Not to mention, modern frameworks and cloud platforms are easy to use. In addition, the difference in productivity when processing large and small amounts of data may have disappeared since the creation of COCOMO II.
4.3. How do these factors differ from company to company?
To answer this question, you can look at the standard deviation in the estimates for the three companies. Here are the three factors with the least variability, that is, with the most stable values across companies:
- Using telework for focus (F40).
- Useful feedback on work performance (F4).
- Peer support for new ideas (F2).
We believe that the stability of these factors makes them good candidates for generalizability. Other companies are likely to see similar results for these factors.
And here are the three factors with the greatest variability, that is, with the largest spread of values across companies:
- Using the best tools and approaches (F15).
- Code reuse (F25).
- Accuracy of incoming information (F6).
Discussion . The three least variable factors (F40, F4 and F2) have a common feature - they do not relate to technology, but to society and environment. Perhaps this suggests that wherever developers work, they are equally affected by remote work, feedback and peer support for new ideas. Changing these three factors may prove to be the biggest impact.
Why are the factors F15, F25 and F6 so different in different companies? For each of them, we have a possible explanation based on what we know about these companies.
Using the best tools and approaches (F15) is most strongly associated with Google's performance score, but not significantly associated with National Instruments. Possible explanation: Google's codebase is significantly larger. Hence, using better tools and approaches to navigate and understand the larger codebase efficiently has a significant impact on productivity. And at National Instruments, productivity is less tool-dependent because the codebase is smaller and clearer.
Code reuse (F25) is strongly related to Google's performance score, but not significantly related to ABB. Possible explanation: Google makes it easier to reuse code. The codebase is monolithic, and all developers can examine virtually every line of code in the company, so reuse does not require much effort. And ABB has a lot of repositories that you have to access. And in this company, productivity gains (through reuse) can be offset by productivity losses (from finding and getting the right code).
Information Accuracy (F6) is strongly related to National Instruments' performance scores, but not significantly related to ABB. Possible explanation: Developers at ABB are better insulated from the influence of inaccurate information. In particular, at ABB, several levels of the support team are dedicated to getting the correct bug information from customers. If the developer receives inaccurate information, then his productivity may drop, because he has to delegate the task of refining the data back to the support team.
4.4. What makes it possible to predict a developer's assessment of their productivity, in particular, in comparison with other knowledge workers?
To answer this question, turn to the last column in Fig. 4. If we look at several relationships between maximum ratings, we will see that analysts' assessment of their productivity is more strongly associated with:
- Positive perception of their teammates (F7).
- Autonomy in the organization of working time (F4).
On the other hand, developers' assessment of their productivity is more strongly related to:
- Performing various tasks within the work (F13).
- Working effectively outside their workplaces (F30).
Discussion . Overall, the results suggest that developers are somewhat similar to other knowledge workers, and somewhat different. For example, developer productivity is best predicted by enthusiasm at work, and analysts have much the same. We believe that companies can use our findings to select developer-specific productivity initiatives or broader initiatives.
Google's Unified Development Toolkit may explain why increasing task diversity is associated with higher productivity ratings from developers, not analysts. Diversity of tasks can reduce boredom and increase productivity for both groups, but Google's unified development tooling can mean that developers can use the same tools for different tasks. And analysts may need to use different tools for different tasks, which increases cognitive effort in context switching.
Out-of-office work may explain why improving work efficiency away from the workplace is more strongly associated with productivity gains for developers than for analysts. We believe that taking a break from work is more harmful during programming than during analytical work.
Parnin and Rugaber found that returning to work after interruption is a frequent and persistent problem for developers [32], leading them to need better tools to help them get back to work on a problem [33].

4.5. Other productivity factors
At the end of the questionnaire, respondents could indicate additional factors that, in their opinion, affect productivity. For the most part, these additions were the same or more refined descriptions of our 48 factors. We discarded such additions, but, if necessary, created new factors. The Supplementary Materials contain descriptions of new factors, as well as updated descriptions of the ones we originally proposed. Prospective researchers may have a new mixed team question to work on a project, or refine or suggest more specific question breakdowns for factors F15, F16, and F19.
4.6. Demography
At Google and National Instruments, neither general demographic models, but individual attendant variables were statistically significant predictors of their performance scores.
For ABB, the demographic model turned out to be significant ( F = 3 , 406 , df = (5 , 131) , p <0.007). Gender also turned out to be a statistically significant factor ( p = 0.007); women estimate their productivity 0.83 points higher than men. Participants of other genders (“other”) showed a score 1.6 points higher than that of men ( p = 0.03). The position ( p= 0.04), each additional year the company raised its performance estimate by 0.02 points. As far as we know, the differences between ABB and the other two companies do not explain why these demographic factors were only predicted to be significant at ABB and nowhere else.
4.7. Application in practice and in research
How to use our results in practice? We have provided a ranked list of the most important factors in predicting productivity that can be used to prioritize initiatives. Examples of initiatives can be found in previous research papers.
For example, to increase enthusiasm at work, Markos and Sridevi suggested helping workers grow professionally [34] through workshops on technology and interpersonal communication. Also, the researchers suggested introducing the practice of appreciation for good work. For example, ABB is experimenting with public appreciation for developers who have implemented tools and techniques for navigating structured code [35].
To increase support for new ideas, Brown and Duguid have proposed formal and informal ways to share best practices [36]. At Google, the one-way dissemination of knowledge is through the Toilet Testing initiative: Developers write short news stories about testing or another area, and then these notes are posted in toilets throughout the company.
To improve the quality of feedback on work productivity, London and Smither suggest focusing on feedback that is non-judgmental, behavior-based, interpretable and outcome-oriented [37]. At Google, such feedback can be obtained through innocuous post-mortems: after important negative events such as a drop in services, engineers jointly write a report on the actions that influenced the original cause of the problem, without blaming specific employees.
We see several directions for future research based on our work.
First, a systematic review of articles that characterize the impact and context of evidence for each productivity factor discussed here will improve the usability of our work by creating causal relationships. Where they are weak, applicability can be improved by conducting a series of experiments to establish causation.
Second, as mentioned in sections 4.5 and 4.6, prospective researchers can use additional factors suggested by our respondents and examine the influence of gender and other demographic factors on developer productivity.
Third, the impact of productivity research on software development can be improved with a multidimensional set of metrics and tools that have been validated through empirical research and triangulation.
Fourth, if researchers can calculate the cost of changing factors that affect productivity, companies can make smarter investment decisions.
4.8. Risks
When interpreting the results of this study, several risks to its validity must be considered.
4.8.1. Risks to data reliability
Firstly, we talked about only one measurement - the assessment of your productivity. There are other dimensions, including objective measures, such as the number of lines of code written per day, an approach used by Facebook [38]. As we pointed out in Section 3.1, all productivity metrics have flaws, including measuring your own productivity. For example, developers may assess their productivity too lightly, or artificially overestimate their assessment due to bias in society [39]. Despite these shortcomings, the team led by Zelenski builds on previous work to argue the validity of the performance assessment [40], which is also used in this article.
Second, we measured our productivity with a single question that hardly covers the entire spectrum of developer productivity. For example, the question focuses on frequency and intensity, but does not consider quality. We also did not ask respondents to limit their responses to a specific time frame, so some participants may respond based on their experiences over the past week, while others assessed their experiences over the past year. In retrospect, the study should operate with a fixed time interval.
Thirdly, due to the limited number of questions, we relied only on those factors that were investigated in previous works. The 48 questions we selected might not cover all aspects of productivity-related behaviors. Or, the factors we chose could be too general in certain cases. For example, in retrospect, the factor related to the best “tools and approaches” (F14) might be more powerful if we separated tools from methods.
4.8.2. Internal risks to reliability
Fourth, as we mentioned in section 3.8, we have drawn on previous work to establish causal relationships between factors and productivity, but the strength of the evidence for relationships can vary. It may turn out that some factors affect the assessment of their productivity only indirectly, through other factors, or their connection generally has the opposite direction. For example, it is likely that a major factor in productivity, increased enthusiasm for work (F1), may actually be due to increased productivity.
4.8.3. External risks to reliability
Fifth, although we examined three fairly different companies, generalizability with other types of companies, other organizations, and other types of knowledge workers is limited. In this paper, we have selected analysts as representatives of non-developers, but this category includes several types of knowledge workers - doctors, architects, and lawyers. Another risk to reliability is bias due to lack of responses: the people who answered the questionnaires were self-selected.
Sixth, we analyzed each factor of productivity separately, but many factors can accompany each other. This is not an analysis problem, but the applicability of the results. If the factors are codependent, then changing one can adversely affect the other.
4.8.4. Risks to Constructive
Credibility Seventh, in creating this study, we were concerned about the possibility that respondents might recognize our analysis methodology and not answer truthfully. We tried to reduce this likelihood by separating the issue of productivity from its factors, but the respondents may have been able to draw conclusions about our analysis methodology.
Finally, we have rephrased some of the questions to adapt the study to the analyst, which could undesirably change the meaning of the questions. Consequently, differences between developers and analysts may have arisen from differences in questions, rather than in profession.
5. Related work
Many researchers have studied individual productivity factors for software developers. For example, Moser and Nierstrasz analyzed 36 software development projects and explored the potential impact of object-oriented technologies on improving developer productivity [41].
Another example is the study by DeMarco and Lister of 166 programmers from 35 organizations doing a one-day programming exercise. The authors found that the workplace and organization are associated with productivity [42].
A third example is a laboratory experiment by Kersten and Murphy with 16 developers. It turned out that those who used the tool to focus on the task were much more productive than others [43].
In addition, the systematic analysis of Wagner and Rouet gives a good idea of the relationship between individual factors and productivity [14]. The team led by Mayer offered an even more recent analysis of the overview of productivity factors [3]. In general, our work is based on these studies of individual factors with a broader study of their diversity.
Petersen's systematic review states that seven papers numerically assess factors that predict software developer productivity [44]. In each work, numerical methods are used for forecasting, usually this is regression, which we also used in our research. The most common factors are related to project size, and 6 out of 7 factors are explicitly formulated based on the COCOMO II productivity drivers ([6], [27], [28], [29], [30], [31]). The most complex forecasting model in Petersen's study uses 16 factors [6].
Our work has two main differences. First, in comparison with previous works, we estimate more factors (48), and their variety is wider. We selected factors based on industrial and organizational psychology. Secondly, we had a different subject for analysis: previous researchers studied what could predict productivity within the framework of the project, and we were interested in the personal productivity of people.
In addition to software development, previous studies compared factors that predict productivity in other professions, in particular, in the field of industrial and organizational psychology. While such studies have focused on firm-level productivity [45] and physical labor such as manufacturing [46], the most closely related area is the productivity of knowledge workers. That is, people actively using knowledge and information in their work, usually using a computer [47]. Comparison of factors for such professions is presented in two main works. The first is a team study led by Palwalin about 38 factors that previous studies have compared with productivity. These factors encompass the physical, virtual and social workspace,personal working approaches and well-being at work [4]. The second work is a study by Hernaus and Mikulich of 512 knowledge workers. The authors studied 14 factors, divided into three categories [9]. We relied on both of these works in preparing our study (Section 3.2).
However, studies comparing productivity factors for knowledge workers have not paid attention to software developers. There are two main reasons for this. First, it is unclear to what extent the overall results obtained are projected onto developers. Second, such studies are usually abstracted from developer-specific factors, such as software reuse and codebase complexity [48]. Therefore, there is a gap in the literature in understanding the factors that allow predicting developer productivity. Filling this gap is practical. We have created three research teams in three companies to improve productivity. Bridging this knowledge gap helps our teams to research, and companies to invest in developer productivity.
6. Conclusion
There are many factors that affect developer productivity, but organizations have limited resources to focus on improving productivity. We created and conducted a study in three companies to rank and compare different factors. Developers and leaders can use our findings to prioritize their efforts. To put it simply, previous papers have suggested many ways to improve the productivity of software developers, and we have suggested how you can prioritize those ways.

Block of questions
What makes a developer productive?
This one-page, anonymous research will take you 15 minutes and will help us better understand what affects developer productivity. Please answer openly and honestly.
The research will ask questions about you, your project, and your software. Please remember:
My software refers to the core software that you develop at ABB, including products and infrastructure. If you are working on different programs, then answer only on the main one.
My project belongs to the team with which you create software. Please answer any related questions about other software developers at ABB.
Some questions touch on potentially sensitive topics. Fill in the answers so that no one can peep over your shoulder, and clear your browser history and cookies after filling out the questionnaire.
Please rate your agreement with the following statements.
List of research questions


These questions are designed to provide a comprehensive assessment of factors that can affect productivity. Are we missing something?
Gender (optional)
What is your title? (optional)
In what year did you join ABB?
Additional materials
Productivity factors noted by respondents
In this section, we list the factors that respondents described in their responses to the open-ended question. First, we will describe several new factors, and then we will give descriptions of factors related to those already in the study. We supplemented respondents' comments with codes using our factors. Here we do not discuss or evaluate the answers of people, we do not supplement the existing descriptions of our factors.
New factors
In the comments, 4 topics were raised that were not reflected in our study. Six responses raised topics of the mixed project team, in particular the ratio of managers to developers; the presence of a sufficient number of employees in the project; and whether management is able to maintain strong ownership of the product. One respondent noted the impact on productivity of the type of software (server, client, mobile, etc.). Another noted the influence of physiological factors such as the number of hours of sleep. Another mentioned the opportunities for personal growth.
Available factors
F1. Five respondents mentioned factors related to enthusiasm at work: two mentioned work motivation and recognition, one - morality, and one - a depressing office building.
F3. Four of the respondents noted factors related to autonomy in choosing work methods. One mentioned autonomy at the team level, another about the policy that prevents the use of a good open source system, the third about the priorities adopted in the company that limit the use of certain techniques in teams.
F4. One respondent noted autonomy in scheduling working hours, which is limited to priorities dictated by the need for promotion.
F5. Three respondents noted leadership competence. One mentioned leadership with a coherent strategy, the second - conflicting priorities passed down by management, the third - management of employee productivity.
F6. Eight respondents said they provided accurate information. Three mentioned cross-team communication through documentation (and other channels), and two mentioned the clear definition of the goals and plans of the team.
F7. Two respondents noted positive feelings towards colleagues in the light of team and team cohesion.
F8. One respondent noted autonomy in doing work: company policy dictates what resources can be used.
F9. One respondent noted conflict resolution, indicating that personal habits of teammates were contrary to social norms.
F10. Four respondents noted the competence of the developers. One mentioned the difficulties in understanding the code, the other - the knowledge of the subject area, the third - the seriousness of the attitude towards testing.
F11. One respondent noted feedback on work productivity: gaining recognition from colleagues and management, promotion.
F12. One respondent noted the complexity of software implementation “from my brain to the shipped product”.
F13. Two respondents noted the variety of tasks, in particular, intercepting tasks on behalf of their team and context switching.
F14 Four respondents rated the requirements and architecture people as competent. One mentioned insufficient attention to problems, another - the readability of architectural documents, the third - the quality of project plans, the fourth - the presence of "adequate support in the development of requirements."
F15. Thirty-two respondents reported using the best tools and approaches. Twelve mentioned the performance of the tools, especially the speed and latency issues in build and test. Five people mentioned available features, three mentioned compatibility and migration issues, two mentioned that even the best tool available might not meet the needs. Other comments on tools and approach have mentioned the level of automation offered by tools; specialized debuggers and simulators; Agile approaches; flaky tests and related tools; tools that work well remotely; choice of programming languages; outdated tools; separation of personal preferences in tools from those adopted in the company.
F16. Nineteen respondents noted an adequate transfer of knowledge between people. Nine people mentioned the difficulties of communicating with other teams: three - agreeing goals between teams, one - agreeing goals within a large team, the other - reaching an agreement between teams. Two noted the difficulty of coordinating work in an international or time-zone team. Another two mentioned the need to rely on the documentation of other teams. Two commented on the duration of the code review. Two others mentioned the awareness of teammates' work facilities. One mentioned the search for the right person, another - delays in interaction, the third - communication between engineers and specialists in the subject area. Finally, one mentioned the importance of making it clearwhat communication channels are better to use in certain situations.
F18. Two respondents noted approaches to holding meetings, one mentioned that the effectiveness of meetings depends on the availability of meeting rooms.
F19. Twenty-four respondents reported interruptions and distractions from work. Ten mentioned noisy environments, and seven indicated that open offices reduce productivity. Four mentioned difficulties with multitasking and context switching. Another four reported the need to focus either on their main job or on “optional” tasks like interviewing. Two mentioned difficulty concentrating when commuting to and from work.
F25. One respondent noted code reuse, pointing out that 2-3 line APIs increase complexity with minimal contribution to reducing duplication.
F26. One respondent commented on experience with the software platform, indicating that problems get worse when a developer switches between projects.
F27. Three respondents noted software architecture and risk reduction. One pointed out "how well known is the product architecture, how interconnected it is, and how it supports people who know their roles and are able to focus, who know their responsibilities and limitations, and what they own." Another noted that architecture, through modularity, can facilitate the exchange between software components. The third suggested that the architecture should be consistent with the structure of the organization.
F32. Four respondents mentioned the need for context switching. Two mentioned that switching is necessary when moving between projects. One explained that the need for context switching is different from the pleasure of switching. Another mentioned that “productivity projects” in and of themselves can reduce productivity.
F34. Five respondents noted tight deadlines. One pointed out that this contributes to the growth of technical debt, the other - that such deadlines can lead to a waste of resources.
F42. Three respondents noted software limitations. Two pointed to privacy restrictions and one to critical security restrictions.
F44. Eleven respondents noted the complexity of the software. Two mentioned the particular complexity of legacy code, two referred to technical debt, and each noted versioning, software maintenance, and
code understanding.
Coefficients:
Estimate     Std. Error     t value     Pr(>|t|)
(Intercept)             2.786969     0.111805     24.927     < 0.0000000000000002 ***
log(lines_changed + 1)     0.045189     0.009296     4.861         0.00000122 ***
level                 -0.050649     0.015833     -3.199     0.00139 **
job_codeENG_TYPE2         0.194108     0.172096     1.128         0.25944
job_codeENG_TYPE3         0.034189     0.076718     0.446         0.65589
job_codeENG_TYPE4         -0.185930     0.084484     -2.201     0.02782 *
job_codeENG_TYPE5         -0.375294     0.085896     -4.369     0.00001285 ***
---
Signif. codes: 0 `***` 0.001 `**` 0.01 `*` 0.05 `.` 0.1 ` ` 1
Residual standard error: 0.8882 on 3388 degrees of freedom
Multiple R-squared: 0.01874, Adjusted R-squared: 0.017
F-statistic: 10.78 on 6 and 3388 DF, p-value: 0.000000000006508
Figure: 5: Model 1: Complete Linear Regression Results
Coefficients:
Estimate     Std. Error     t value     Pr(>|t|)
(Intercept)                 2.74335     0.09706     28.265     < 0.0000000000000002
log(changelists_created + 1)     0.11220     0.01608     6.977         0.00000000000362
level                     -0.04999     0.01574     -3.176     0.00151
job_codeENG_TYPE2             0.27044     0.17209     1.571         0.11616
job_codeENG_TYPE3             0.02451     0.07644     0.321         0.74847
job_codeENG_TYPE4             -0.21640     0.08411     -2.573     0.01013
job_codeENG_TYPE5             -0.40194     0.08559     -4.696     0.00000275538534
(Intercept)                 ***
log(changelists_created + 1)     ***
level                     **
job_codeENG_TYPE2
job_codeENG_TYPE3
job_codeENG_TYPE4             *
job_codeENG_TYPE5             ***
---
Signif. codes: 0 `***` 0.001 `**` 0.01 `*` 0.05 `.` 0.1 ` ` 1
Residual standard error: 0.885 on 3388 degrees of freedom
Multiple R-squared: 0.02589, Adjusted R-squared: 0.02416
F-statistic: 15.01 on 6 and 3388 DF, p-value: < 0.00000000000000022
Figure: 6: Model 2: Complete Linear Regression Results
Coefficients:
Estimate     Std. Error     t value     Pr(>|t|)
(Intercept)                 2.79676     0.11141     25.102     < 0.0000000000000002
log(lines_changed + 1)         -0.01462     0.01498     -0.976     0.32897
log(changelists_created + 1)     0.13215     0.02600     5.082         0.000000394
level                     -0.05099     0.01578     -3.233     0.00124
job_codeENG_TYPE2             0.27767     0.17226     1.612         0.10706
job_codeENG_TYPE3             0.02226     0.07647     0.291         0.77102
job_codeENG_TYPE4             -0.22446     0.08452     -2.656     0.00795
job_codeENG_TYPE5             -0.40819     0.08583     -4.756     0.000002057
(Intercept)                 ***
log(lines_changed + 1)
log(changelists_created + 1)     ***
level                     **
job_codeENG_TYPE2
job_codeENG_TYPE3
job_codeENG_TYPE4             **
job_codeENG_TYPE5             ***
---
Signif. codes: 0 `***` 0.001 `**` 0.01 `*` 0.05 `.` 0.1 ` ` 1
Residual standard error: 0.885 on 3387 degrees of freedom
Multiple R-squared: 0.02616, Adjusted R-squared: 0.02415
F-statistic: 13 on 7 and 3387 DF, p-value: < 0.00000000000000022
Figure: 7: Model 3: Complete Linear Regression Results.
Bibliography
[1] R. S. Nickerson, “Confirmation bias: A ubiquitous phenomenon in many guises.” Review of general psychology, vol. 2, no. 2, p. 175, 1998.
[2] Y. W. Ramírez and D. A. Nembhard, “Measuring knowledge worker productivity: A taxonomy,” Journal of Intellectual Capital, vol. 5, no. 4, pp. 602–628, 2004.
[3] A. N. Meyer, L. E. Barton, G. C. Murphy, T. Zimmermann, and T. Fritz, “The work life of developers: Activities, switches and perceived productivity,” IEEE Transactions on Software Engineering, 2017.
[4] M. Palvalin, M. Vuolle, A. Jääskeläinen, H. Laihonen, and A. Lönnqvist, “Smartwow–constructing a tool for knowledge work performance analysis,” International Journal of Productivity and Performance Management, vol. 64, no. 4, pp. 479–498, 2015.
[5] C. H. C. Duarte, “Productivity paradoxes revisited,” Empirical Software Engineering, pp. 1–30, 2016.
[6] K. D. Maxwell, L. VanWassenhove, and S. Dutta, “Software development productivity of european space, military, and industrial applications,” IEEE Transactions on Software Engineering, vol. 22, no. 10, pp. 706–718, 1996.
[7] J. D. Blackburn, G. D. Scudder, and L. N. Van Wassenhove, “Improving speed and productivity of software development: a global survey of software developers,” IEEE transactions on software engineering, vol. 22, no. 12, pp. 875–885, 1996.
[8] B. Vasilescu, Y. Yu, H.Wang, P. Devanbu, and V. Filkov, “Quality and productivity outcomes relating to continuous integration in github,” in Proceedings of the 2015 10th Joint Meeting on Foundations of Software Engineering. ACM, 2015, pp. 805–816.
[9] T. Hernaus and J. Mikulic, “Work characteristics and work performance of knowledge workers,” EuroMed Journal of Business, vol. 9, no. 3, pp. 268–292, 2014.
[10] F. P. Morgeson and S. E. Humphrey, “The work design questionnaire (wdq): developing and validating a comprehensive measure for assessing job design and the nature of work.” Journal of applied psychology, vol. 91, no. 6, p. 1321, 2006.
[11] J. R. Idaszak and F. Drasgow, “A revision of the job diagnostic survey: Elimination of a measurement artifact.” Journal of Applied Psychology, vol. 72, no. 1, p. 69, 1987.
[12] M. A. Campion, G. J. Medsker, and A. C. Higgs, “Relations between work group characteristics and effectiveness: Implications for designing effective work groups,” Personnel psychology, vol. 46, no. 4, pp. 823–847, 1993.
[13] T. Hernaus, “Integrating macro-and micro-organizational variables through multilevel approach,” Unpublished doctoral thesis). Zagreb: University of Zagreb, 2010.
[14] S. Wagner and M. Ruhe, “A systematic review of productivity factors in software development,” in Proceedings of 2nd International Workshop on Software Productivity Analysis and Cost Estimation, 2008.
[15] A. N. Meyer, T. Fritz, G. C. Murphy, and T. Zimmermann, “Software developers’ perceptions of productivity,” in Proceedings of the International Symposium on Foundations of Software Engineering. ACM, 2014, pp. 19–29.
[16] R. Antikainen and A. Lönnqvist, “Knowledge work productivity assessment,” Tampere University of Technology, Tech. Rep., 2006.
[17] M. Galesic and M. Bosnjak, “Effects of questionnaire length on participation and indicators of response quality in a web survey,” Public opinion quarterly, vol. 73, no. 2, pp. 349–360, 2009.
[18] L. Beckwith, C. Kissinger, M. Burnett, S. Wiedenbeck, J. Lawrance, A. Blackwell, and C. Cook, “Tinkering and gender in end-user programmers’ debugging,” in Proceedings of the SIGCHI conference on Human Factors in computing systems. ACM, 2006, pp. 231–240.
[19] D. B. Rubin, Multiple imputation for nonresponse in surveys. John Wiley & Sons, 2004, vol. 81.
[20] A. W. Meade and S. B. Craig, “Identifying careless responses in survey data.” Psychological methods, vol. 17, no. 3, p. 437, 2012.
[21] E. Smith, R. Loftin, E. Murphy-Hill, C. Bird, and T. Zimmermann, “Improving developer participation rates in surveys,” in Proceedings of Cooperative and Human Aspects on Software Engineering, 2013.
[22] Y. Benjamini and Y. Hochberg, “Controlling the false discovery rate: a practical and powerful approach to multiple testing,” Journal of the royal statistical society. Series B (Methodological),
pp. 289–300, 1995.
[23] R. A. Guzzo, R. D. Jette, and R. A. Katzell, “The effects of psychologically based intervention programs on worker productivity: A meta-analysis,” Personnel psychology, vol. 38, no. 2, pp.
275–291, 1985.
[24] D. Graziotin, X. Wang, and P. Abrahamsson, “Happy software developers solve problems better: psychological measurements in empirical software engineering,” PeerJ, vol. 2, p. e289, 2014.
[25] J. Noll, M. A. Razzak, and S. Beecham, “Motivation and autonomy in global software development: an empirical study,” in Proceedings of the 21st International Conference on Evaluation
and Assessment in Software Engineering. ACM, 2017, pp. 394–399.
[26] B. Clark, S. Devnani-Chulani, and B. Boehm, “Calibrating the cocomo ii post-architecture model,” in Proceedings of the International Conference on Software Engineering. IEEE, 1998, pp. 477–480.
[27] B. Kitchenham and E. Mendes, “Software productivity measurement using multiple size measures,” IEEE Transactions on Software Engineering, vol. 30, no. 12, pp. 1023–1035, 2004.
[28] S. L. Pfleeger, “Model of software effort and productivity,” Information and Software Technology, vol. 33, no. 3, pp. 224–231, 1991.
[29] G. Finnie and G. Wittig, “Effect of system and team size on 4gl software development productivity,” South African Computer Journal, pp. 18–18, 1994.
[30] D. R. Jeffery, “A software development productivity model for mis environments,” Journal of Systems and Software, vol. 7, no. 2, pp. 115–125, 1987.
[31] L. R. Foulds, M. Quaddus, and M. West, “Structural equation modelling of large-scale information system application development productivity: the hong kong experience,” in Computer and Information Science, 2007. ICIS 2007. 6th IEEE/ACIS International Conference on. IEEE, 2007, pp. 724–731.
[32] C. Parnin and S. Rugaber, “Resumption strategies for interrupted programming tasks,” Software Quality Journal, vol. 19, no. 1, pp. 5–34, 2011.
[33] C. Parnin and R. DeLine, “Evaluating cues for resuming interrupted programming tasks,” in Proceedings of the SIGCHI conference on human factors in computing systems. ACM, 2010, pp. 93–102.
[34] S. Markos and M. S. Sridevi, “Employee engagement: The key to improving performance,” International Journal of Business and Management, vol. 5, no. 12, pp. 89–96, 2010.
[35] W. Snipes, A. R. Nair, and E. Murphy-Hill, “Experiences gamifying developer adoption of practices and tools,” in Companion Proceedings of the 36th International Conference on Software Engineering. ACM, 2014, pp. 105–114.
[36] J. S. Brown and P. Duguid, “Balancing act: How to capture knowledge without killing it.” Harvard business review, vol. 78, no. 3, pp. 73–80, 1999.
[37] M. London and J. W. Smither, “Feedback orientation, feedback culture, and the longitudinal performance management process,” Human Resource Management Review, vol. 12, no. 1,
pp. 81–100, 2002.
[38] T. Savor, M. Douglas, M. Gentili, L. Williams, K. Beck, and M. Stumm, “Continuous deployment at facebook and oanda,” in Proceedings of the 38th International Conference on Software Engineering Companion. ACM, 2016, pp. 21–30.
[39] R. J. Fisher, “Social desirability bias and the validity of indirect questioning,” Journal of consumer research, vol. 20, no. 2, pp. 303–315, 1993.
[40] J. M. Zelenski, S. A. Murphy, and D. A. Jenkins, “The happyproductive worker thesis revisited,” Journal of Happiness Studies, vol. 9, no. 4, pp. 521–537, 2008.
[41] S. Moser and O. Nierstrasz, “The effect of object-oriented frameworks on developer productivity,” Computer, vol. 29, no. 9, pp. 45–51, 1996.
[42] T. DeMarco and T. Lister, “Programmer performance and the effects of the workplace,” in Proceedings of the International Conference on Software Engineering. IEEE Computer Society
Press, 1985, pp. 268–272.
[43] M. Kersten and G. C. Murphy, “Using task context to improve programmer productivity,” in Proceedings of the 14th ACM SIGSOFT international symposium on Foundations of software engineering. ACM, 2006, pp. 1–11.
[44] K. Petersen, “Measuring and predicting software productivity: A systematic map and review,” Information and Software Technology, vol. 53, no. 4, pp. 317–343, 2011.
[45] M. J. Melitz, “The impact of trade on intra-industry reallocations and aggregate industry productivity,” Econometrica, vol. 71, no. 6, pp. 1695–1725, 2003.
[46] M. N. Baily, C. Hulten, D. Campbell, T. Bresnahan, and R. E. Caves, “Productivity dynamics in manufacturing plants,” Brookings papers on economic activity. Microeconomics, vol. 1992, pp. 187–267, 1992.
[47] A. Kidd, “The marks are on the knowledge worker,” in Proceedings of the SIGCHI conference on Human factors in computing systems. ACM, 1994, pp. 186–191.
[48] G. K. Gill and C. F. Kemerer, “Cyclomatic complexity density and software maintenance productivity,” IEEE transactions on software engineering, vol. 17, no. 12, pp. 1284–1288, 1991.