When we were preparing to automate the work of local municipal services, we drew attention to the use of cartography, which we found to be a really powerful and effective tool for solving a wide range of tasks. On the map, you can display up-to-date information about the location of objects, routes of movement of harvesting equipment, transport, a work plan and a heat map with problem and “healthy” areas.
The use of cartography in general helps to speed up the reaction time and decision-making on urgent issues, simplifies the planning and forecasting process, and most importantly, all information is available in the most visual form.
While working with one of the customers, we faced an interesting task - to calculate the number of objects on the map by category.
To find
Determine the “greenest” city in the Central Federal District by the combination of the following data: the number of shops, trash bins and parks.
Given
Cartography. We chose OpenStreetMap (hereinafter - OSM ) as a springboard for a very simple reason - Open Source.
Decision
There are several approaches to solving this problem. For example, we can use PostgreSQL to query the OSM database and retrieve the required data, or use QGIS, a system for creating, analyzing and publishing geospatial information. However, we found a more elegant and efficient way - Overpass API .
Overpass API is a powerful tool for extracting data from OSM database at user request. It is optimized for tasks of any scale: from retrieving several elements from a database to hundreds of millions of objects that are selected according to the request in the form of XML or Overpass QL - an upgraded version of Overpass XML. Read more about the Overpass API here .Let's start from scratch: first of all, you need to deploy OSM on the server. Ubuntu is used as the operating system on our machine.
Q: Why deploy your OSM?
A: To work with data, we need the Overpass API, whose public server has a limit on the number of requests per day. It is for this reason that we will deploy our server with OSM
Detailed instructions for installing OSM are here .The next step is to install the Overpass API - its latest release can be found here .
sudo apt-get update
sudo apt-get install g++ make expat libexpat1-dev zlib1g-dev apache2 -y
wget http://dev.overpass-api.de/releases/osm-3s_.tar.gz
tar -zxvf osm-3s_.tar.gz
cd osm-3s_
./configure CXXFLAGS="-O2" --prefix=$EXEC_DIR
make install
cd ../
chmod -R 755 ./overpass
After installation, you will need to populating - creating a database. We do not need a database of the whole world, so we will use the Geofabrik service , which allows us to get data for the specified administrative regions.
A worthy alternative to Geofabrik is BBBike .
We download and unpack the database downloaded from the Europe> Russian Federation> Central Federal District directory in the .osm.bz2 format, as follows:
PATH_TO_INIT_OSM3S.SH PATH_TO_FILE_BZ2 PATH_WERE_Unpack_OVERPASS_API DIRECTORY
Note: in this case, all actions are performed in the overpass directory .
So, the platform is almost ready - now we can make our first request and find out the number of parks in the whole region.
PATH_TO_OSM3S_QUERY --db-dir = PATH_To_DB
Our request and response looks like this:
root@MIP-USER55:~# cd overpass/
root@MIP-USER55:~/overpass# ./osm-3s_v0.7.56.7/bin/osm3s_query --db-dir=db
encoding remark: Please enter your query and terminate it with CTRL+D.
[out:json][timeout:25];
(
nwr["landuse"="forest"];
);
out count;
{
  ...,
  "elements": [

{
  "type": "count",
  "id": 0,
  "tags": {
    "nodes": "23",
    "ways": "19723",
    "relations": "4206",
    "total": "23952"
  }
}

  ]
}
We are already close: all that remains is to split the parks by regions and cities. A separately running and constantly running Dispatcher will help us to cope with this task .
We launch the API and add Listen PORT in the /etc/apache2/ports.conf directory .
echo "_ localhost" | sudo tee /etc/apache2/conf-available/_.conf && sudo a2enconf _

sudo iptables -A INPUT -m state --state NEW -m tcp -p tcp --dport  -j ACCEPT
sudo a2enmod cgi
sudo a2enmod ext_filter
sudo cp /etc/apache2/sites-available/000-default.conf /etc/apache2/sites-available/___.conf
Checking the configuration. It should look like this.
<VirtualHost *:>
   ServerAdmin webmaster@localhost
   ExtFilterDefine gzip mode=output cmd=/bin/gzip

   DocumentRoot __OVERPASS_API/html

   ScriptAlias /api/ __OVERPASS_API/cgi-bin/

   <Directory "__OVERPASS_API">
      AllowOverride None
      Options Indexes FollowSymLinks
      Require all granted
   </Directory>

   <Directory "__OVERPASS_API/cgi-bin/">
      AllowOverride None
      Options +ExecCGI -MultiViews +SymLinksIfOwnerMatch
      Require all granted
   </Directory>

   ErrorLog ${APACHE_LOG_DIR}/error.log
   CustomLog ${APACHE_LOG_DIR}/access.log combined
</VirtualHost>
Next, we turn on the new host and send the old one to rest.
sudo a2ensite .conf
sudo a2dissite 000-default.conf
sudo a2dissite __.conf
sudo service apache2 reload
Now is the time to enable the first Dispatcher that will handle our requests. To do this, we will use the command.
nohup __OVERPASS_API/bin/dispatcher --osm-base --db-dir=__DB --meta &The first sign that everything went according to plan is the creation of the
osm3s_OVERPASS_API_VERSION_osm_base file in the database directory. The nohup.out file displays a status message Dispatcher - dispatcher just started .
However, the work does not end there: you need to start another Dispatcher. First, copy the rules folder to the directory with the database and distribute the rights to the resulting osm3s_OVERPASS_API_VERSION_areas .
nohup __OVERPASS_API/bin/dispatcher --areas --db-dir=__DB &

chmod 666 "../db/osm3s_OVERPASS_API__areas"
nohup __OVERPASS_API/bin/rules_loop.sh __DB &
Now we can make a request for the region and calculate the number of parks in Ryazan. And by the way, this already works in the address bar of the browser.
http://localhost:/api/interpreter?data=[output:json][timeout:25]; area[name=""]->.searchArea; ( nwr["leisure"="park"](area.searchArea); ); out count;Long awaited answer!
"elements": [

{
  "type": "count",
  "id": 0,
  "tags": {
    "nodes": "0",
    "ways": "57",
    "relations": "11",
    "areas": "0",
    "total": "68"
  }
}

  ]
}
So, now we can dive into analytics and improvement issues: we will find the number of parks, shops and trash cans in 25 major cities of the Central Federal District and compare these indicators using the analytical tools of the ODANT platform .
ODANT is a Russian -made digital integration platform designed for building information systems of varying complexity and distribution. Read more about ODANT here .This is how our parameters for searching for waste bins look like: within the framework of the task, we do not distinguish between container sites, free-standing waste bins and solid waste collection points.
nwr["amenity"="recycling"](area.searchArea);
nwr["amenity"="waste_disposal"](area.searchArea);
nwr["amenity"="waste_basket"](area.searchArea);
We exported the output from ODANT as a flat table.
City |
Urns |
Population |
Population / Urns |
Vladimir |
1525 |
356937 |
234 |
Krasnogorsk |
274 |
175554 |
641 |
Kaluga |
376 |
332039 |
883 |
Tambov |
279 |
292140 |
1047 |
Moscow |
11473 |
12678079 |
1105 |
Kolomna |
111 |
140129 |
1262 |
Balashikha |
378 |
507366 |
1342 |
Kursk |
336 |
452976 |
1348 |
Rybinsk |
129 |
184635 |
1431 |
Mytishchi |
140 |
235504 |
1682 |
Lyubertsy |
119 |
205295 |
1725 |
Zelenograd |
140 |
250453 |
1789 |
Voronezh |
544 |
1058261 |
1945 |
Tver |
225 |
449507 |
1998 |
Yaroslavl |
273 |
608353 |
2228 |
Murom |
43 |
106984 |
2488 |
Podolsk |
114 |
308130 |
2703 |
Khimki |
89 |
259550 |
2916 |
Kostroma |
72 |
276929 |
3846 |
Lipetsk |
124 |
509420 |
4108 |
Ryazan |
118 |
539290 |
4570 |
Korolev |
49 |
224348 |
4579 |
Tula |
101 |
475161 |
4705 |
Elektrostal |
32 |
156026 |
4876 |
In this rating, the city of Vladimir occupies the honorable first line: there are only 234 people for one place of garbage accumulation. Using the built-in ODANT tools, we build two interesting charts.


Let's move on to the next element - benches.
nwr["amenity"="bench"](area.searchArea);We get the following result in the form of a table.
City |
Benches |
Population |
Population / shops |
Vladimir |
593 |
356937 |
602 |
Tambov |
413 |
292140 |
707 |
Moscow |
13970 |
12678079 |
908 |
Krasnogorsk |
143 |
175554 |
1228 |
Balashikha |
411 |
507366 |
1234 |
Zelenograd |
185 |
250453 |
1354 |
Tver |
268 |
449507 |
1677 |
Lyubertsy |
115 |
205295 |
1785 |
Kaluga |
176 |
332039 |
1887 |
Kursk |
214 |
452976 |
2117 |
Murom |
42 |
106984 |
2547 |
|
|
172 |
475161 |
2763 |
|
|
49 |
140129 |
2860 |
|
|
272 |
848752 |
3120 |
|
|
79 |
308130 |
3900 |
|
|
132 |
539290 |
4086 |
|
|
61 |
276929 |
4540 |
|
|
43 |
259550 |
6036 |
|
|
25 |
184635 |
7385 |
|
|
78 |
608353 |
7799 |
|
|
55 |
509420 |
9262 |
|
|
16 |
156026 |
9752 |
|
|
23 |
224348 |
9754 |
|
|
17 |
235504 |
13853 |
And again Vladimir turned out to be the most comfortable of all the contenders: it will not be possible to put 602 people on one bench, but in Mytishchi a much fierce struggle is going on for places. However, you can always come up with a schedule.
We visualize our results.


Let's move on to the most interesting part: calculating the area of parks. We can use several methods to solve this problem, but the most open source and wonderful we find is the Leaflet library . In the query itself, you need to replace out count with out geom, which will give us the coordinates of the regions as a result.
Leaflet is an open source JavaScript library for displaying maps on websites. Supports most mobile and desktop platforms that support HTML5 and CSS3. Leaflet allows a developer unfamiliar with GIS to easily display raster maps made up of small tiles, possibly with additional layers overlaid on top of the main one. Read more about Leaflet here .
Let's create a polygon.
const polygon = L.polygon().addTo(map);
const area = L.GeometryUtil.geodesicArea(polygon.getLatLngs());
Now the area contains the area of the region in m2. We extract the data for the cities we selected and get the following table.
City |
Total park area (km2) |
City area (km2) |
Percentage of space occupied by parks |
Qty parks |
Zelenograd |
4.13 |
37.199 |
0.111 |
26 |
Kaluga |
12.60 |
168.8 |
0.075 |
140 |
Moscow |
121.75 |
2561.5 |
0.048 |
1469 |
Lyubertsy |
0.60 |
12.87 |
0.047 |
28 |
Vladimir |
4.62 |
137.14 |
0.034 |
104 |
Khimki |
3.55 |
109.8 |
0.032 |
27 |
Podolsk |
1.29 |
40.39 |
0.032 |
53 |
Balashikha |
1.78 |
62.8 |
0.028 |
55 |
Tambov |
2.71 |
96.58 |
0.028 |
140 |
Tula |
4.09 |
145.8 |
0.028 |
102 |
Kostroma |
3.95 |
144.5 |
0.027 |
50 |
Krasnogorsk |
0.69 |
25.65 |
0.027 |
21 |
Ryazan |
4.32 |
224.163 |
0.019 |
96 |
Yaroslavl |
3.68 |
205.8 |
0.018 |
176 |
Korolev |
0.97 |
55.47 |
0.017 |
thirty |
Kursk |
3.31 |
208.2 |
0.016 |
862 |
Kolomna |
1.03 |
65.1 |
0.016 |
21 |
Mytishchi |
0.53 |
34.59 |
0.015 |
thirty |
Voronezh |
8.25 |
596.51 |
0.014 |
414 |
Lipetsk |
4.44 |
330.15 |
0.013 |
78 |
Tver |
1.38 |
152.22 |
0.009 |
129 |
Murom |
0.33 |
43.78 |
0.008 |
eleven |
Rybinsk |
0.65 |
101.42 |
0.006 |
62 |
Elektrostal |
0.25 |
51.45 |
0.005 |
52 |
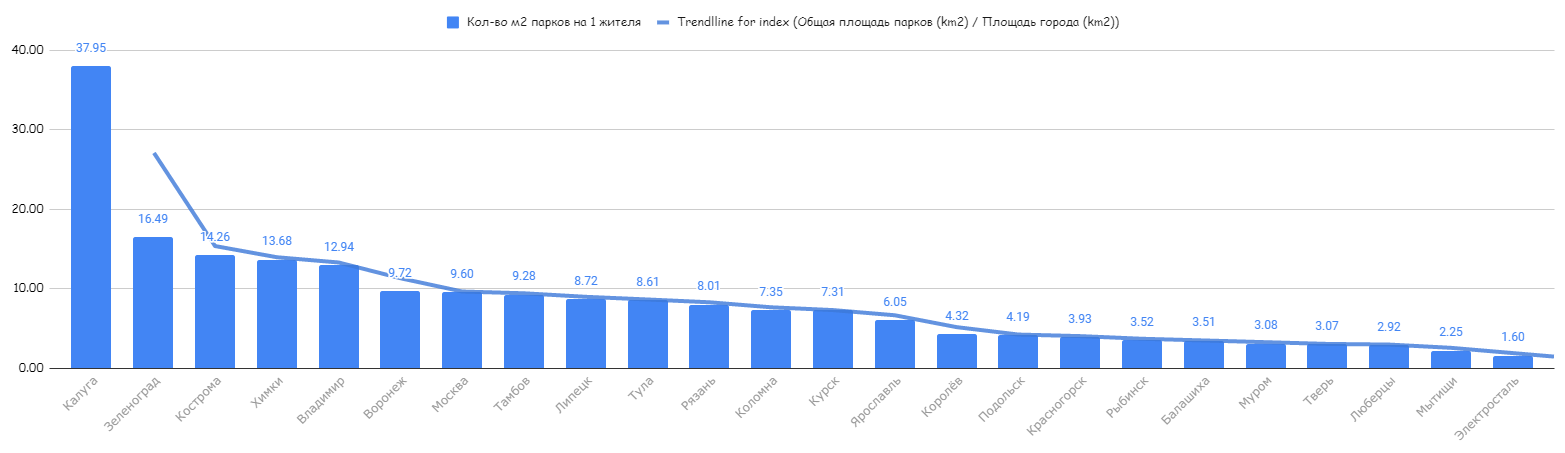
According to OSM, Zelenograd fully justifies its name - 11% of the city's area is occupied by green areas. Let's get the ratio of the number of residents to the number of parks.
City |
Total park area (m2) |
Number of m2 parks per resident |
Number of inhabitants per 1 park |
Kaluga |
12,600,000 |
37.95 |
2372 |
Zelenograd |
4,130,000 |
16.49 |
9633 |
Kostroma |
3,950,000 |
14.26 |
5539 |
Khimki |
3,550,000 |
13.68 |
9613 |
Vladimir |
4,620,000 |
12.94 |
3432 |
Voronezh |
8,250,000 |
9.72 |
2050 |
Moscow |
121,750,000 |
9.60 |
8630 |
Tambov |
2,710,000 |
9.28 |
2087 |
Lipetsk |
4,440,000 |
8.72 |
6531 |
Tula |
4,090,000 |
8.61 |
4658 |
Ryazan |
4,320,000 |
8.01 |
5618 |
Kolomna |
1,030,000 |
7.35 |
6673 |
Kursk |
3,310,000 |
7.31 |
525 |
Yaroslavl |
3,680,000 |
6.05 |
3457 |
Korolev |
970,000 |
4.32 |
7478 |
Podolsk |
1,290,000 |
4.19 |
5814 |
Krasnogorsk |
690,000 |
3.93 |
8360 |
Rybinsk |
650,000 |
3.52 |
2978 |
Balashikha |
1,780,000 |
3.51 |
9225 |
Murom |
330,000 |
3.08 |
9726 |
Tver |
1,380,000 |
3.07 |
3485 |
Lyubertsy |
600,000 |
2.92 |
7332 |
Mytishchi |
530,000 |
2.25 |
7850 |
Elektrostal |
250,000 |
1.60 |
3001 |
Let's present the data in the form of graphs.

And in the final - the rating of cities, calculated by the places occupied.
City |
Rating |
A place |
Vladimir |
12 |
1 |
Kaluga |
fifteen |
2 |
Moscow |
eighteen |
3 |
Zelenograd |
21 |
4 |
Tambov |
23 |
five |
Krasnogorsk |
35 |
6 |
Balashikha |
39 |
7 |
Lyubertsy |
45 |
8 |
Khimki |
46 |
nine |
Kursk |
47 |
ten |
Kolomna |
48 |
eleven |
Kostroma |
50 |
12 |
Voronezh |
52 |
thirteen |
Podolsk |
55 |
fourteen |
Tula |
55 |
fifteen |
Ryazan |
61 |
sixteen |
Tver |
63 |
17 |
Yaroslavl |
63 |
eighteen |
Murom |
69 |
19 |
Rybinsk |
69 |
20 |
Lipetsk |
70 |
21 |
Korolev |
75 |
22 |
Mytishchi |
75 |
23 |
Elektrostal |
94 |
24 |
Epilogue and conclusions
By the decision of the panel of judges consisting of OpenStreetMap, Overpass API and ODANT,
Vladimir takes the honorable first place and receives the title “The Greenest in the Central Federal District”.
It is worth noting the following fact: our research was based solely on the data reflected in the OSM. Naturally, there are a couple of hundred benches in Mytishchi, and in Tula there are much more places for waste accumulation. Our results can be viewed from the other side, for example, to assess the dynamics of adding urban infrastructure objects to the OSM database. However, on average, people are “equally slow” to enter data into OSM, so we can assume that the data is relatively reliable and worth considering.
We managed to solve the problem and find an effective way to work with objects on OSM maps: it turned out to be a combination of Overpass API and Leaflet. With the help of this set of tools, we can make queries to the OSM database and receive data on the number of objects, calculate the areas of areas. For data presentation and analytics, we put together a web-based solution based on ODANT that met all our needs.
There are a large number of industries, business and economy, which could be helped by this solution. If you have any ideas or feedback, it would be very nice to discuss. We spent 28 clean hours on the task, you may be able to do it faster.
Lead Frontend Developer, Infostandard - Daniel Epifanov.
Editor, Infostandard - Nikita Morozov.