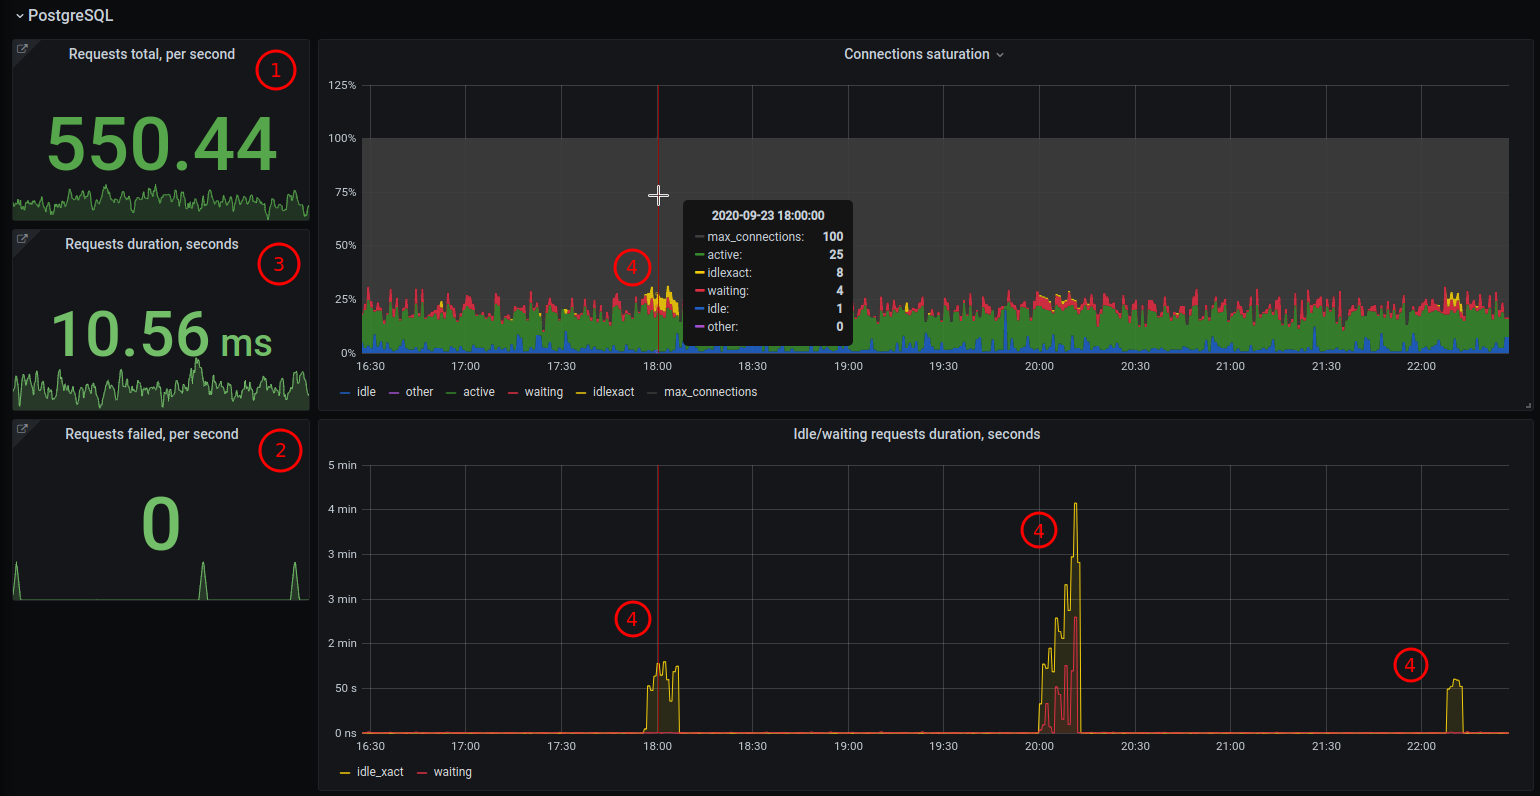
Observation methods Golden Signals and RED are templates for building service monitoring and define the key metrics that are needed for monitoring. Previously, only monitoring administrators or SRE engineers knew about these methods. Now the topic of application instrumentation is no longer something new and more or less everyone knows about these methods.
In this post I will discuss how to cover PostgreSQL in monitoring using the RED and Golden Signals methods. The monitoring subsystem in Postgres was implemented in the days when RED and Golden Signals did not exist yet, and in my humble opinion there are some drawbacks in it, and it may seem like a daunting task to put RED or Golden Signals on Postgres right away. In this post I will try to briefly review the possibilities that Postgres provides for implementing observation using the RED / Golden Signals methods and will give specific directions for implementing this. Plus, it's not as difficult as you might think.
I have been familiar with RED and Golden Signals for a relatively long time and there are several reasons why you should use these methods:
monitoring using these methods allows you to quickly (but superficially) determine whether everything is in order with the service.
if there is a wide coverage of other metrics, while investigating the problem, you can go deeper in the right direction, excluding less important ones.
they are more or less universal and applicable to both web services and system services that are not focused on direct work with the user.
are a good start to cover the basic monitoring needs of any service.
In general, if you have an incomprehensible service in front of you that needs to be monitored, then we just take RED or Golden Signals and, as per the list, set up the collection of the necessary information and the return of metrics. At the output, we get a basic minimum (in the form of a dashboard) which, in general, gives a sufficient idea of whether the service is working well or poorly. Further, it is already possible to implement more detailed or service-specific things. However, these methods also have drawbacks, so you shouldn't think that these methods will cover all possible needs for metrics.
Well I hope it turned out convincingly, let's move on to Postgres.
The essence of RED and Golden Signals is to measure the quantitative characteristics of traffic passing through the service, for example, RED is:
Request rate - the number of requests per second.
Request errors - number of erroneous requests per second.
Request duration - ( ).
Golden Signals ( ), (Latency, Traffic, Errors), Saturation - , , .
HTTP (), - , . (Requests), (Errors), (Duration), (Saturation).
. , "". SQL- SQL-? SQL-, .. , 1 = 1 SQL-. RED SQL- (request_id, , / ..).
Requests
, R - requests. , - . Postgres (views). .
pg_stat_statements. . per-statement , statement () calls . calls . pg_stat_statements .
pg_stat_statements . - pg_stat_statements.track . 2 . "top" . "all" . "top", .. , , .
pg_stat_statements.
SELECT sum(calls) FROM pg_stat_statements;. Prometheus, , Zabbix UserParameter.
pg_stat_activity pg_stat_database. , pg_stat_activity , .. (snapshot) , . xact_commit, .. . , .
Errors
" " pg_stat_database. xact_rollback . - , . . , SQL- ( BEGIN .. END) xact_rollback. xact_rollback .
SQL.
SELECT sum(xact_rollback) FROM pg_stat_database;, . , . , . Postgres .
Duration
pg_stat_statements total_time. ( ) . total_time .
SELECT sum(total_time) FROM pg_stat_statements;, , .. Prometheus . , pg_stat_statements . total_time min_time, max_time, mean_time, stddev_time. 13 . DBA-specific , - .
Saturation
(saturation), RED , Golden Signals. ( ) , ( ).
max_connections. , . , : 1) idle 2) - tps . , : , ( ), . . , max_connections, . .
pg_stat_activity. , , .
?
(COUNTER) . " " ( , - ). . pg_stat_activity GAUGES () . . - OLTP , / GAUGE . GAUGES.
GAUGE, . , . :
(active, idle in transaction, waiting).
SELECT
	count(*) FILTER (WHERE state IS NOT NULL) AS total,
	count(*) FILTER (WHERE state = 'idle') AS idle,
	count(*) FILTER (WHERE state IN ('idle in transaction', 'idle in transaction (aborted)')) AS idle_in_xact,
	count(*) FILTER (WHERE state = 'active') AS active,
	count(*) FILTER (WHERE wait_event_type = 'Lock') AS waiting,
	count(*) FILTER (WHERE state IN ('fastpath function call','disabled')) AS others
FROM pg_stat_activity WHERE backend_type = 'client backend';
. xact_start - , state_change - - active .
.
SELECT coalesce(max(extract(epoch FROM clock_timestamp() - xact_start)),0) AS max_idle_seconds
FROM pg_stat_activity
WHERE state IN ('idle in transaction', 'idle in transaction (aborted)');
.
SELECT coalesce(max(extract(epoch FROM clock_timestamp() - state_change)),0) AS max_idle_seconds
FROM pg_stat_activity
WHERE wait_event_type = 'Lock';
, . . :
idle in transactions waiting .
idle .
.
Postgres' RED Golden Signals SQL . , , . , request rate pg_stat_statements.calls. Request errors pg_stat_database.xact_rollback. Request duration pg_stat_statements.total_time. Saturation state, wait_event_type, xact_start, state_change pg_stat_activity.
6 , - drilldown- /. Postgres'.

?
- .
Weaponry Postgres , idle , Weaponry .
- -Postgres', .