
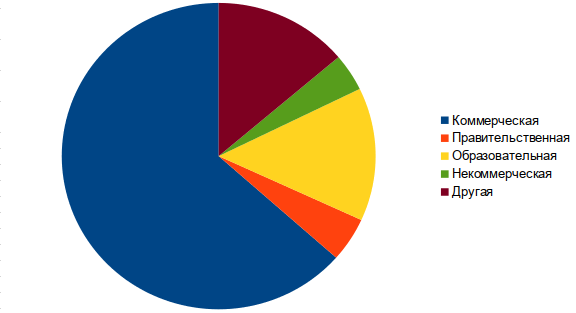
What type of organization do you have?
Answered question: 405
Skipped question: 0
| Answer | Answered | % |
|---|---|---|
| a commercial | 257 | 63.46 |
| Government | 19 | 4.69 |
| Military | 0 | 0 |
| Educational | 57 | 14.07 |
| Non-profit | sixteen | 3.95 |
| Other | 56 | 13.82 |
Why are you using Ceph?
Answered question: 405
Skipped question: 0
| Answer | Answered | % |
|---|---|---|
| Open source | 367 | 90.62 |
| Scalability | 326 | 80.49 |
| The cost | 247 | 60.99 |
| Functional | 223 | 55.06 |
| fault tolerance | 309 | 76.30 |
| Reliability \ survivability \ data integrity | 279 | 68.89 |
| Performance | 125 | 30.86 |
| Possibility of implementation with related technologies | 120 | 29.63 |
| Other | thirteen | 3.21 |

How long have you been using Ceph?
Answered question: 405
Skipped question: 0
| Answer | Answered | % |
|---|---|---|
| Less than a year | 72 | 17.78 |
| 1-2 years | 65 | 16.05 |
| 2-5 years | 203 | 50.12 |
| More than 5 years | 58 | 14.32 |
| Do not use | 7 | 1.73 |

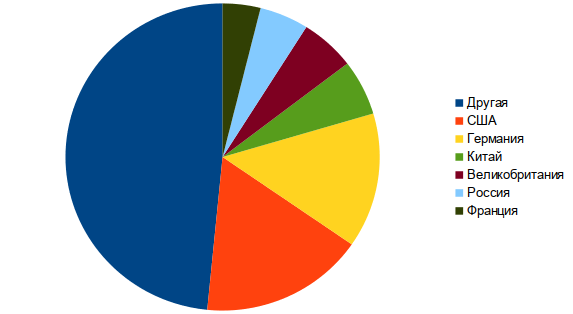
In which countries do you have Ceph deployed?
Answered question: 405
Skipped question: 0
| Answer | Answered | % |
|---|---|---|
| Other | 249 | 61.48 |
| USA | 87 | 21.48 |
| Germany | 73 | 18.02 |
| China | thirty | 7.41 |
| Great Britain | 29 | 7.16 |
| Russia | 26 | 6.42 |
| France | 20 | 4.94 |
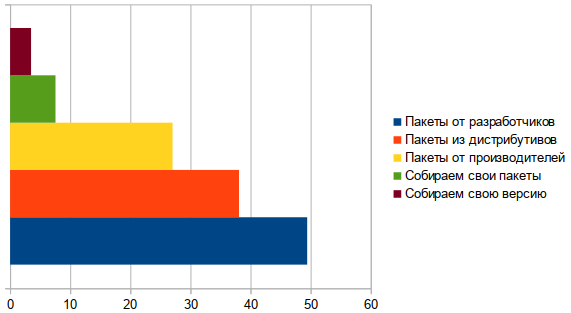
How do you install Ceph?
Answered question: 344
Omitted question: 61
| Answer | Answered | % |
|---|---|---|
| Developer packages | 170 | 49.42 |
| Packages from distributions | 131 | 38.08 |
| Packages from manufacturers | 93 | 27.03 |
| We collect our packages | 26 | 7.56 |
| Putting together our version | 12 | 3.49 |
NB If you are still floating around a bit about how to install and deploy Ceph correctly, a Ceph course from practitioners will be launched on October 15th . You will initially acquire system knowledge of basic concepts and terms, and upon completion of the course, you will learn how to fully install, configure and manage Ceph.
How do you deploy?
Answered question: 312
Omitted question: 93
| Answer | Answered | % |
|---|---|---|
| Ansible | 134 | 42.95 |
| ceph-deploy | 133 | 42.63 |
| Other (here Proxmox + CLI) | 75 | 04.24 |

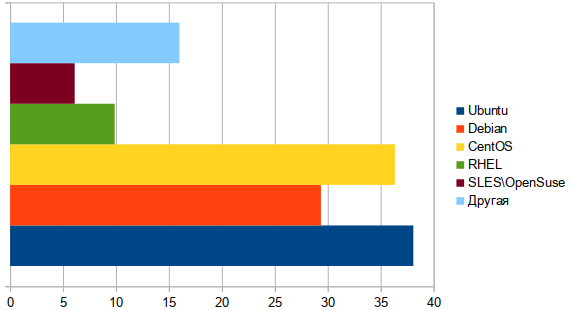
Operating system used
Answered question: 344
Omitted question: 61
| Answer | Answered | % |
|---|---|---|
| Ubuntu | 131 | 38.08 |
| Debian | 101 | 29.36 |
| CentOS | 125 | 36.34 |
| RHEL | 34 | 9.88 |
| SLES \ OpenSuse | 21 | 6.10 |
| Other | 55 | 15.99 |
What equipment do you use?
Answered question: 343
Skipped question: 62
| Answer | Answered | % |
|---|---|---|
| Supermicro | 171 | 50.00 |
| Dell | 131 | 38.30 |
| HPE | 89 | 26.02 |
| Other | 162 | 47.23 |

What drives do you use?
Answered question: 342
Omitted question: 63
| Answer | Answered | % |
|---|---|---|
| HDD | 305 | 89.18 |
| SSD (SAS, SATA) | 261 | 76.32 |
| NVMe | 161 | 47.08 |
| Others | 21 | 6.14 |

Are you using a separate network for OSD?
Answered question: 342
Omitted question: 63
| Answer | Answered | % |
|---|---|---|
| Yes | 249 | 72.81 |
| No | 93 | 27.19 |
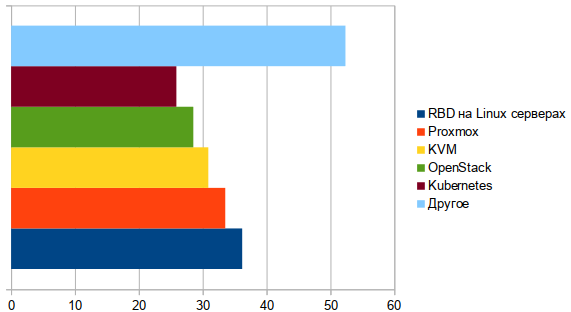
What software do you use with Ceph?
Answered question: 340
Missed question: 65
| Answer | Answered | % |
|---|---|---|
| RBD on Linux servers | 123 | 36.18 |
| Proxmox | 114 | 33.53 |
| KVM | 105 | 30.88 |
| Openstack | 97 | 28.53 |
| Kubernetes | 88 | 25.88 |
| Other | 178 | 52.35 |
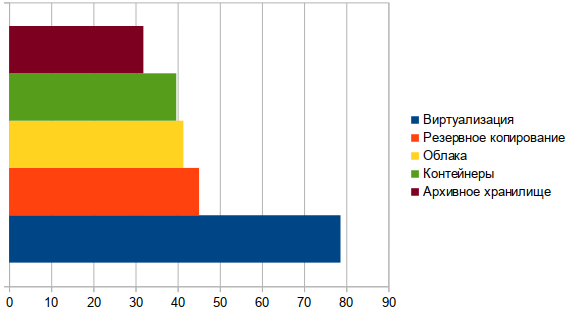
What are you using RBD for?
Answered question: 295
Skipped question: 110
| Answer | Answered | % |
|---|---|---|
| Virtualization | 232 | 78.64 |
| Backup | 133 | 45.08 |
| The clouds | 122 | 41.36 |
| Containers | 117 | 39.66 |
| Archive storage | 94 | 31.86 |
What are you using RGW for?
Answered question: 163
Omitted question: 242
| Answer | Answered | % |
|---|---|---|
| Archival storage | 105 | 64.42 |
| Backup | 92 | 56.44 |
| Big data and analytics | 61 | 37.42 |

What are you using CephFS for?
Answered question: 184
Skipped question: 221
| Answer | Answered | % |
|---|---|---|
| General purpose NAS | 98 | 53.26 |
| Backup | 87 | 47.28 |
| Home directories | 63 | 34.24 |
| Archival storage | 54 | 29.35 |
| Media \ Streaming | 44 | 23.91 |

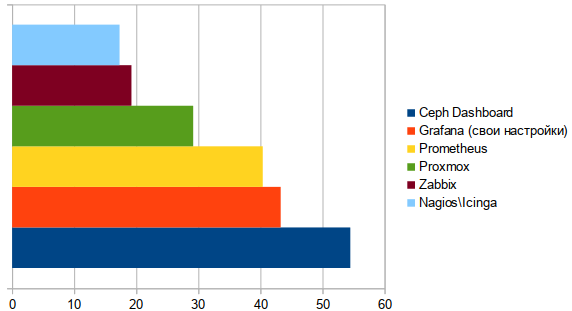
What kind of monitoring do you use?
Answered question: 312
Omitted question: 93
| Answer | Answered | % |
|---|---|---|
| Ceph Dashboard | 170 | 54.49 |
| Grafana (custom settings) | 135 | 43.27 |
| Prometheus | 126 | 40.38 |
| Proxmox | 91 | 29.17 |
| Zabbix | 60 | 19.23 |
| Nagios \ Icinga | 54 | 17.31 |
NB If there is a need to tighten up, or even learn the correct logging and monitoring, welcome to the Monitoring and Logging Infrastructure in Kubernetes course . The course is now available at a substantial discount. On the course, you will learn what exactly to monitor, what metrics to collect and how to set up alerts to quickly find and fix problems in the cluster. What metrics should you collect with Prometheus? How to visualize monitoring using Grafana and how to correctly configure alerts?The data for the graphs is taken from here .