
Every second a lot of physical and chemical processes take place around us, which are extremely difficult to record. The complexity lies not only in the dimensions of the objects involved, but also in the speed of the processes themselves. High-speed shooting plays an important role in modern research, allowing you to capture ultra-fast dynamic phenomena. But even this technology has its limit, which can be exaggeratedly indicated by frames per second. Scientists from the University of Shenzhen (China) were able to create an exclusively optical system capable of reaching 15 trillion frames per second. What techniques and phenomena were used in this development, what practical experiments showed, and where can this creation find its application? We will find answers to these questions in the report of scientists. Go.
Research basis
High-speed imaging is an essential tool for studying such fast dynamic processes as femtosecond laser ablation, laser filament propagation, molecular dynamics, interaction of shock waves in living cells, etc.
As expected, ultra-fast optical imaging, which can provide blur-free visualization of transients, is a desirable tool for scientists from a wide variety of fields of science (chemistry, physics, optical engineering, materials science, biomedicine, etc.).
At the moment, there are already a number of techniques that make it possible to achieve quite good results in the field of optical imaging. For example, time-resolved imaging, based on pumping and sensing techniques, does an excellent job of reproducible transient dynamics with high repetition rates. However, this technique loses its advantage when working with processes that have a low repetition rate or do not repeat at all.
The pump-sensing method can be replaced with a single optical imaging. Some works even managed to reach 25 million frames per second (Mfps). And here's a compressed ultrafast photo (CUP by compressed ultrafast photography) May operate at a frame rate of 0.1 frames per second trillion (Tfps) with a time resolution of about 50 ps by applying the algorithm based on the algorithm of compression sensing * ( compressive sensing ).
Compression sensing (compressive sensing) * is a technique for obtaining and restoring a signal by knowing about its previous values, which are rarefied or compressed.The spatial resolution of this method can be scaled up to 7 lp / mm (pairs of lines per millimeter, hereinafter - lp / mm). If you add a 20x lens, you get a phase-sensitive compressed ultrafast photograph (pCUP), capable of delivering a spatial resolution of a few micrometers and an imaging speed of 1 Tfps.
This technique can achieve good spatial resolution, which cannot be said about temporal resolution. Therefore, a method is needed that can combine the strengths of the above methods together.
On assurance of the scientists, a great candidate for this role is suitable optical parametric amplification (OPA by optical parametric amplification). By applying OPA to an optical image, the information contained in the signal can be copied to a blank image. This feature has inspired scientists to create a new method of one-shot ultrafast optical imaging, called non-collinear optical parametric amplification imaging (FINCOPA from framing imaging based on noncollinear optical parametric amplification ; NCOPA from noncollinear optical parametric amplification ).
The non-collinear device allows converting information in successive frames into spatially separated blank images using multi-stage optical parametric amplifiers pumped by a series of laser pulses.
This all-optical method also avoids any bottlenecks associated with active mechanical and electronic components for fast scanning, which is critical for high frame rates.
How FINCOPA works
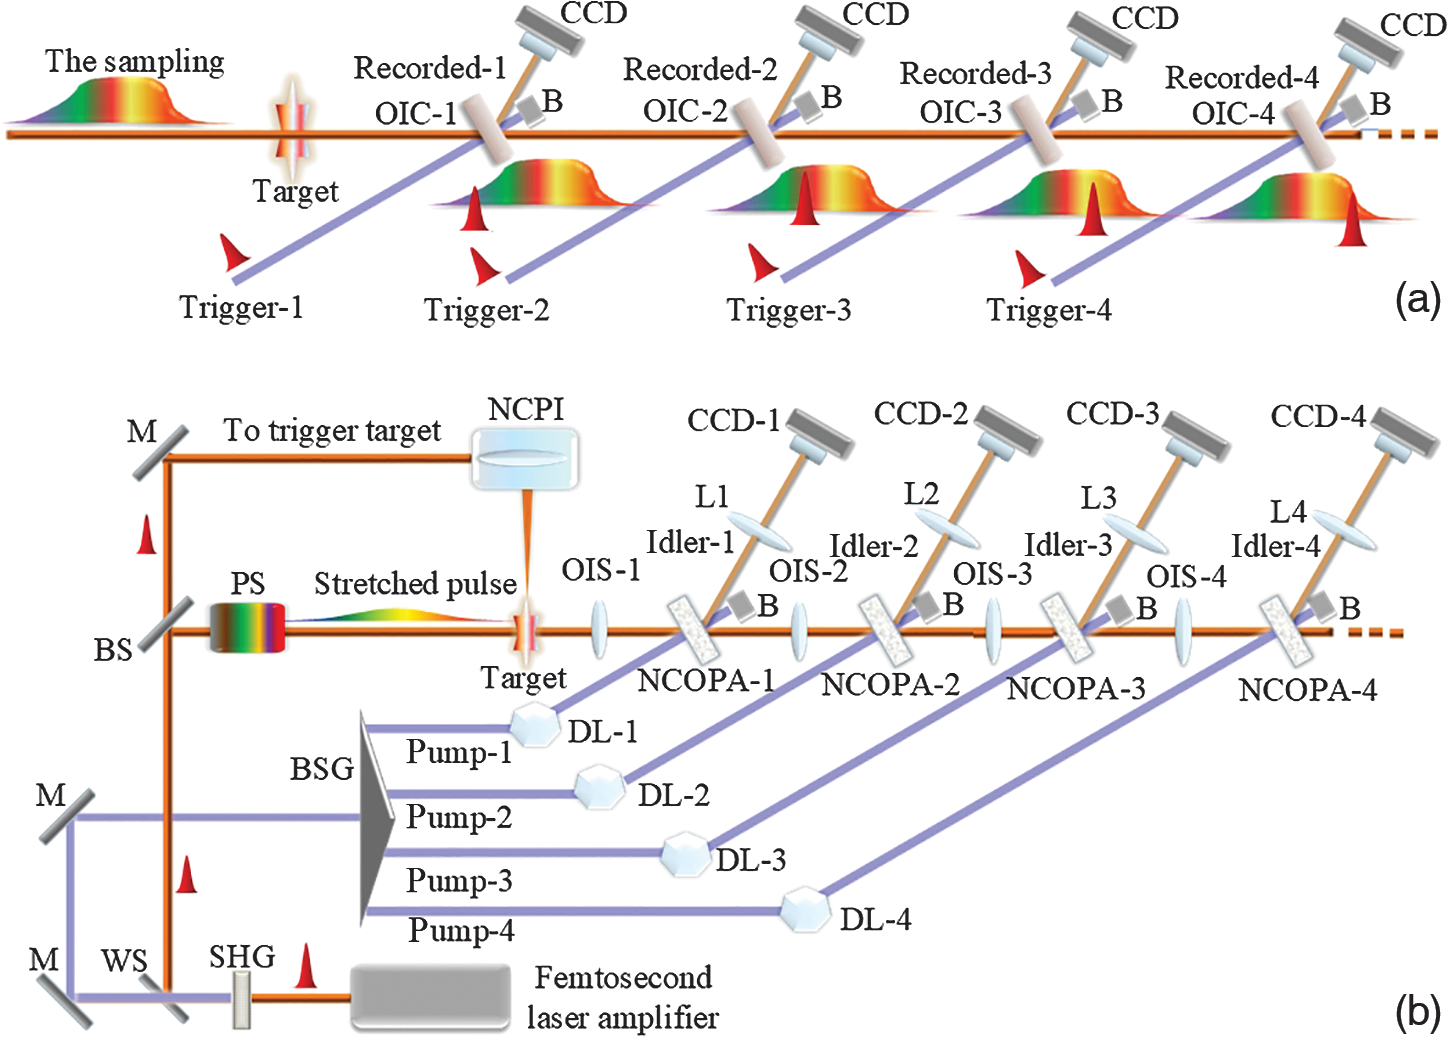
Image # 1
The diagram above is an illustration of the FINCOPA system. A sampling pulse with a sufficiently large temporal width was used to capture all information in the target transient. In addition, a sequence of ultrashort pulses (labeled trigger-1, 2, 3, and 4) was used to trigger and switch image information from different time slices of the sample pulse to a different sequence of ultrashort pulses (labeled recorded-1, 2, 3 and 4 ) using cascade optical image converters. Since the recorded images are spatially separated from each other, they can be received by different CCD (CCD from Charge Coupled Device ) cameras.
Frame intervals are determined by the relative delays between the sample pulse and the trigger pulses, while the exposure time of images can be estimated using the duration of the trigger pulses. Thus, the exposure time, effective frame rate and frame number are independent of each other.
To implement this idea, a femtosecond laser system with a femtosecond time resolution is needed. As the scientists note, accurate time synchronization between the trigger pulses and the sampling pulse is extremely important here. This was achieved by obtaining both a sampling pulse and trigger pulses from the same laser source, which reduces the time fluctuations between synchronized pulses to several femtoseconds. The frame number (N) is determined by the ratio of the total available trigger pulse power to the power required to trigger each optical image converter.
OPA can display signal information in an idle image, so optical parametric amplifiers can serve as image converters. In addition, the use of ultra-short pulses as pumping for OPA means short exposure times in OPA imaging, i.e. high temporal resolution.
In an optical parametric amplifier, OPA occurs only during the interaction between pump and signal, which means that the image information is displayed at idle only under the action of the pump. The pump has a much shorter pulse width than the signal, so it can act as an optical shutter. The shutter speed can be estimated from the duration of the pump pulse, and the temporal resolution is mainly determined by the duration of the idle pulse. Both durations will be equal to each other if the thickness of the OPA crystals is thin enough to suppress the timing deviation between the signal and pump pulses.
In addition, the ultra-short pump pulse duration contributes to high pump intensity (e.g.> 100 GW / cm 2), which also has a positive effect on the OPA gain and will allow achieving a large space-time bandwidth.
In other words, the pumping rate for the OPA is determined by the required OPA gain and bandwidth, but is also limited by the required image size and the available pump power for the OPA.
For a particular pump intensity and image size or pump area of each amplifier, the number of amplifiers or the number of frames can be estimated by dividing the total pump power by the pump power of each amplifier. In addition, the time delay between the pump pulse and the signal pulse determines the exposed time slices of the signal in each amplifier (τ).
From the differences between each τ value, frame intervals can be determined. In the FINCOPA system, the value of τ is limited only by the minimum available step sizes of the time delay lines (DL from delay lines ) and the fluctuations of the laser beam paths. Typically, the frame interval is longer than the pump pulse duration.
Figure 1b shows an experimental FINCOPA setup.
The used femtosecond titanium-sapphire laser has the following parameters: 1 kHz; 800 nm; 3.5 mJ; with a pulse duration of ~ 40 fs. The laser output first passes through a second harmonic generator (SHG): 0.2 mm β-BBO crystal. The time resolution of the experimental setup is about 50 fs.
Approximately 30% of the laser pulse is converted to the second harmonic (i.e., a 400 nm pulse) with a pulse duration of ~ 40 fs. After passing through the wavelength separator (WS ), the 400 nm pulse is split into four daughter pulses by a beam splitter group (BSG ), including three 50:50 splitters , to pump four optical parametric amplifiers (NCOPA-1 ... NCOPA -4). The number of amplifiers or the number of frames is equal to four, which is mainly limited by the pulse output power of the femtosecond laser system (~ 3.5 W at 1 kHz). If the energy of the femtosecond laser reaches 7 W, the number of frames can be estimated at 4 x 7 / 3.5 = 8.
The unconverted 800 nm fundamental pulse is reflected by WS. About 1% of a laser pulse with a wavelength of 800 nm is directed to a pulse stretcher (PS ) - a pulse distributor that increases the pulse duration to 50 ps. The expanded pulse then acts as a sample to illuminate the target ultrafast event, as well as a signal for subsequent optical parametric amplifiers.
In the above setup, four optical imaging systems (OIS-1 to OIS-4) are used between the target and the optical parametric amplifiers, so that the target planes and the amplifier planes are mated to each other. The OIS-1 displays the target on the NCOPA-1 using optical zoom to match the spatial bandwidth of the amplifier, thus optimizing image quality. OIS-2, OIS-3 and OIS-4 are used for 1x relay visualization. Four pieces of β-BBO crystals with a thickness of 0.5 mm and a cross section of 29.2 degrees work for OPA with type I phase matching.
In each amplifier, the pump and signal are located with a small intersection angle (~ 2 degrees) inside the β-BBO crystals, so that the generated blank image spatially deviates from both of them. The delay time between them can be independently adjusted using DL (DL-1 to DL-4).
Each blank path uses a lens to display a β-BBO crystal on a CCD camera to optimize image quality.
FINCOPA system characteristics
Using a femtosecond laser pulse as a pump for OPA imaging has several advantages. First, a stronger pump pulse can provide a higher gain in optical parametric gain. Secondly, such a pulse allows obtaining a large spatial bandwidth.
The available pump intensity is mainly limited by laser damage to the OPA crystal, which also depends on the pump pulse duration: the shorter the pumping duration, the higher the available intensity. For femtosecond pulses, the pump intensity can reach hundreds of GW / cm 2 . But nanosecond pulses usually have an intensity below 10 GW / cm 2... In the experiments carried out, the pumping was set at 15 GW / cm 2 , and the OPA gain was about 30.
Spatial and temporal calibration had to be performed prior to actual testing.
To begin with, it was necessary to calibrate the lateral position of the four CCDs and the magnification of the optical imaging system. This was done by simultaneously capturing test images from the CCD.
Next, the initial time was determined, i.e. "Zero time" when the signal interacts with the pumping system NCOPA-1 (pump-1). This parameter can be changed by adjusting the delay of the first pump pulse through the DL-1. Accordingly, the null positions of NCOPA-2, NCOPA-3, and NCOPA-4 can be fixed by adjusting the time delays of their pumping systems so that the signal amplified by NCOPA-1 is also maximized by NCOPA-2, NCOPA-3, and NCOPA. -4 at the same time.
The frame image, which was transferred using the idler pulse (idler-1) and captured by the CCD-1 camera, is the first image. The next three blank images from CCD-2, CCD-3 and CCD-4 became the second, third and fourth images, respectively. Their moments from time zero were adjusted with DL-2, DL-3 and DL-4 to change the time delays of the pump beams.
Ultra-fast plasma array imaging
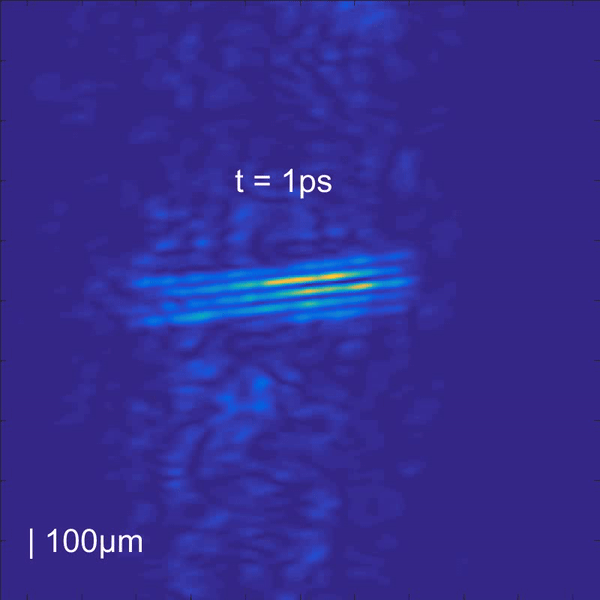
To test the performance of FINCOPA, a plasma array was constructed as a first sample. This is due to the fact that such a grating has adjustable structures with a spatial period of up to 10 microns and a service life measured in picoseconds. Therefore, visualization of such a sample requires subpicosecond temporal resolution and spatial resolution at the micrometer level.
The grating was excited with two non-collinear ultrashort pulses at 800 nm using a non-collinear interferometer (NCI from noncollinear interferometer ). The total energy of the exciting pulse was 2.4 mJ, and the focal length of the lens (L) was 250 mm. The grating period is regulated by changing the angle of intersection of the two beams (2α).
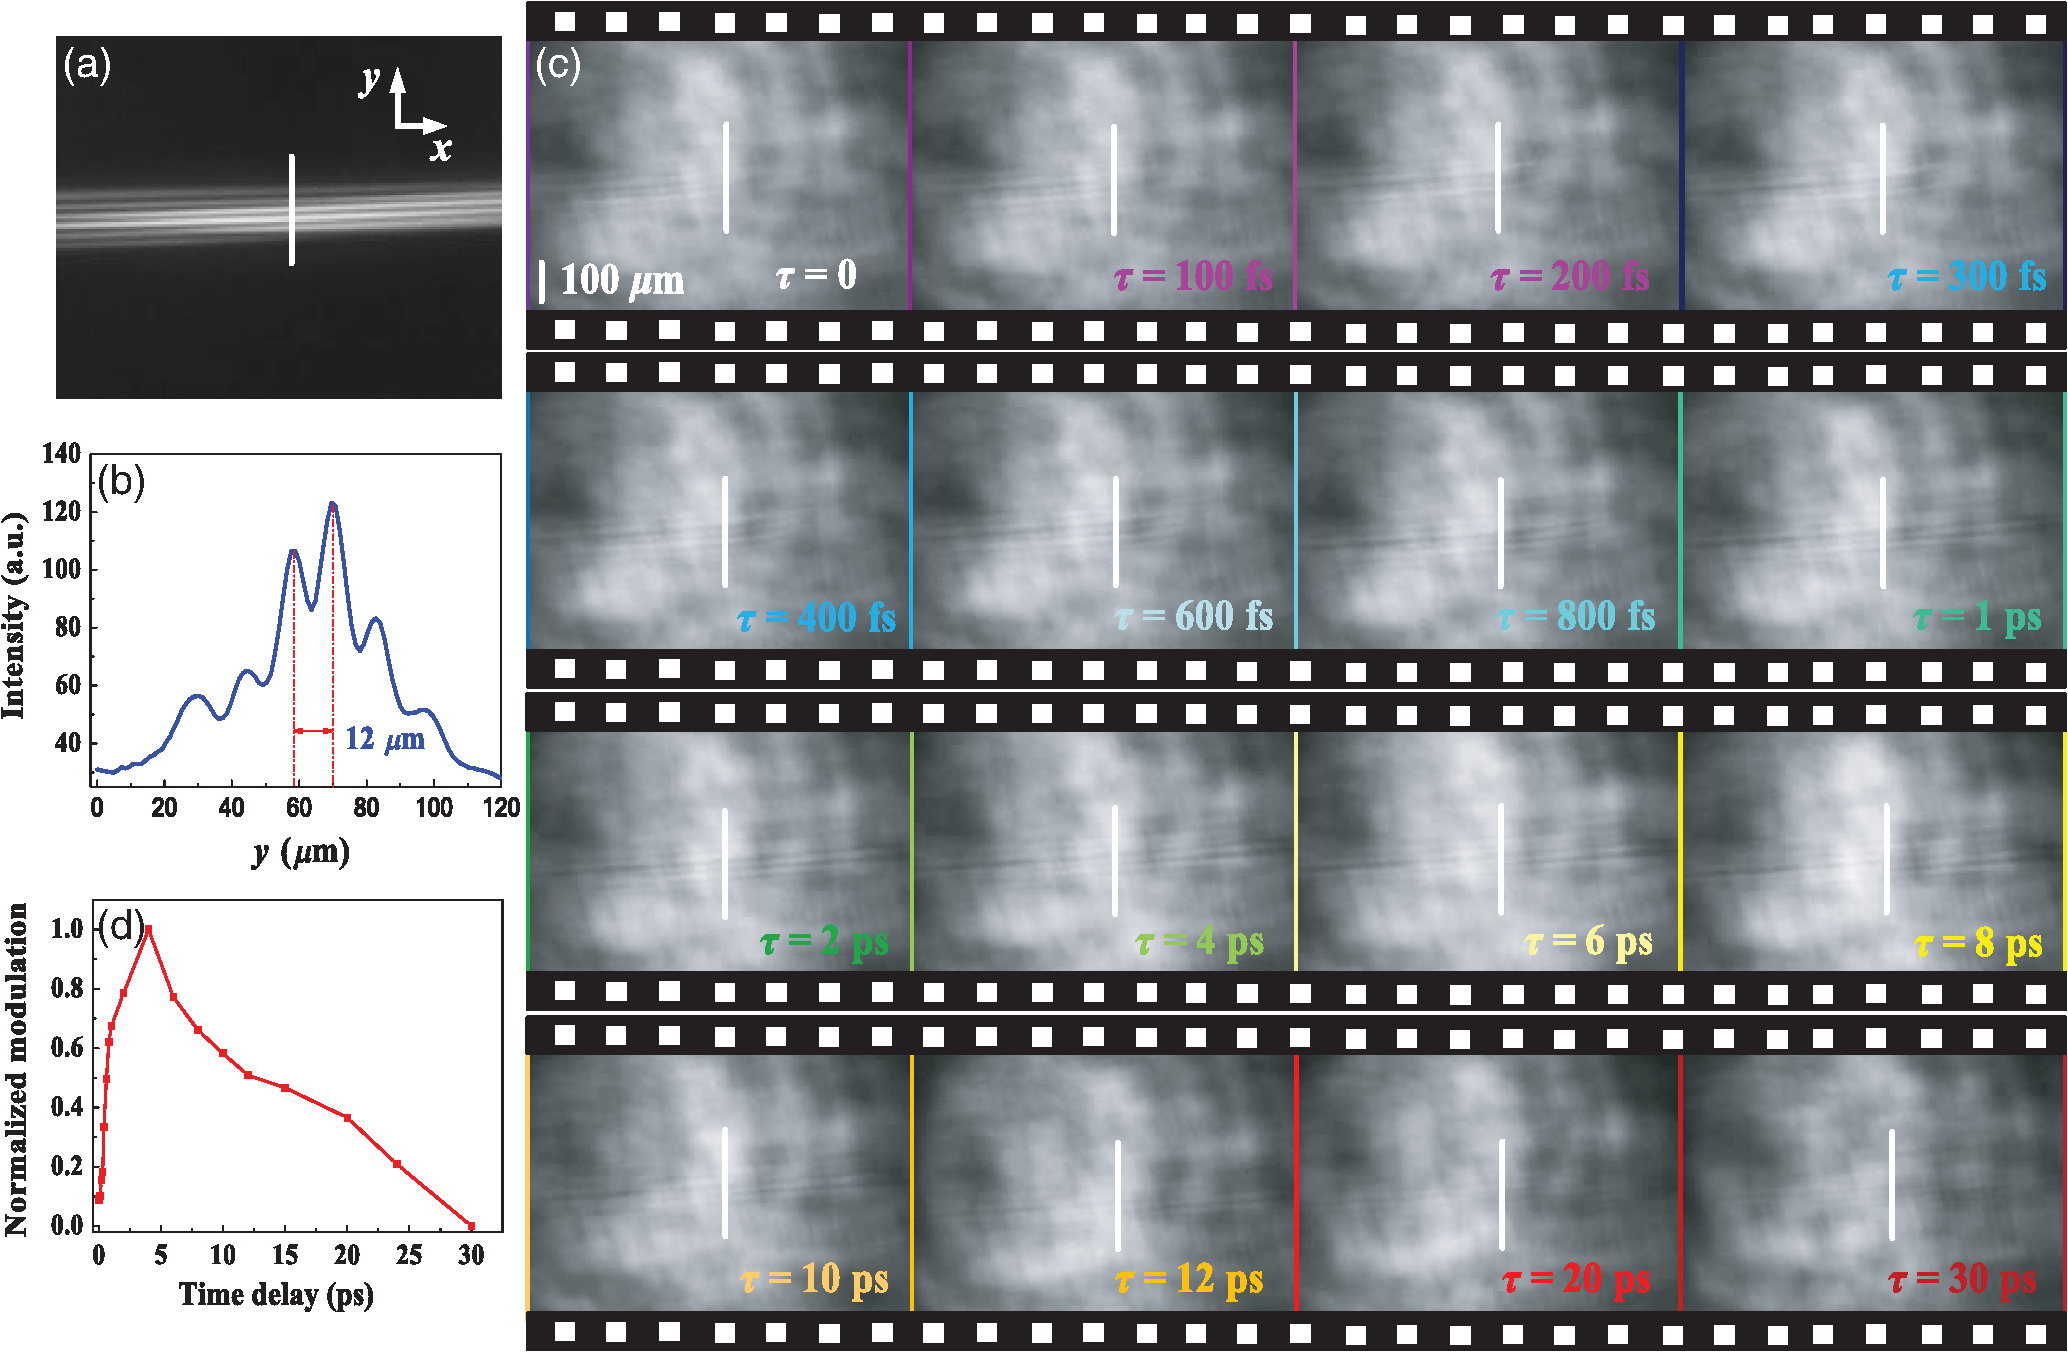
Image No. 2
On2a shows the grating structure for 2α = 3.8 degrees, and 2b shows a one-dimensional intensity profile recorded along the vertical white line on 2a .
It was found that the grating modulation period is 12 μm, which corresponds to a groove density of about 83 lp / mm in the vertical direction. According to the device concept, NCOPA can resolve spatial structures with a spatial frequency of up to 36 lp / mm, so the OIS-1 was adjusted to 3x magnification to visualize the sample on NCOPA for 83 lp mm grating.
Two excitation pulses for the sample came from a Ti: S laser system with a frequency of 1 kHz along with a single pulse selector. In the absence of a single-pulse selector, the event was repeated with a frequency of 1 kHz; therefore, it was detected by the pump-sensing method.
Pump-probing was used to record the evolution of the plasma lattice with NCOPA-1 and CCD-1, which, as seen in 2c , includes 16 image fragments.
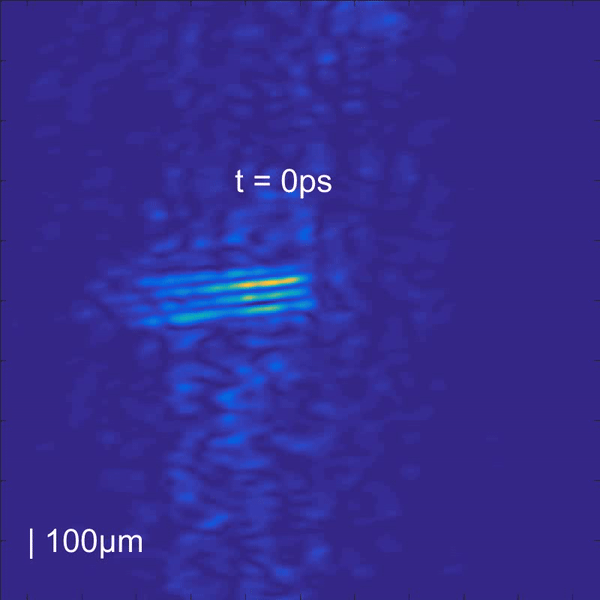
Each of the fragments has a vertical white line to calibrate the spatial position in the horizontal direction. On each fragment of the image, the plasma grating propagates from left to right. And the zero point in time was defined as the moment when the plasma crosses the white line on the first fragment of the image ( 2c ).
Graph 2d shows modulation versus delay. Analysis of these data suggests that, after the pump pulse passes through the white line, the plasma grating becomes monotonically stronger, but begins to disappear after 4 ps.
For time-lapse imaging, a single-pulse selector was installed at the output of the Ti: S system to create a single-frame plasma array.
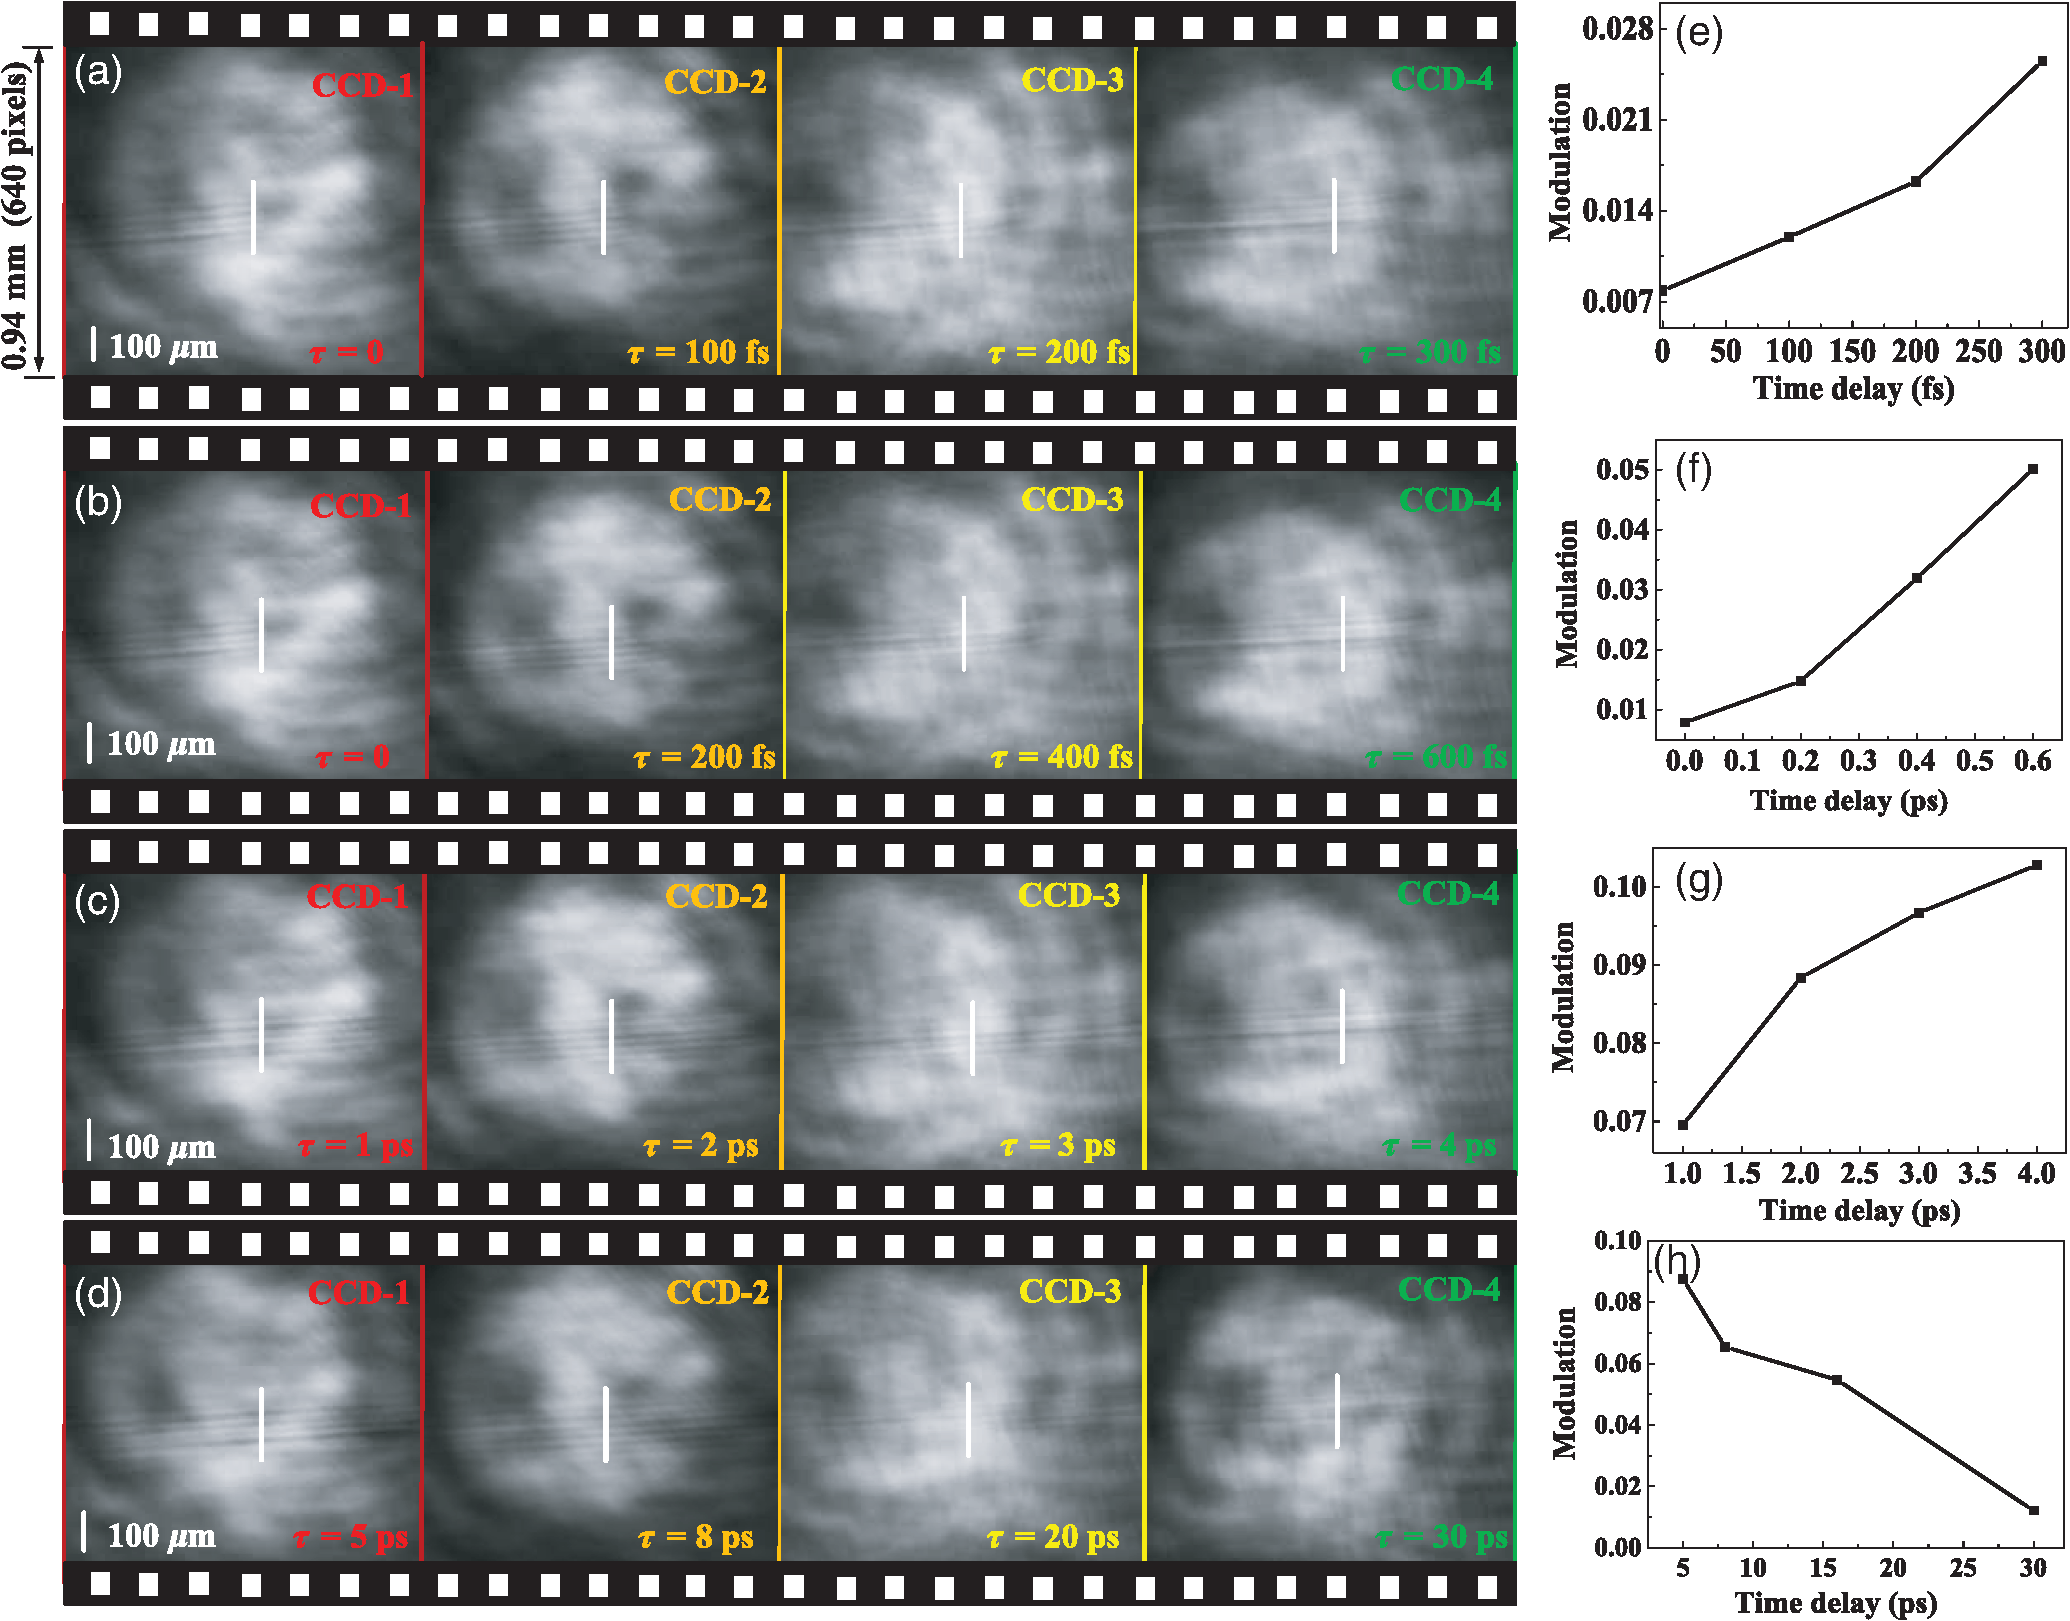
Image # 3
The image above shows four groups of images, each of which includes four frames of video recording of the grid obtained using the FINCOPA system (video # 1).

Video # 1
On 3athe time intervals between adjacent blank images are 100 fs. This means FINCOPA operates at a frame rate of 10 Tfps (video # 2).

Video # 2
On 3a it is also seen that the stripes of the plasma grating from left to right gradually become visible over time, which means that the density of the electron plasma monotonically increases from 0 to 300 fs.
At 3b presents the frames in time 0, 200, 400 and 600 fs, i.e. with an interval between frames 200 fs (video # 3).
Video # 3
The stripes on the plasma grating are becoming more and more distinct, which can be checked by changing the modulation along the white lines ( 3f ).
Based on data from 3e and 3f, the interval between frames was increased to 1 ps, and the recorded NCOPA-1 moment was moved from the zero time moment to 1 ps (video # 4).
Video №4
On 3c and 3g shows the modulation curve and the image reflecting a tendency to increase plasma grating ( 3a and 3b ).
At 3d shows frames at 5, 8, 20 and 30 ps (video №5). The visibility of the fringes decreases with time, which means that the plasma grating begins to gradually disappear from 5 to 30 ps. As a result, in contrast to 3e - 3g , modulation by 3h decreases with time.

Video # 5
To collect complete information from images 3f - 3h , the temporal characteristics of the normalized modulation of the grating were obtained from the white lines of each image (blue marks at 4a ; red marks correspond to 2d obtained by pumping-probing).

Image №4
Comparison of the results of both methods (ie comparison of red and blue labels) showed that the results of both methods coincide, i.e. FINCOPA system is working properly.
In the case when 2α = 2.5 degrees, the period of the plasma grating becomes about 18 μm (i.e., the shading density is 56 lp / mm).
The same experiments were carried out as in image No. 3, but with 2α = 2.5, not 3.8 degrees. Results ( 4b) show good agreement of normalized modulations between the pump-probing method and the FINCOPA method.
Further, the evolution of the lattice along the direction of its propagation was considered. From 4x4 frames, the modulation coefficient was obtained depending on the spatial coordinate along the propagation direction for different values of τ, for example, 0.8, 1, 2, and 4 ps ( 5a ).
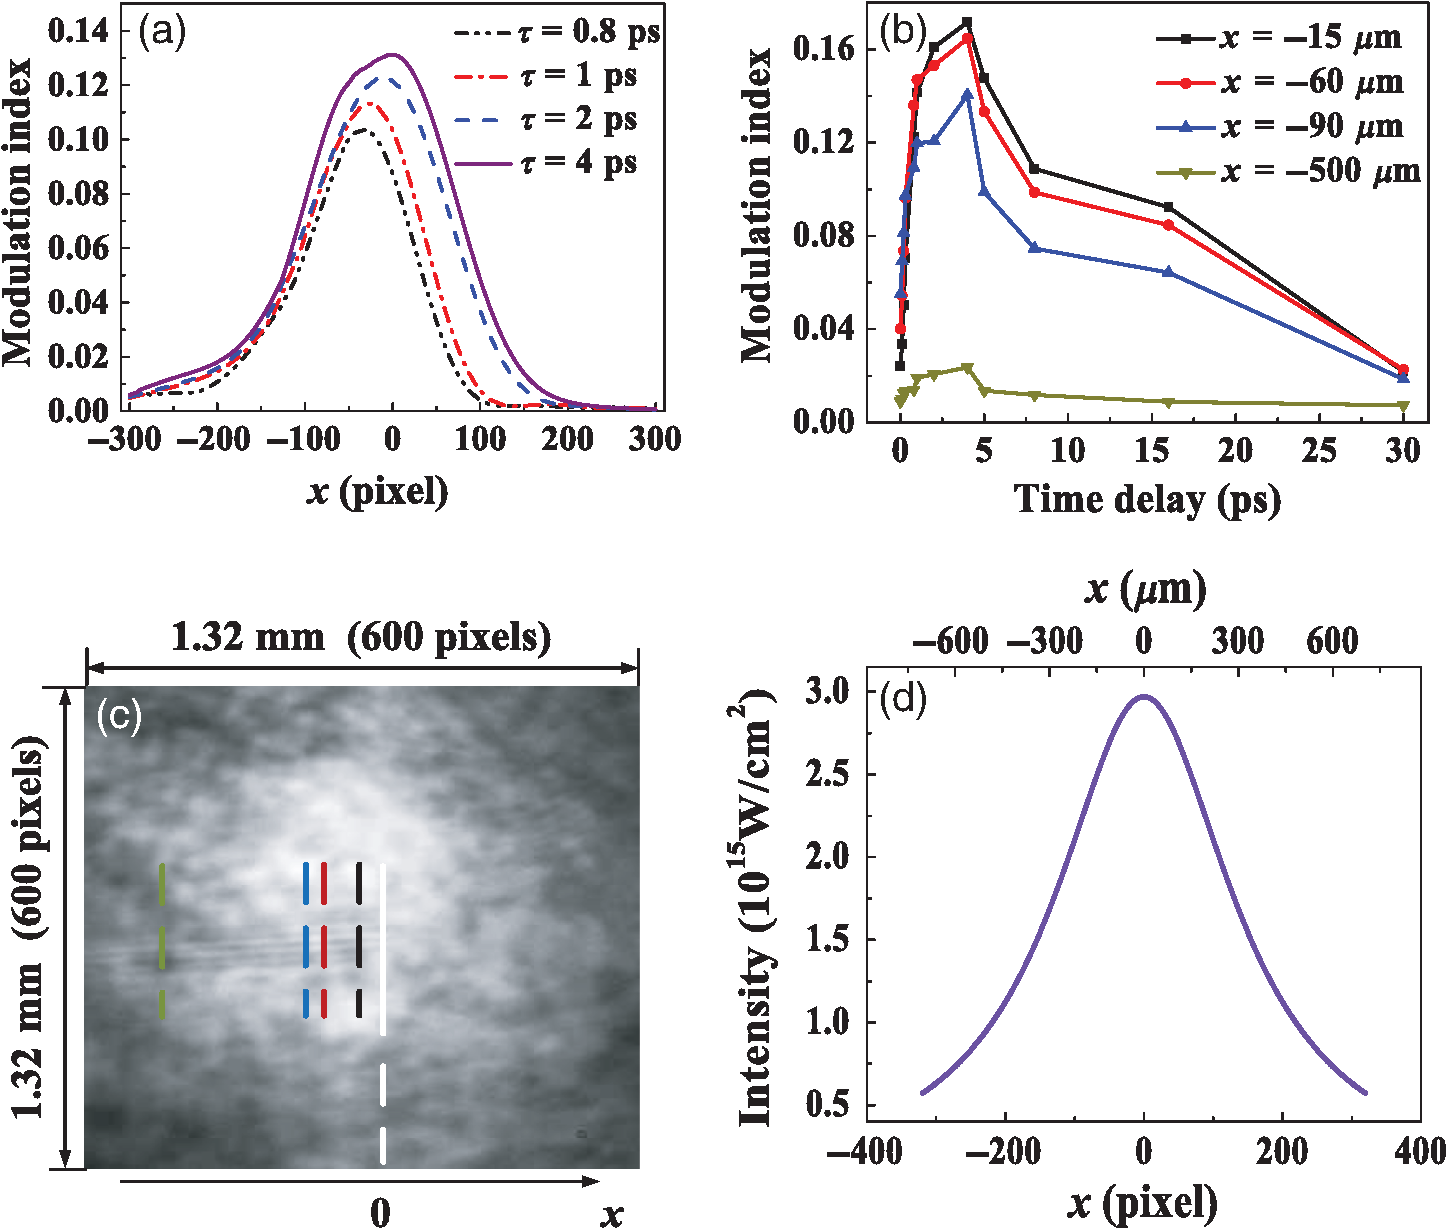
Image No. 5
The modulation peak shifts to the right with increasing τ, which is explained by the fact that a pair of pump pulses propagated from left to right. Since the plasma grating is a low intensity modulation object, the measured image contrast is relatively low. Using spatial filtering, it was possible to remove the background and increase the contrast of the image.
Another observed phenomenon was that the peak modulation values decreased with distance from the center along the x direction. Figure 5b shows the evolution of the lattice modulation as a function of time from 0 to 30 ps at four positions along the x direction (i.e., x = –15, –60, –90, and –500 μm). All positions show a similar evolution of modulation, but the maxima decrease as the position is shifted from the center to the left. Thus, 5b implies the dependence of the grating modulation on x, which may result from the dependence of the intensity of the exciting pulse on x.
Ultra-fast imaging of a rotating optical field
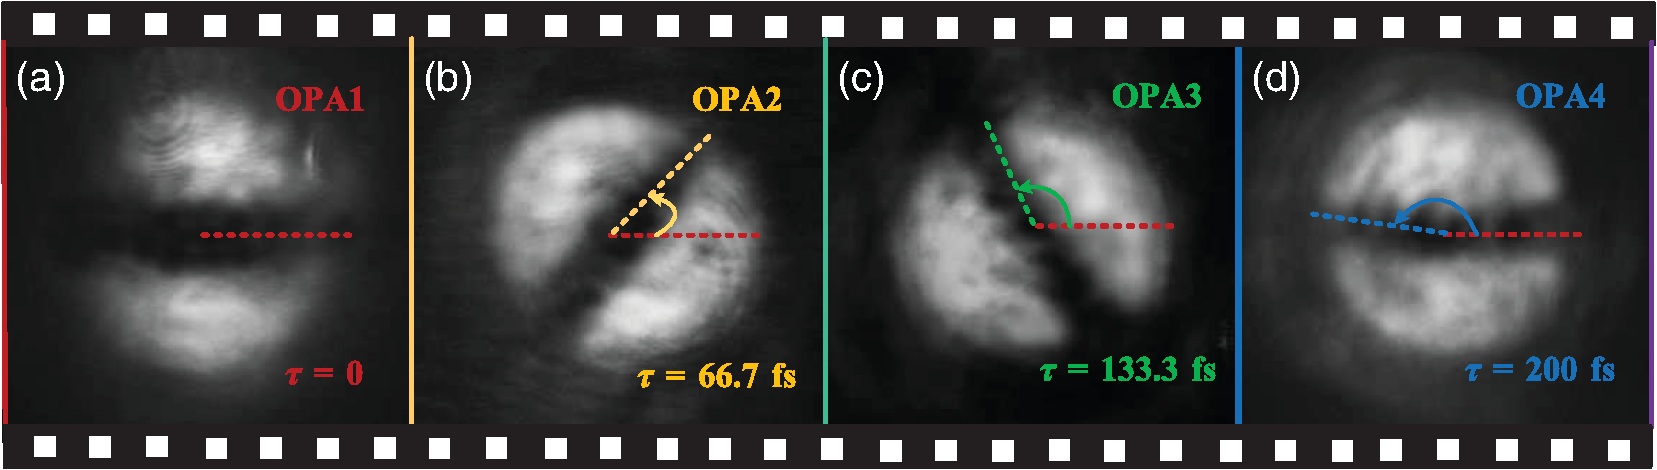
Image # 6
For additional verification of the temporal resolution of FINCOPA, imaging (setup at 7b ) of an ultrafast rotating optical field with a frequency of 20 Hz and a rotation rate of more than 10 trillion radians per second (Trad / s) was performed.

Image # 7
Low repetition rate (20 Hz) means that this kind of optical field can be amplified to extremely high power (for example, tens of terawatts and even higher). However, for a laser system, a low repetition rate is usually accompanied by a large jump-like fluctuation of its output pulses, so that the pump-sensing method can lead to significant measurement inaccuracy.
The studied field was created by two chirped vortex pulses with different topological charges (± l) and time delay (δt). If we adjust the time delay of a pair of chirped pulses to 1 ps, the optical field rotates with a difference in angular frequencies Δω = ∼27 Trad / s (i.e., the rotation cycle is 466 fs).
The FINCOPA system visualized this event with a frame interval of Δt = 66.7 fs, i.e. with a frequency of 15 trillion frames per second (video # 6). Image # 6 shows a field rotating through an angle of ∼0.9π rad in 200 fs.

Video # 6
For a more detailed acquaintance with the nuances of the study, I recommend that you look into the report of scientists .
Epilogue
It is often said that a master is nothing without his instruments. Perhaps this is an exaggeration, because nobody canceled talent, skills and knowledge. However, in the aspect of researching any processes, tools play an important role.
In this work, scientists have demonstrated a workable high-speed imaging system that is capable of capturing anything at a frame rate of up to 15 trillion. Until now, there have not been such indicators, so we can safely talk about setting a new record.
The authors themselves are confident that their brainchild will allow one to learn a lot of new things both in the phenomena and processes that have already been studied, and in those that could not yet be considered due to the lack of the necessary equipment.
Of course, the authors of the study do not intend to give in to bragging, because their system requires improvements and improvements, which in the future may lead to the fact that the FINCOPA method will become as common and common as conventional microscopy. At least this is the dream of scientists. Time will tell whether it will become a reality.
Thanks for your attention, stay curious and have a good work week, guys. :)
A bit of advertising
Thank you for staying with us. Do you like our articles? Want to see more interesting content? Support us by placing an order or recommending to friends, cloud VPS for developers from $ 4.99 , a unique analogue of entry-level servers that we have invented for you: The Whole Truth About VPS (KVM) E5-2697 v3 (6 Cores) 10GB DDR4 480GB SSD 1Gbps from $ 19 or how to divide the server correctly? (options available with RAID1 and RAID10, up to 24 cores and up to 40GB DDR4).
Is Dell R730xd 2x cheaper in Equinix Tier IV data center in Amsterdam? Only we have 2 x Intel TetraDeca-Core Xeon 2x E5-2697v3 2.6GHz 14C 64GB DDR4 4x960GB SSD 1Gbps 100 TV from $ 199 in the Netherlands!Dell R420 - 2x E5-2430 2.2Ghz 6C 128GB DDR3 2x960GB SSD 1Gbps 100TB - From $ 99! Read about How to build the infrastructure of bldg. class with the use of Dell R730xd E5-2650 v4 servers at a cost of 9000 euros for a penny?