Everyone has their favorite books about magic. Someone is Tolkien, someone is Pratchett, someone, like me, is Max Fry. Today I will tell you about my favorite IT magic - about BPF and the modern infrastructure around it.
BPF is at its peak right now. The technology is developing by leaps and bounds, penetrating into the most unexpected places and becoming more and more accessible to the average user. At almost every popular conference today, you can hear a report on this topic, and GopherCon Russia is no exception: I present you a text version of my report .
There will be no unique discoveries in this article. I'll just try to show you what BPF is, what it can do, and how it can help you personally. We'll also take a look at Go-related features.
After reading my article, I would really like your eyes to light up in the same way that the eyes of a child who first read the Harry Potter book light up, so that you come home or to work and try a new “toy” in action.
What is eBPF?
So, what kind of magic is a 34-year-old bearded man with burning eyes going to tell you about?
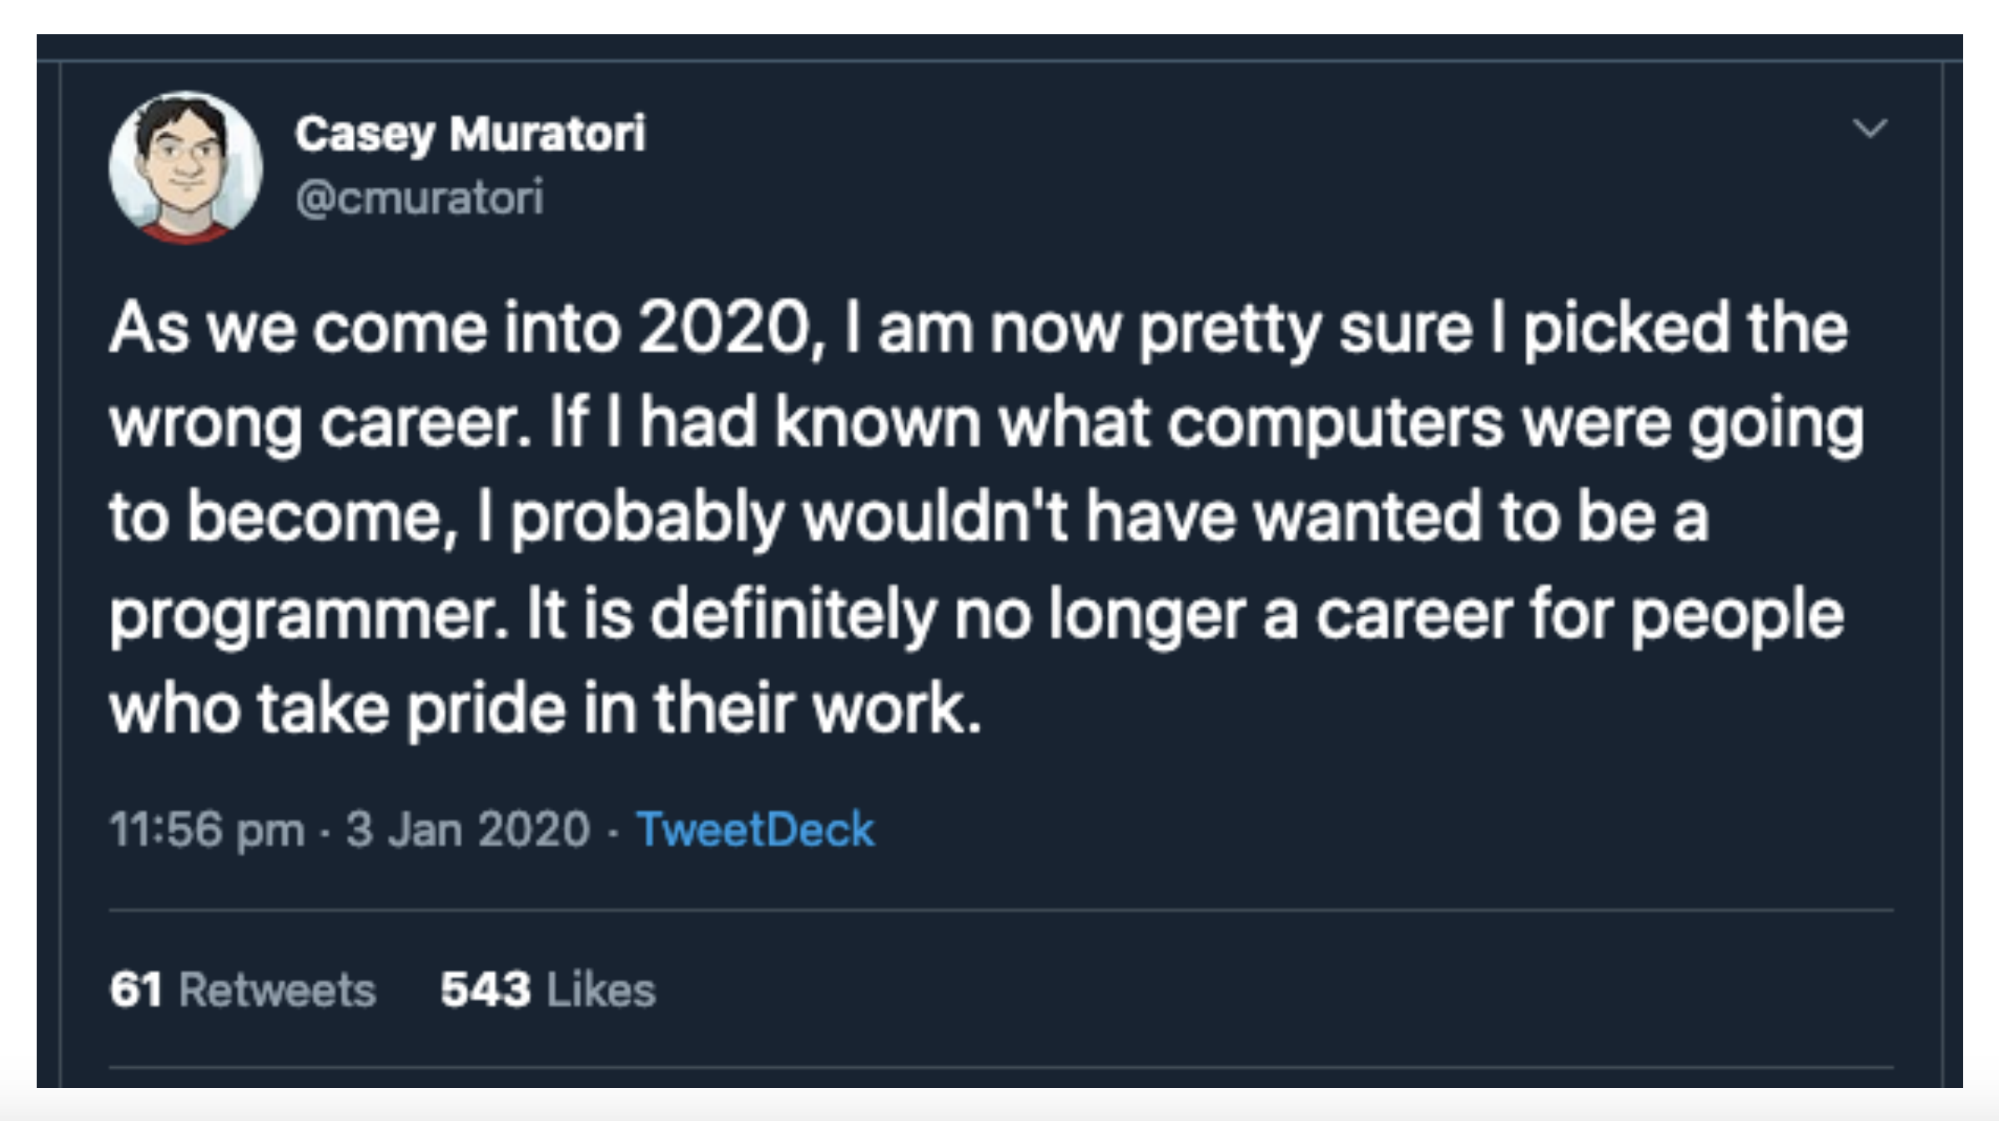
We live with you in 2020. If you open Twitter, you will read the tweets of grumpy gentlemen who claim that the software is now being written of such a terrible quality that it is easier to throw it all away and start over. Some even threaten to leave the profession, because they cannot stand it any longer: everything is constantly breaking down, uncomfortable, slow.
Perhaps they are right: without a thousand comments, we will not find out. But what I definitely agree with is that the modern software stack is more complex than ever.
BIOS, EFI, operating system, drivers, modules, libraries, networking, databases, caches, orchestrators like K8s, containers like Docker, finally, our software with runtimes and garbage collectors. A real professional can answer the question of what happens after you type ya.ru into your browser for several days.
It is very difficult to understand what is happening in your system, especially if something is going wrong at the moment and you are losing money. This problem has led to the emergence of business lines designed to help you understand what is happening inside your system. Large companies have entire Sherlock departments that know where to hammer and which nut to tighten to save millions of dollars.
In interviews I often ask people how they will debug problems if they are woken up at four in the morning.
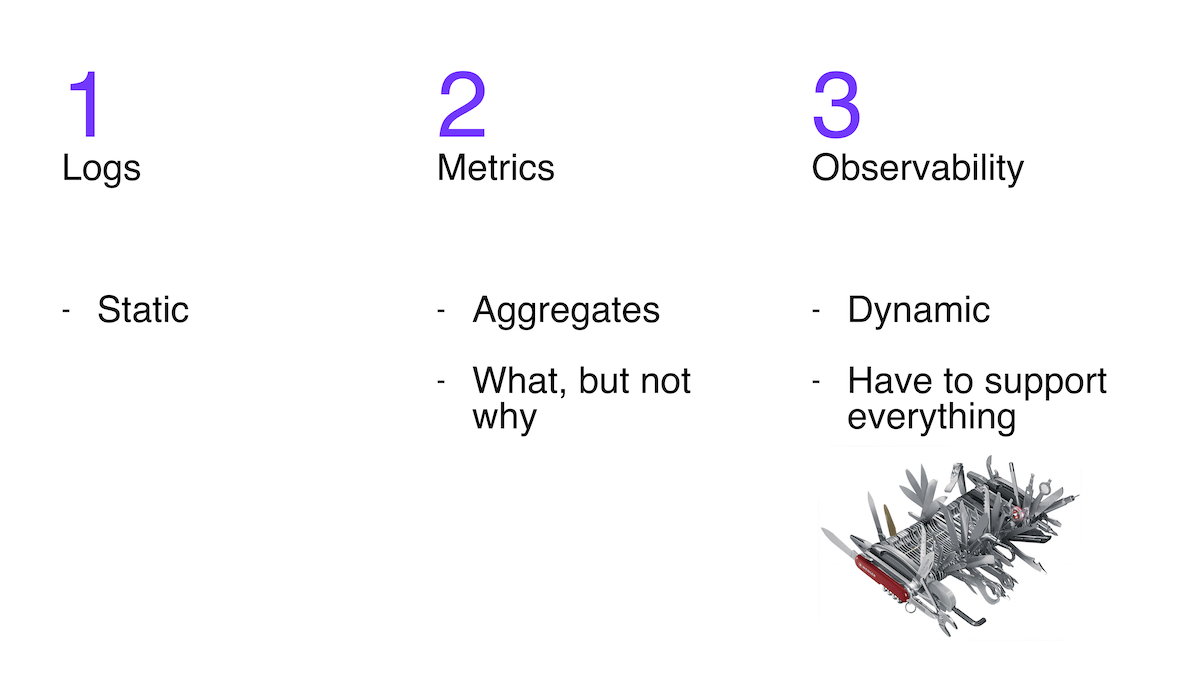
One approach is to analyze the logs . But the problem is that only those that the developer put into his system are available. They are not flexible.
The second popular approach is to study metrics . The three most popular systems for working with metrics are written in Go. Metrics are very useful, but they don't always help you understand the causes by allowing you to see symptoms.
The third approach that is gaining popularity is the so-called observability: the ability to ask arbitrarily complex questions about the behavior of the system and get answers to them. Since the question can be very complex, the answer may require a wide variety of information, and until the question is asked, we do not know what. This means flexibility is vital to observability.
Give the ability to change the logging level on the fly? Connect with a debugger to a running program and do something there without interrupting its work? Understand what requests are coming into the system, visualize the sources of slow requests, see what memory is spent on through pprof, and get a graph of its change over time? Measure latency of one function and dependence of latency on arguments? All these approaches I will refer to observability. This is a set of utilities, approaches, knowledge, experience, which together will give you the opportunity to do, if not everything, then a lot of money, right in the working system. Modern Swiss IT knife.
But how can this be done? There were and are many instruments on the market: simple, complex, dangerous, slow. But the topic of today's article is BPF.
The Linux kernel is event-driven. Almost everything that happens in the kernel, and in the system as a whole, can be represented as a set of events. Interruption is an event, receiving a packet over the network is an event, the transfer of a processor to another process is an event, the launch of a function is an event.
So, BPF is a subsystem of the Linux kernel that makes it possible to write small programs that will be launched by the kernel in response to events. These programs can both shed light on what is happening in your system and control it.
It was a very long introduction. Let's get closer to reality.
1994 saw the first version of BPF, which some of you may have come across when writing simple rules for the tcpdump utility for viewing or sniffing network packets. tcpdump could set "filters" to see not all, but only the packages you are interested in. For example, "only tcp protocol and only port 80". For each passing packet, a function was run to decide whether to save that particular packet or not. There can be a lot of packages, which means that our function must be very fast. Our tcpdump filters have just been converted to BPF functions, an example of which is shown in the picture below.
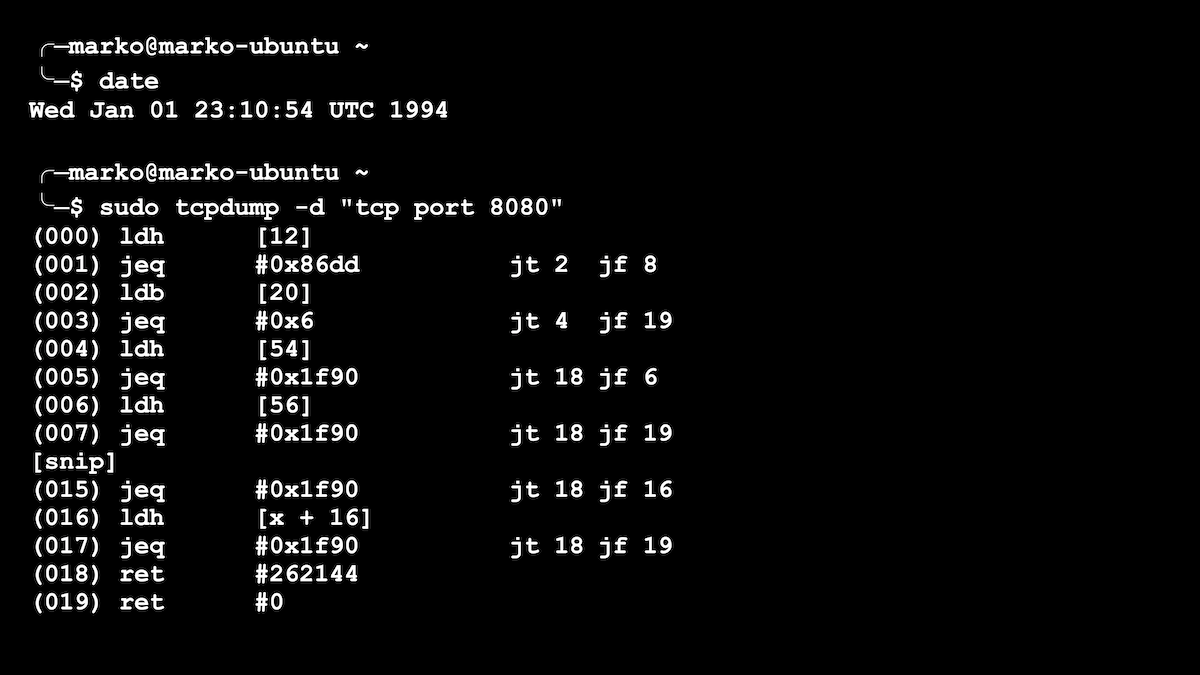
A simple filter for tcpdump is presented as a BPF program
The original BPF was a very simple virtual machine with several registers. But, nevertheless, BPF has significantly accelerated the filtering of network packets. At one time, this was a big step forward.

In 2014, Alexey Starovoitov expanded the BPF functionality. He increased the number of registers and the allowed size of the program, added JIT compilation and made a verifier that checked programs for safety. But the most impressive thing was that new BPF programs could be launched not only during packet processing, but also in response to numerous kernel events, and passed information back and forth between kernel and user space.
These changes opened the way for new use cases for BPF. Some things that were previously done by writing complex and dangerous kernel modules are now relatively easy to do through BPF. Why is this cool? Yes, because any mistake while writing a module often led to panic. Not to fluffy Go-shnoy panic, but to kernel panic, after which - only reboot.
The average Linux user now has the superpower to look under the hood, previously only available to hardcore kernel developers or anyone else. This option is comparable to the ability to effortlessly write a program for iOS or Android: on older phones it was either impossible or much more difficult.
The new version of BPF from Alexey is called eBPF (from the word extended - extended). But now it has replaced all the old versions of BPF and has become so popular that everyone simply calls it BPF for simplicity.
Where is BPF used?
So what are these events, or triggers, to which BPF programs can be attached, and how did people begin to harness this newfound power?
There are currently two large groups of triggers.
The first group is used for processing network packets and for managing network traffic. These are XDP, traffic control events and a few more.
These events are needed to:
- , . Cloudflare Facebook BPF- DDoS-. ( BPF- ), . .
- , , — , , . . Facebook, , , .
- Build smart balancers. The most striking example is the Cilium project , which is most often used in the K8s cluster as a mesh network. Cilium manages traffic: balances, redirects and analyzes it. And all of this is done with the help of small BPF programs that the kernel runs in response to an event related to network packets or sockets.
This was the first group of triggers associated with networked issues with the ability to influence behavior. The second group is related to the more general observability; programs from this group most often do not have the ability to influence something, but can only "observe". She interests me much more.
This group contains triggers such as:
- perf events — , Linux- perf: , , minor/major- . . , , , - . , , , , .
- tracepoints — ( ) , (, ). , — , , , , . - , tracepoints :
- ;
- , ;
- API, , , , , API.
, , , , , pprof .
- ;
- USDT — , tracepoints, user space-. . : MySQL, , PHP, Python. enable-dtrace . , Go . -, , DTrace . , , Solaris: , , GC -, .
Well, then another level of magic begins:
- ftrace triggers give us the ability to run a BPF program at the beginning of almost any kernel function. Fully dynamic. This means that the kernel will call your BPF function before executing any kernel function you choose. Or all kernel functions - whatever. You can attach to all kernel functions and get a nice visualization of all calls in the output.
- kprobes / uprobes give almost the same thing as ftrace, only we have the ability to snap to any place when executing a function, both in the kernel and in the user space. In the middle of the function there is some kind of if on a variable and you need to plot a histogram of the values of this variable? Not a problem.
- kretprobes/uretprobes — , user space. , , . , , PID fork.
The most remarkable thing about all this, I repeat, is that, being called on any of these triggers, our BPF program can take a good look around: read the function arguments, time it, read variables, global variables, take a stack trace, save that then for later, transfer data to the user space for processing, get data from the user space for filtering or some control commands. Beauty!
I don’t know about you, but for me the new infrastructure is like a toy that I have been waiting anxiously for a long time.
API, or How to use it
Okay, Marco, you persuaded us to look towards BPF. But how to approach it?
Let's take a look at what a BPF program consists of and how to interact with it.

First, we have a BPF program that, if verified, will be loaded into the kernel. There it will be JIT compiled into machine code and run in kernel mode when the trigger it is attached to fires.
The BPF program has the ability to interact with the second part - the user space program. There are two ways to do this. We can write to a circular buffer, and the user space part can read from it. We can also write and read in the key-value-storage, which is called the BPF map, and the user space-part, respectively, can do the same thing, and, accordingly, they can transfer some information to each other.
Straight path
The easiest way to work with BPF, which in no case should you start with, is to write BPF programs similar to the C language and compile this code using the Clang compiler into virtual machine code. We then load this code using the BPF system call directly and interact with our BPF program also using the BPF system call.
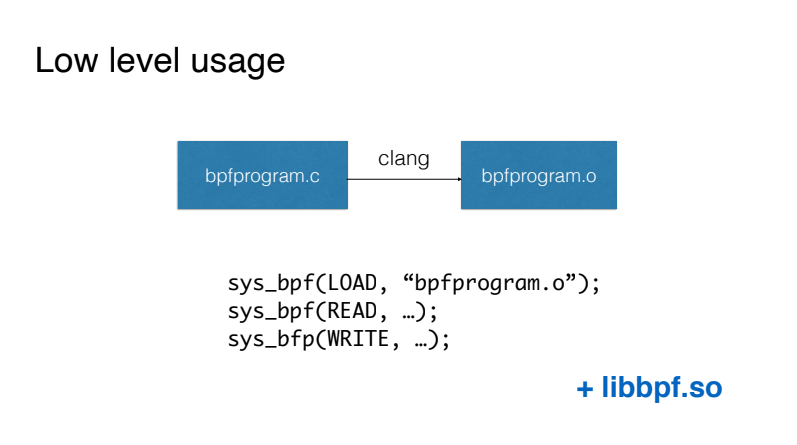
The first simplification available is using the libbpf library, which comes with the kernel sources and allows you not to work directly with the BPF system call. In fact, it provides convenient wrappers for loading code, working with so-called maps for transferring data from the kernel to the user space and back.
bcc
It is clear that such use is far from human-friendly. Fortunately, under the iovizor brand, the BCC project appeared, which greatly simplifies our life.
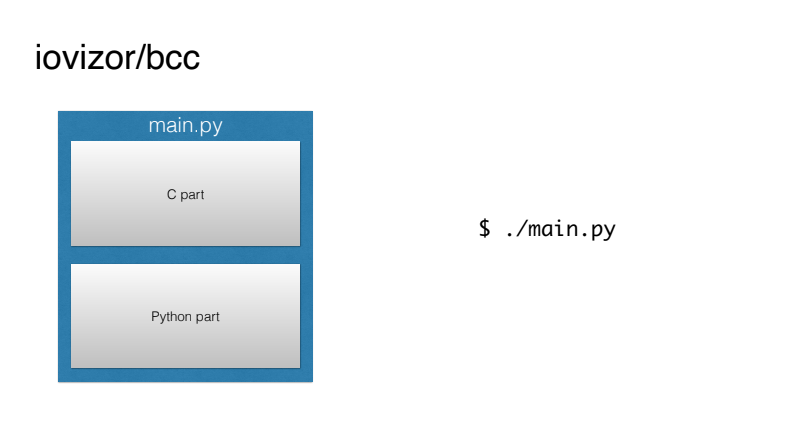
In fact, it prepares the entire build environment and gives us the opportunity to write single BPF programs, where the C-part will be assembled and loaded into the kernel automatically, and the user space-part can be done in simple and understandable Python.
bpftrace
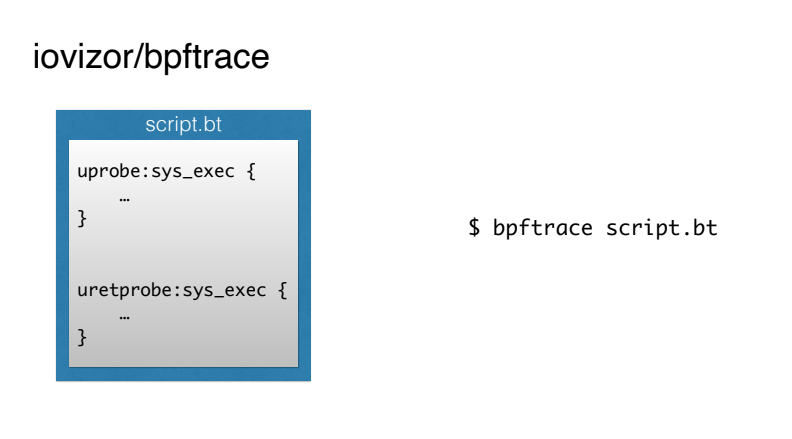
But BCC looks complicated for a lot of things. For some reason, people especially do not like to write parts in C.
The same guys from iovizor introduced the bpftrace tool, which allows you to write BPF scripts in a simple scripting language a la AWK (or generally one-liners).
Renowned performance and observability expert Brendan Gregg prepared the following visualization of the available ways to work with BPF:
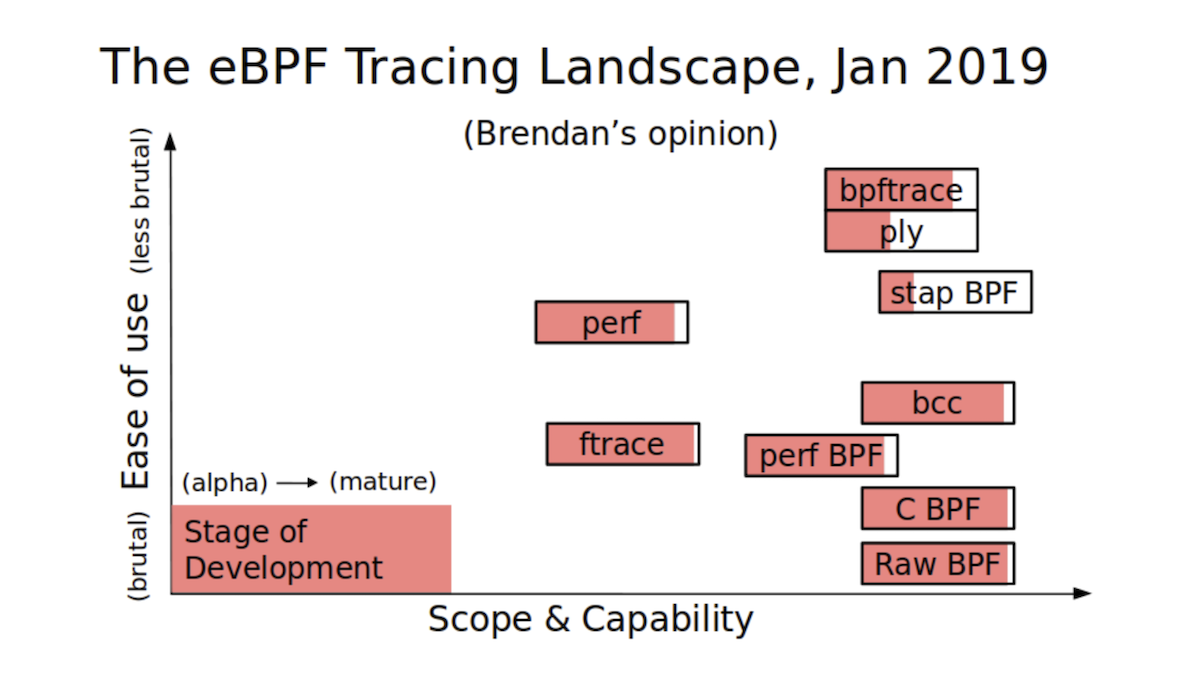
Vertically, we have the simplicity of the tool, and horizontally, its power. It can be seen that BCC is a very powerful tool, but not super simple. bpftrace is much simpler, but it is less powerful.
Examples of using BPF
But let's look at the magical abilities that have become available to us, with specific examples.
Both BCC and bpftrace contain a Tools folder, which contains a huge number of ready-made interesting and useful scripts. They are also the local Stack Overflow from which you can copy chunks of code for your scripts.
For example, here's a script that shows latency for DNS queries:
 ╭─marko@marko-home ~
╰─$ sudo gethostlatency-bpfcc
TIME      PID    COMM                  LATms HOST
16:27:32  21417  DNS Res~ver #93        3.97 live.github.com
16:27:33  22055  cupsd                  7.28 NPI86DDEE.local
16:27:33  15580  DNS Res~ver #87        0.40 github.githubassets.com
16:27:33  15777  DNS Res~ver #89        0.54 github.githubassets.com
16:27:33  21417  DNS Res~ver #93        0.35 live.github.com
16:27:42  15580  DNS Res~ver #87        5.61 ac.duckduckgo.com
16:27:42  15777  DNS Res~ver #89        3.81 www.facebook.com
16:27:42  15777  DNS Res~ver #89        3.76 tech.badoo.com :-)
16:27:43  21417  DNS Res~ver #93        3.89 static.xx.fbcdn.net
16:27:43  15580  DNS Res~ver #87        3.76 scontent-frt3-2.xx.fbcdn.net
16:27:43  15777  DNS Res~ver #89        3.50 scontent-frx5-1.xx.fbcdn.net
16:27:43  21417  DNS Res~ver #93        4.98 scontent-frt3-1.xx.fbcdn.net
16:27:44  15580  DNS Res~ver #87        5.53 edge-chat.facebook.com
16:27:44  15777  DNS Res~ver #89        0.24 edge-chat.facebook.com
16:27:44  22099  cupsd                  7.28 NPI86DDEE.local
16:27:45  15580  DNS Res~ver #87        3.85 safebrowsing.googleapis.com
^C%
The utility shows the execution time of DNS queries in real time, so you can catch, for example, some unexpected outliers.
And this is a script that "spies" on what others type on their terminals:
 ╭─marko@marko-home ~
╰─$ sudo bashreadline-bpfcc
TIME      PID    COMMAND
16:51:42  24309  uname -a
16:52:03  24309  rm -rf src/badoo
This kind of script can be used to catch a "bad neighbor" or audit the security of a company's servers.
Script for viewing flow calls of high-level languages:
 ╭─marko@marko-home ~/tmp
╰─$ sudo /usr/sbin/lib/uflow -l python 20590
Tracing method calls in python process 20590... Ctrl-C to quit.
CPU PID    TID    TIME(us) METHOD
5   20590  20590  0.173    -> helloworld.py.hello
5   20590  20590  0.173      -> helloworld.py.world
5   20590  20590  0.173      <- helloworld.py.world
5   20590  20590  0.173    <- helloworld.py.hello
5   20590  20590  1.174    -> helloworld.py.hello
5   20590  20590  1.174      -> helloworld.py.world
5   20590  20590  1.174      <- helloworld.py.world
5   20590  20590  1.174    <- helloworld.py.hello
5   20590  20590  2.175    -> helloworld.py.hello
5   20590  20590  2.176      -> helloworld.py.world
5   20590  20590  2.176      <- helloworld.py.world
5   20590  20590  2.176    <- helloworld.py.hello
6   20590  20590  3.176    -> helloworld.py.hello
6   20590  20590  3.176      -> helloworld.py.world
6   20590  20590  3.176      <- helloworld.py.world
6   20590  20590  3.176    <- helloworld.py.hello
6   20590  20590  4.177    -> helloworld.py.hello
6   20590  20590  4.177      -> helloworld.py.world
6   20590  20590  4.177      <- helloworld.py.world
6   20590  20590  4.177    <- helloworld.py.hello
^C%
This example shows the call stack of a Python program.
The same Brendan Gregg made a picture in which he collected all the existing scripts with arrows indicating those subsystems that each utility allows to "observ". As you can see, we already have a huge number of ready-made utilities available - for almost any occasion.

Do not try to see something here. The picture is used as a reference
What about us with Go?
Now let's talk about Go. We have two main questions:
- Can you write BPF programs in Go?
- Is it possible to parse programs written in Go?
Let's go in order.
To date, the only compiler that can compile into a format understood by the BPF machine is Clang. Another popular compiler, GCC, does not yet have a BPF backend. And the only programming language that can compile to BPF is a very limited version of C.
However, the BPF program has a second part, which is in the user space. And it can be written in Go.
As I mentioned above, BCC allows you to write this part in Python, which is the primary language of the tool. At the same time, in the main repository, BCC also supports Lua and C ++, and in a third-party repository it also supports Go .
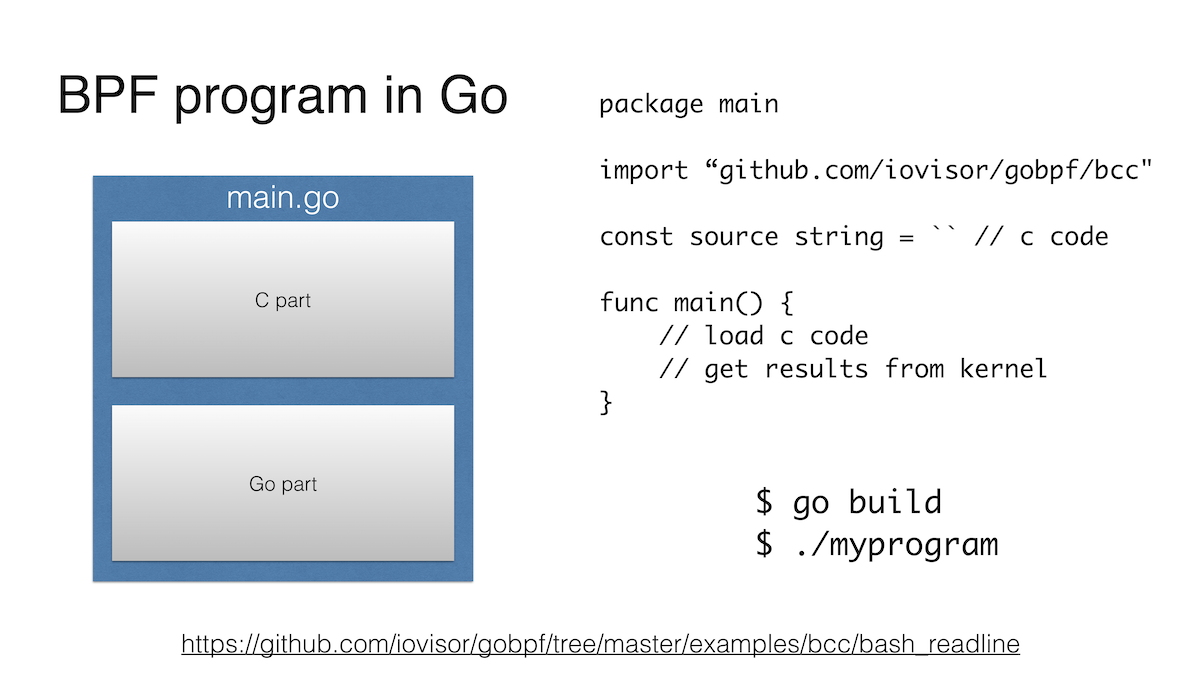
Such a program looks exactly the same as a Python program. At the beginning there is a line in which a BPF program in C, and then we tell where to attach this program, and somehow interact with it, for example, we get data from the EPF map.
Actually, that's all. You can see the example in more detail on Github .
Probably the main drawback is that the C library libbcc or libbpf is used for work, and building a Go program with such a library is not at all like a nice walk in the park.
In addition to iovisor / gobpf, I found three more current projects that allow you to write a userland part in Go.
- https://github.com/dropbox/goebpf
- https://github.com/cilium/ebpf
- https://github.com/andrewkroh/go-ebpf
The Dropbox version does not require any C libraries, but you have to build the kernel part of the BPF program yourself using Clang and then load it into the kernel with the Go program.
The Cilium version has the same features as the Dropbox version. But it is worth mentioning, if only because it is done by the guys from the Cilium project, which means it is doomed to success.
I brought the third project for completeness of the picture. Like the previous two, it has no external C dependencies, requires manual assembly of a BPF C program, but doesn't seem to hold much promise.
In fact, there is another question: why write BPF programs in Go at all? After all, if you look at BCC or bpftrace, BPF programs generally take less than 500 lines of code. Isn't it easier to write a script in bpftrace-language or uncover a little Python? I see two reasons here.
First, you really love Go and prefer to do everything on it. In addition, potentially Go programs are easier to port from machine to machine: static linking, simple binaries, and so on. But everything is far from so obvious, since we are tied to a specific core. I will stop here, otherwise my article will stretch for another 50 pages.
The second option: you are writing not a simple script, but a large-scale system that also uses BPF internally. I even have an example of such a system in Go :

The Scope project looks like a single binary that, when launched in the infrastructure of K8s or another cloud, analyzes everything that happens around, and shows what containers, services are, how they interact, etc. And much of this is done using BPF. An interesting project.
Analyzing Go programs
If you remember, we had one more question: can we analyze programs written in Go using BPF? First thought - of course! What difference does it make in what language the program is written? After all, this is just a compiled code that, like all other programs, calculates something on the processor, eats memory as if not into itself, interacts with the hardware through the kernel, and with the kernel through system calls. In principle, this is correct, but there are features of different levels of complexity.
Passing arguments
One of the features is that Go does not use the ABI that most other languages do. It just so happened that the founding fathers decided to take the ABI of the Plan 9 system , which they knew very well.
ABI is like an API, an interoperability agreement, only at the level of bits, bytes and machine code.
The main ABI element that interests us is how its arguments are passed to the function and how the response is passed back from the function. Whereas the standard x86-64 ABI uses processor registers to pass arguments and responses, the Plan 9 ABI uses a stack for this.
Rob Pike and his team did not plan to make another standard: they already had an almost ready-made C compiler for the Plan 9 system, as simple as two-two, which they quickly converted into a compiler for Go. Engineering approach in action.
But this, in fact, is not a very critical problem. Firstly, we may soon see in Go passing arguments through registers , and secondly, getting arguments from the stack from BPF is not difficult: the sargX alias has already been added to bpftrace , and the same will appear in BCC , most likely in the near future ...
Upd : from the moment I made the report, even a detailed official proposal for the transition to the use of registers in the ABI appeared.
Unique thread identifier
The second feature has to do with Go's favorite feature, goroutines. One way to measure the latency of a function is to save the time it takes to call the function, time it to exit the function, and calculate the difference; and save the start time with a key containing the function name and TID (thread number). The thread number is needed, since the same function can be simultaneously called by different programs or different threads of the same program.
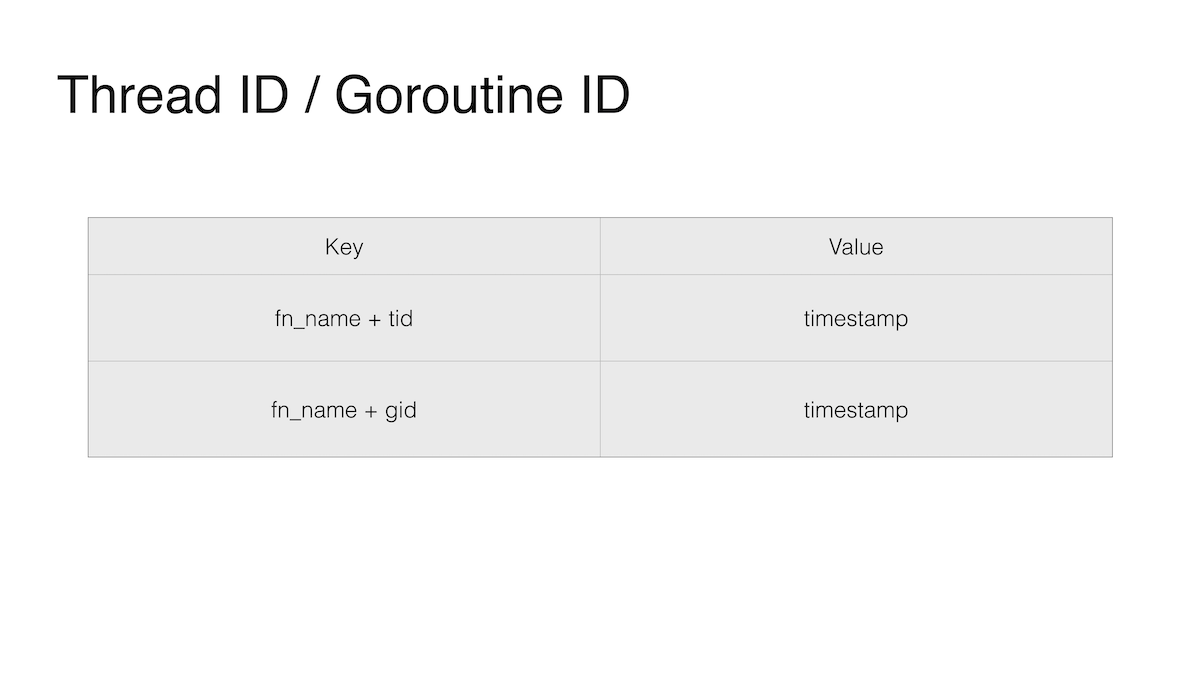
But in Go, goroutines walk between system threads: now a goroutine is executed on one thread, and a little later on another. And in the case of Go, we would not put the TID in the key, but the GID, that is, the ID of the goroutine, but we cannot get it. Technically, this ID exists. You can even pull it out with dirty hacks, since it is somewhere on the stack, but doing this is strictly prohibited by the recommendations of the key Go development group. They felt that we would never need such information. As well as Goroutine local storage, but I digress.
Expanding the stack
The third problem is the most serious. So serious that even if we somehow solve the second problem, it will not help us in any way to measure the latency of Go functions.
Probably, most of the readers understand well what a stack is. The same stack, where, in contrast to the heap or heap, you can allocate memory for variables and not think about freeing them.
If we talk about C, then the stack there has a fixed size. If we go beyond this fixed size, the famous stack overflow will happen .
In Go, the stack is dynamic. In older versions, it was concatenated chunks of memory. It is now a continuous dynamically sized chunk. This means that if the selected piece is not enough for us, we will expand the current one. And if we cannot expand, then we select another larger one and move all the data from the old place to the new one. It's a damn fascinating story that touches on security guarantees, cgo, garbage collector, but that's a topic for another article.
It's important to know that in order for Go to move the stack, it needs to walk the program's call stack, all the pointers on the stack.
This is where the main problem lies: uretprobes, which are used to attach a BPF function, dynamically change the stack at the end of the function execution to inline a call to their handler, the so-called trampoline. And such an unexpected change in Go's stack in most cases ends with a program crash. Oops!

However, this story is not unique. The C ++ "stack" unwrapper also crashes one time at the time of exception handling.
There is no solution to this problem. As usual in such cases, the parties are exchanging absolutely reasonable arguments of each other's guilt.
But if you really need to put uretprobe, then the problem can be circumvented. How? Do not put uretprobe. We can put an uprobe at all the places where we exit the function. There may be one such place, or maybe 50.

And here the uniqueness of Go plays into our hands.
Normally, this trick would not work. A smart enough compiler can do the so-called tail call optimization , when instead of returning from a function and returning along the call stack, we simply jump to the beginning of the next function. This kind of optimization is critical for functional languages like Haskell . Without it, they could not have taken a step without stack overflow. But with such an optimization, we simply cannot find all the places where we return from the function.
The peculiarity is that the Go compiler version 1.14 is not yet able to do tail call optimization. So the trick of attaching to all explicit exits from a function works, albeit very tedious.
Examples of
Don't think BPF is useless for Go. This is far from the case: everything else that does not touch the above nuances, we can do. And we will.
Let's take a look at some examples.
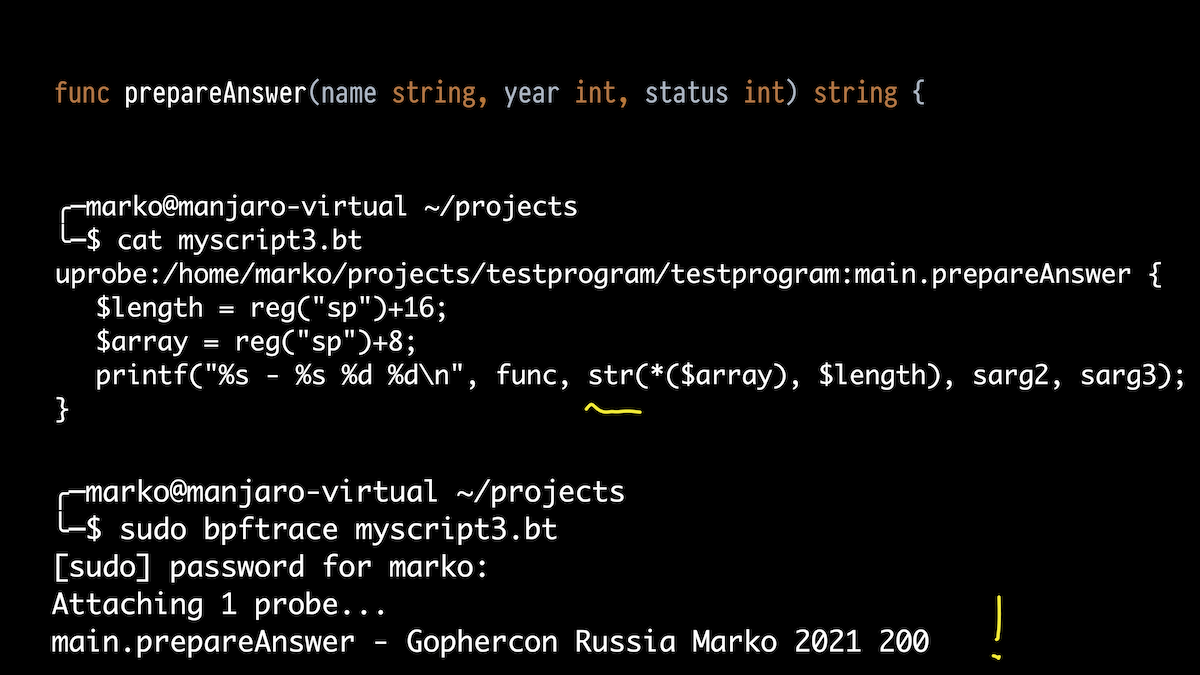
Let's take a simple program for preparation. Basically it is a web server that listens on port 8080 and has an HTTP request handler. The handler will get the name parameter, the Go parameter from the URL and do some kind of check of the "site", and then send all three variables (name, year and check status) to the prepareAnswer () function, which will prepare a response as a string.
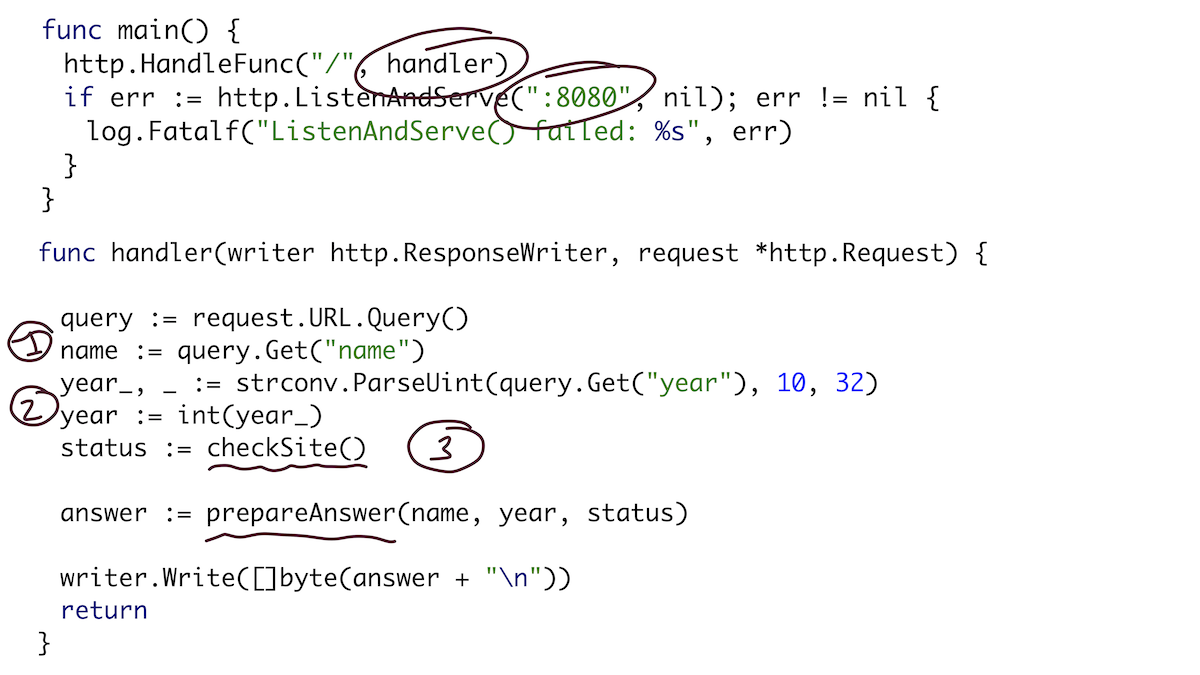
Site validation is an HTTP request that checks if the conference site is up and running using a pipe and a goroutine. And the function of preparing the response just turns it all into a readable string.
We will trigger our program with a simple curl request:

As a first example, we'll use bpftrace to print all the function calls of our program. We attach here to all functions that fall under main. In Go, all your functions have a symbol that looks like the package name-dot-function name. Our package is main, and the function's runtime would be runtime.

When I do curl, the handler, the site validation function and the goroutine subfunction are launched, and then the response preparation function. Class!
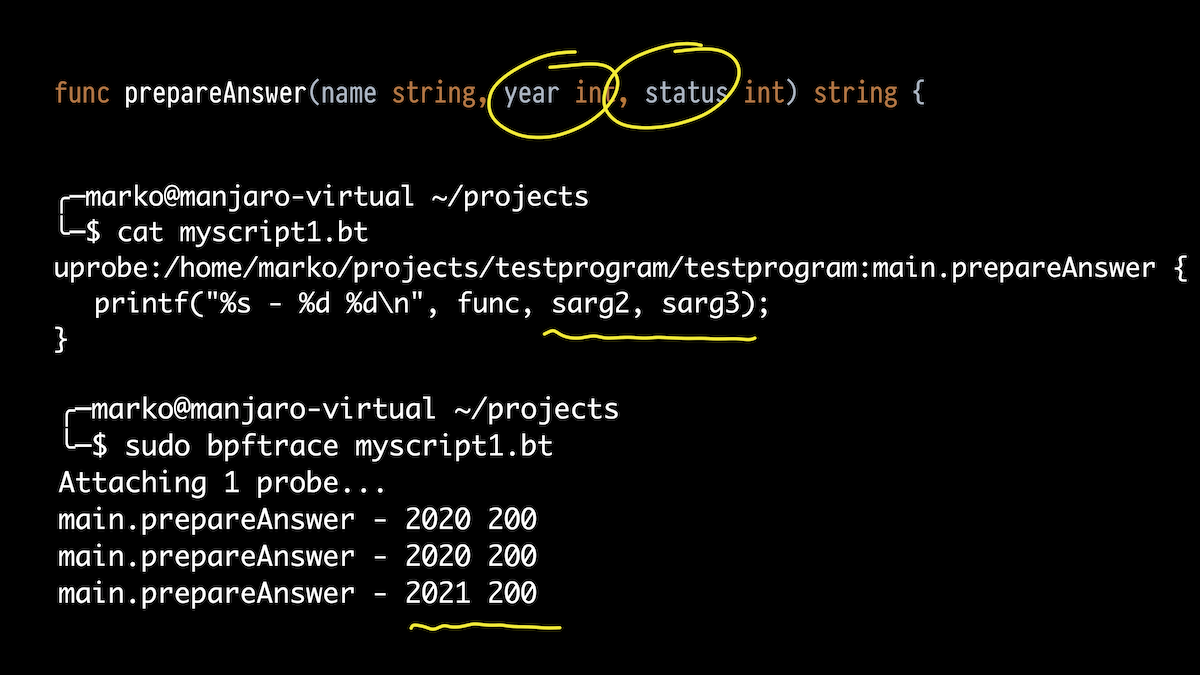
Next, I want to not only display what functions are being executed, but also their arguments. Let's take the prepareAnswer () function. She has three arguments. Let's try to print two int.
We take bpftrace, only now not a one-liner, but a script. We attach to our function and use the aliases for the stack arguments that I mentioned.
In the output, we see what we passed in 2020, got status 200, and passed 2021 once.
But the function has three arguments. The first one is a string. What about him?
Let's just print all stack arguments from 0 to 4. And what do we see? Some big figure, some smaller figure and our old 2021 and 200. What are these strange numbers at the beginning?

This is where it is useful to know the Go device. If in C a string is just a zero-terminated array of characters, then in Go a string is actually a structure consisting of a pointer to an array of characters (not zero-terminated, by the way) and length.

But the Go compiler, when passed a string as an argument, expands this structure and passes it as two arguments. And it turns out that the first strange digit is just a pointer to our array, and the second is the length.
And the truth: the expected length of the string is 22.
Accordingly, we fix our script a little to get these two values through the pointer register stack and the correct offset, and using the built-in function str () we output it as a string. Everything works:
Well, let's take a look at the runtime. For example, I wanted to know what goroutines our program launches. I know that goroutines are triggered by the newproc () and newproc1 () functions. Let's connect to them. The first argument to the newproc1 () function is a pointer to the funcval structure, which has only one field - a function pointer:
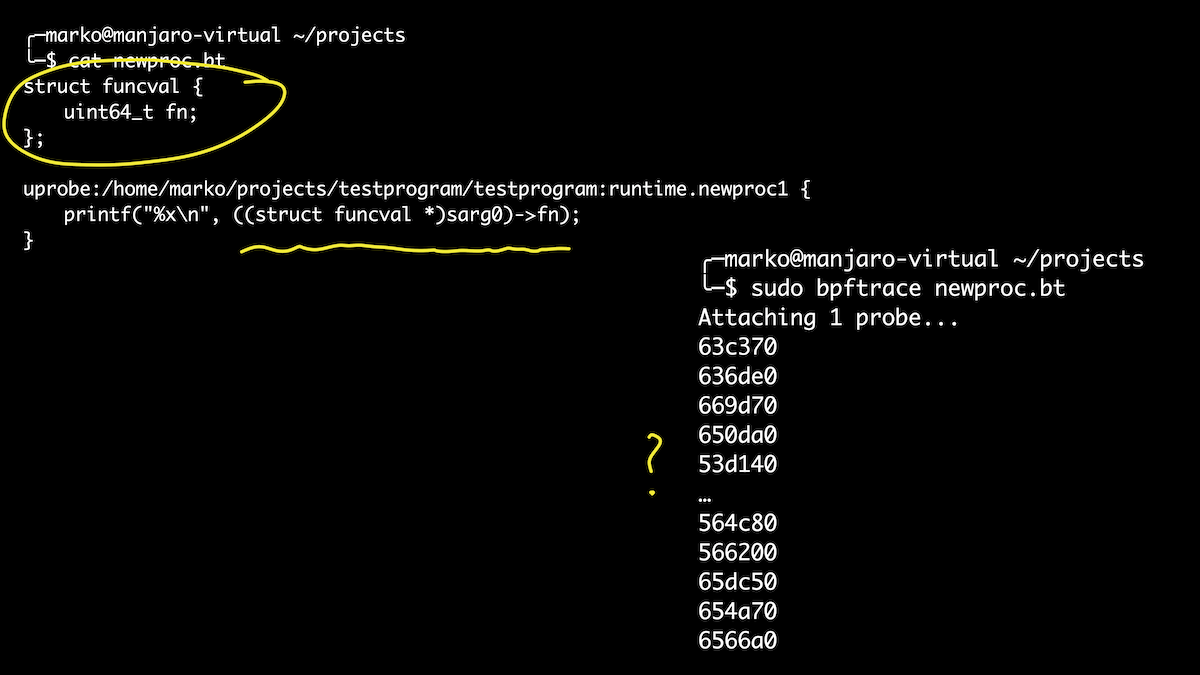
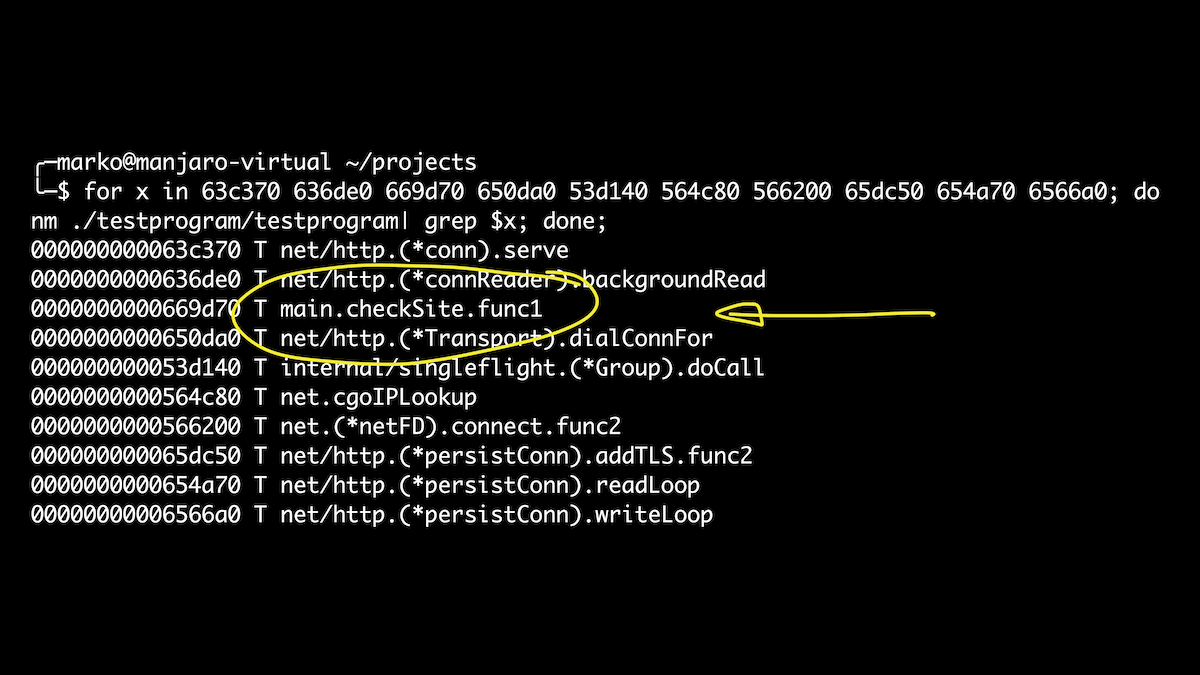
In this case, we will use the opportunity to define structures directly in the script. It's a little easier than playing with offset sets. Here we have brought out all the goroutines that are launched when our handler is called. And if after that we get the names of symbols for our offsets, then just among them we will see our checkSite function. Hooray!
These examples are a drop in the ocean of BPF, BCC and bpftrace capabilities. With proper knowledge of the internals and experience, you can get almost any information from a running program without stopping or changing it.
Conclusion
That's all I wanted to tell you about. I hope I was able to inspire you.
BPF is one of the trendiest and most promising trends in Linux. And I am sure that in the coming years we will see a lot more interesting things not only in the technology itself, but also in the tools and its distribution.
Before it's too late and not everyone knows about BPF, play with it, become magicians, solve problems and help your colleagues. They say that magic tricks only work once.
As for Go, we turned out, as usual, quite unique. We always have some nuances: either the compiler is different, then the ABI, we need some kind of GOPATH, a name that cannot be Google. But we have become a force to be reckoned with, and I believe that life will only get better.