
I write a lot about researching tricky bugs - CPU bugs, kernel bugs, intermediate 4 GB memory allocation, but most bugs are not so exotic. Sometimes, to find a bug, you just need to look at the server dashboard, spend a few minutes in the profiler, or read the compiler warnings.
In this article, I will cover three major bugs that I have found and fixed; all of them did not hide at all and just waited for someone to notice them.
Surprise in the server processor
Several years ago, I spent a few weeks studying memory behavior on live game servers. The servers were running Linux in remote data centers, so most of the time was spent getting the necessary permissions so that I could tunnel to the servers, as well as learning how to work effectively with perf and other Linux diagnostic tools. I discovered a series of bugs that caused the memory consumption to be three times the required amount, and I fixed them:
- I found a mismatch in the map ID, which caused each game not to use the same copy of approximately 20MB of data, but to load a new one.
- I found an unused (!) 50 MB global variable (!!), for which zero memset (!!!) was set, which caused it to consume physical RAM in every process.
- Various less serious bugs.
But our story will not be about that.
After taking the time to learn how to profile our game servers, I realized I could explore this a little deeper. Therefore, I ran perf on the servers of one of our games. The first server process I profiled was ... weird. Watching the sampled processor data “live”, I saw that a single function was consuming 100% of the CPU time. However, only fourteen instructions were executed in this function. It didn't make any sense.
At first I assumed I was using perf incorrectlyor misinterpreting the data. I looked at some of the other server processes and found that about half of them were in a strange state. The second half had a more normal CPU profile.
The function of interest to us passed through the linked list of navigation nodes. I asked my colleagues and found a programmer who said that floating point precision problems could cause the game to generate looped navigation lists. They always wanted to limit the maximum number of nodes that could be bypassed, but they never got around to doing it.
So the puzzle is solved? The instability of floating point calculations causes loops in the navigation lists, which makes the game endlessly bypass them - that's it, the behavior is explained.
But ... such an explanation would mean that when this happens, the server process enters an infinite loop, all players will have to disconnect from it, and the server process will endlessly consume the entire processor core. If that were the case, wouldn't we eventually run out of resources on our servers? Wouldn't anyone have noticed this?
I looked for server monitoring data and found something like this:
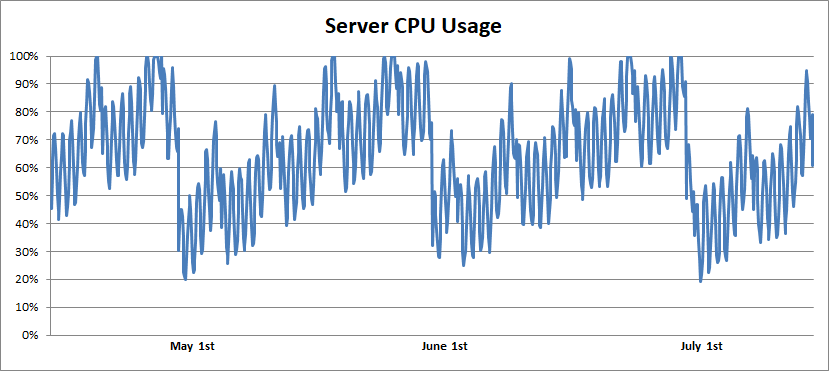
During the entire monitoring period (one to two years), I observed daily and weekly fluctuations in server load, which were superimposed by the monthly pattern. The processor utilization level gradually increased and then dropped to zero. After asking around a little more, I found out that the servers were rebooted once a month. And finally, logic appeared in all this:
- , .
- , , .
- CPU , 50%.
- .
The bug was fixed with the addition of a few lines of code that stopped traversing the list after twenty navigation nodes, presumably saving several million dollars in server and power costs. I didn't find this bug by looking at the monitoring graphs, but anyone who looked at them could do it.
I love the fact that the frequency of the bug coincided perfectly with the maximization of the cost of it; at the same time, he never caused serious enough problems to be found. This is similar to the action of a virus that evolves to make people sneeze, not kill them.
Slow loading
The productivity of the software developer is closely related to the speed of the edit / compile / link / debug cycle. In other words, it depends on how long it takes after making a change to the source file to run the new binary with the change made. I have done a great job over the years to reduce compile / link times, but load times are also important. Some games do a huge amount of work every time they start. I'm impatient and therefore often the first to spend hours or days getting the game to load a few seconds faster.
In this case, I ran my favorite profiler and looked at the CPU usage graph during the initial loading phase of the game. One step looked the most promising: it took about ten seconds to initialize some lighting data. I was hoping that some way could be found to speed up these calculations by saving five seconds on the startup phase. Before diving into the study, I consulted with a graphics specialist. He said:
“We don't use this lighting data in the game. Just remove this challenge. "
Oh great. It was easy.
By spending half an hour profiling and changing one line, I was able to halve the loading time of the main menu, and it didn't take any extraordinary effort.
Untimely departure
Due to the arbitrary number of arguments in the formatting, it is
printfvery easy to get a type mismatch error. In practice, results can vary greatly:
- printf (“0x% 08lx”, p); // Print the pointer as int - truncate or worse on 64 bits
- printf (“% d,% f”, f, i); // Changing the places of float and int - may display nonsense, or it may work (!)
- printf (“% s% d”, i, s); // Changing the order of string and int - most likely will lead to a crash
The standard says that such type mismatches are undefined behavior, and some compilers generate code that deliberately crashes with any of these mismatches, but the above lists the most likely results (note: the question why the second paragraph often produces the desired results is good ABI knowledge puzzle ).
Such errors are very easy to make, so all modern compilers have the ability to warn developers that a mismatch has occurred. Both gcc and clang have printf-style annotations for functions and they can warn about mismatches (however, unfortunately, annotations do not work with wprintf-style functions). VC ++ has annotations (unfortunately others) that / analyze can use to warn about mismatches, but if you don't use / analyze, it will only warn about printf / wprintf-style CRT-style functions, not your custom functions ...
The company I worked for annotated their functions in printf style so that gcc / clang would issue warnings, but later decided to ignore the warnings. This is a strange decision, because such warnings are perfectly accurate indicators of bugs - the signal-to-noise ratio is infinite.
I decided to start cleaning up these bugs with VC ++ and / analyze annotations to find all the bugs exactly. I worked through most of the bugs and made one big change waiting for the code to be checked before submitting it.

There was a power outage in the data center that weekend and all of our servers went down (probably due to errors in power configuration). Emergency personnel rushed to rebuild and fix everything before too much money was lost.
The funny aspect of printf bugs is that they misbehave 100% of the time. That is, if they are going to display incorrect data or cause the program to crash, then this happens every time. Therefore, they can remain in the program only if they are in logging code that is never read, or in error-handling code that is rarely executed.
It turned out that the "simultaneous restart of all servers" event caused the code to move along paths that would not normally be executed. Starting servers started looking for other servers, could not find them, and displayed something like this message:
fprintf (log, “Can't find server% s. Error code% d. \ n”, err, server_name);
Oops. Type mismatch for an arbitrary number of arguments. And departure.
The emergency responders have an additional problem. The servers needed to be rebooted, but this could not be done before crash dumps were examined, a bug was discovered, the server binaries were not rebuilt, and a new build was released. It was a fairly quick process - it seems, no more than a few hours, but it was quite avoidable.
I thought this story perfectly demonstrates why we should spend time troubleshooting the causes of these warnings - why ignore warnings that tell them that the code will definitely crash or behave badly when executed? However, nobody bothered that eliminating this class of warnings could save us several hours of downtime. In fact, the culture of the company didn't seem to be interested in any of these fixes. But it was this last bug that made me realize that it was time to move to another company.
What lessons can be learned from this?
If everyone involved is working hard on product features and fixing well-known bugs, then there are probably very simple bugs that are on the public display. Spend a little time studying the logs, cleaning up compiler warnings (although, in fact, if you have compiler warnings, then it is probably worth rethinking the decisions you have made in life), run the profiler for a few minutes. You get extra points if you add your own logging system, enable new warnings, or use a profiler that no one else uses but you.
If you are making excellent fixes that improve memory / cpu usage or stability, and no one cares about it, then find a company that appreciates it.
Hacker News discussion here , Reddit discussion here , Twitter discussion here .
Advertising
A reliable server for rent and the right choice of a tariff plan will allow you to be less distracted by unpleasant monitoring notifications - everything will work smoothly and with a very high uptime!