Introduction
A memory leak is usually called a situation when the amount of occupied memory in the heap grows during long-term operation of the application and does not decrease after the Garbage Collector exits. As you know, jvm memory is divided into heap and stack. The stack stores the values of variables of simple types and references to objects in the context of the stream, and the heap stores the objects themselves. Also in the heap there is a space called Metaspace, which stores data about loaded classes and data bound to the classes themselves, and not their instances, in particular, the values of static variables. The Garbage Collector (hereinafter GC), periodically launched by the java machine, finds objects in the heap that are no longer referenced and frees the memory occupied by these objects. GC work algorithms are different and complex, in particular,the next time the GC starts, it does not "examine" the entire heap every time to find unused objects, so it is not worth relying on the fact that any more unused object will be removed from memory after one GC start, but if the amount of memory used by the application is steady grows for no apparent reason for a long time, then it's time to think about what could have led to such a situation.
The jvm includes a multifunctional utility Visual VM (hereinafter referred to as VM). VM allows you to visually observe the dynamics of key indicators of jvm in the graphs, in particular, the amount of free and occupied memory in the heap, the number of loaded classes, threads, etc. In addition, using the VM, you can take and examine memory dumps. Of course, the VM also allows thread dumping and application profiling, but an overview of these features is beyond the scope of this article. All we need from the VM in this example is to connect to the virtual machine and first look at the general picture of memory usage. I would like to note that to connect a VM to a remote server, the jmxremote parameters must be configured on it, since the connection is made through jmx.For a description of these parameters, you can refer to the official Oracle documentation or numerous articles on Habré.
So, let's assume that we have successfully connected to the application server using the VM and take a look at the graphs.
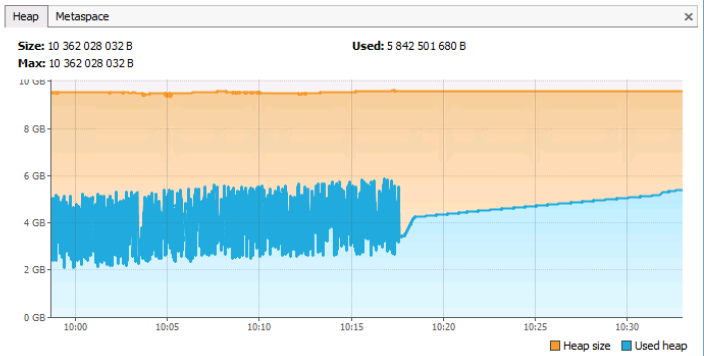
On the Heap tab, you can see the total and used memory of jvm. It should be noted that this tab also takes into account the memory of the Metaspace type (well, how else, because this is also a heap). The Metaspace tab displays information only about the memory occupied by the metadata (by the classes themselves and objects bound to them).
Looking at the graph, we can see that the total heap memory is ~ 10GB, the current occupied space is ~ 5.8GB. The ridges in the graph correspond to GC calls, an almost straight line (no ridges) starting around 10:18 can (but not necessarily!) Indicate that the application server was almost out of order from that time, as there was no active allocation and release memory. In general, this graph corresponds to the normal operation of the application server (if, of course, to judge the work only from memory). The problem graph would be one where a straight horizontal blue line without ridges would be at about the orange level, which represents the maximum amount of memory in the heap.
Now let's take a look at another graph.
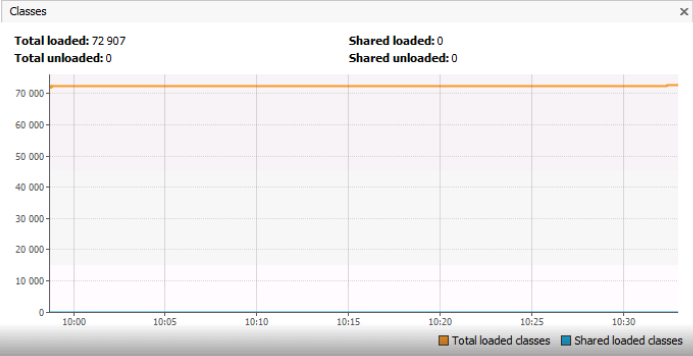
Here we come directly to the analysis of the example, which is the main topic of this article. The Classes graph shows the number of classes loaded into Metaspace, and it is ~ 73 thousand objects. I would like to draw your attention to the fact that we are not talking about class instances, but about the classes themselves, that is, objects of type Class <?>. The graph does not show how many instances of each individual type of ClassA or ClassB are loaded into memory. Perhaps the number of identical classes of type ClassA for some reason multiplies? I must say that in the example that will be described below, 73,000 unique classes was an absolutely normal situation.
The fact is that in one of the projects in which the author of this article took part, a mechanism was developed for the universal description of domain entities (such as in 1C) called a dictionary system, and analysts who customize the system for a specific customer or for a specific business area, had the opportunity, through a special editor, to model a business model by creating new and changing existing entities, operating not at the level of tables, but with such concepts as "Document", "Account", "Employee", etc. The system kernel created tables in a relational DBMS for entity data, and several tables could be created for each entity, since the universal system allowed historically storing attribute values and much more requiring the creation of additional service tables in the database.
I believe that those who had to work with ORM frameworks have already guessed what the author was about, distracted from the main topic of the article by talking about tables. The project used Hibernate and for each table there had to be an Entity bean class. At the same time, since new tables were created dynamically during the work of the system by analysts, the Hibernate bean classes were generated, and not written manually by the developers. And with each next generation, about 50-60 thousand new classes were created. There were significantly fewer tables in the system (about 5-6 thousand), but for each table, not only the Entity bean class was generated, but also many auxiliary classes, which ultimately led to a common figure.
The mechanism of work was as follows. At the start of the system, Entity bean classes and auxiliary classes (hereinafter simply bean classes) were generated based on the metadata in the database. When the system was running, the Hibernate session factory created sessions, sessions created instances of bean class objects. When changing the structure (adding, changing tables), the bean classes were regenerated and a new session factory was created. After the regeneration, the new factory created new sessions that used the new bean classes, the old factory and sessions were closed, and the old bean classes were unloaded by the GC, since they were no longer referenced from the Hibernate infrastructure objects.
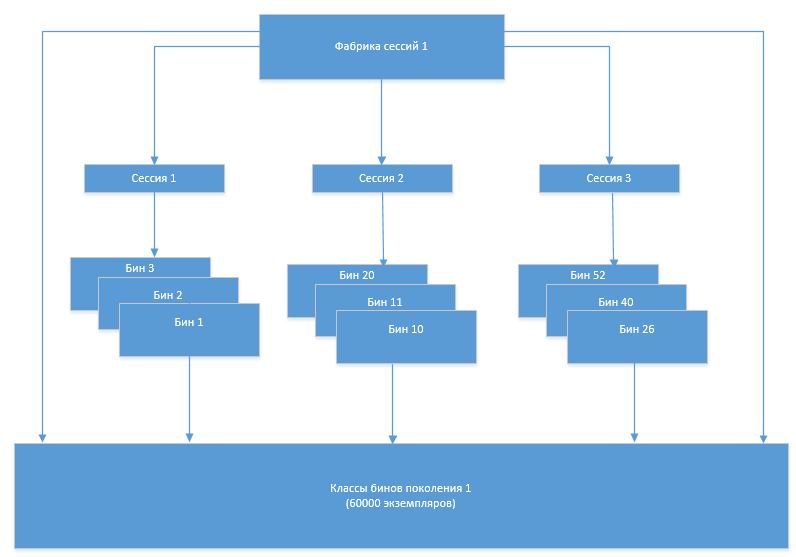
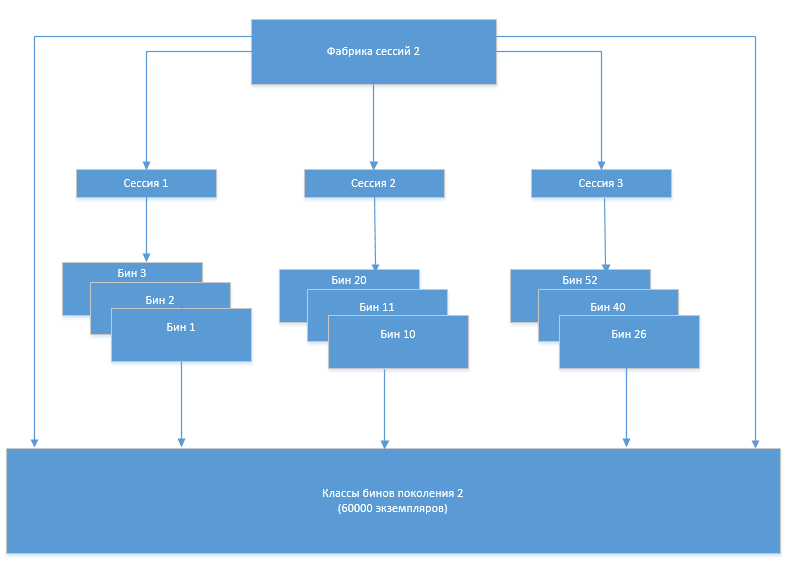
At some point, a problem arose that the number of bin classes began to increase after each next regeneration. Obviously, this was due to the fact that the old set of classes, which should no longer be used, for some reason was not unloaded from memory. In order to understand the reasons for this behavior of the system, the Eclipse Memory Analizer (MAT) came to our aid.
Finding a memory leak
MAT is able to work with memory dumps, finding potential problems in them, but first you need to get this memory dump, but in real environments there are certain nuances with obtaining a dump.
Removing a memory dump
As mentioned above, the memory dump can be removed directly from the VM by pressing the

But button , due to the large size of the dump, the VM may simply not cope with this task, freezing some time after pressing the Heap Dump button. In addition, it is not at all a fact that it will be possible to connect via jmx to the product application server required for the VM. In this case, another jvm utility called jMap comes to our rescue. It runs on the command line, directly on the server where jvm is running, and allows you to set additional dump parameters:
jmap -dump: live, format = b, file = / tmp / heapdump.bin 14616
The –dump: live parameter is extremely important, since allows you to significantly reduce its size, excluding objects that are no longer referenced.
Another common situation is when manual dumping is not possible due to the fact that jvm itself crashes with OutOfMemoryError. In this situation, the -XX: + HeapDumpOnOutOfMemoryError option comes to the rescue and, in addition to it, -XX: HeapDumpPath , which allows you to specify the path to the captured dump.
Next, open the captured dump using the Eclipse Memory Analizer. The file can be large in size (several gigabytes), so you need to provide enough memory in the MemoryAnalyzer.ini file:
-Xmx4096m
Localizing the problem using MAT
So, let's consider a situation when the number of loaded classes multiplies compared to the initial level and does not decrease even after a forced call to garbage collection (this can be done by pressing the corresponding button in the VM).
Above, the process of regenerating the bean classes and their use was conceptually described. On a more technical level, it looked like this:
- All Hibernate sessions are closed (SessionImpl class)
- The old session factory (SessionFactoryImpl) is closed and the reference to it from the LocalSessionFactoryBean is reset
- ClassLoader is re-created
- References to old bean classes in the generator class are nullified
- Bean classes are regenerated
In the absence of references to old bean classes, the number of classes should not increase after garbage collection.
Run MAT and open the previously obtained memory dump file. After opening the dump, MAT displays the largest chains of objects in memory.

After clicking Leak Suspects, we see the details:
2 segments of a circle of 265 M each are 2 instances of SessionFactoryImpl. It is unclear why there are 2 instances of them and, most likely, each of the instances holds references to the full set of Entity bean classes. MAT informs us about potential problems as follows.
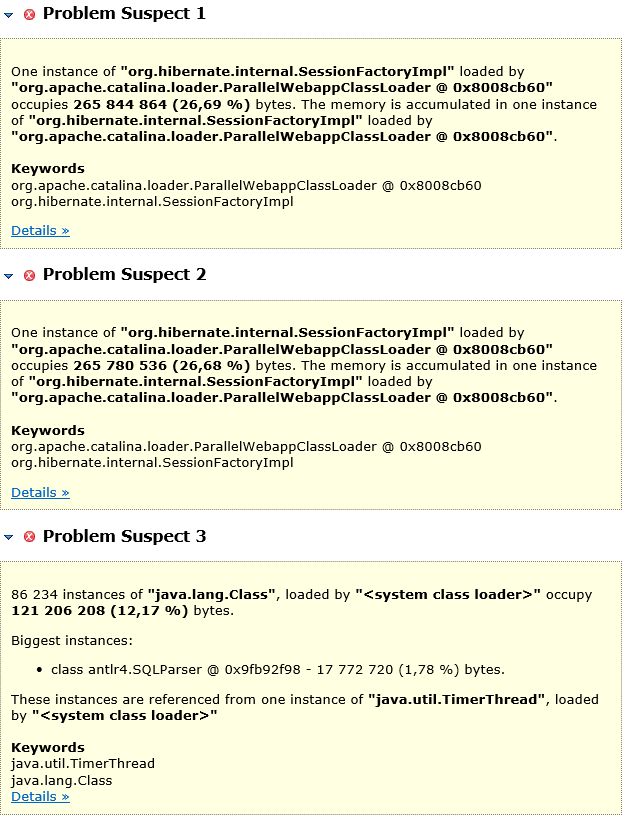
I note right away that Problem Suspect 3 is not really a problem. The project has implemented a parser of its own language, which is a multiplatform add-on over SQL and allows you to operate not with tables, but with system entities, and 121M occupies its query cache.
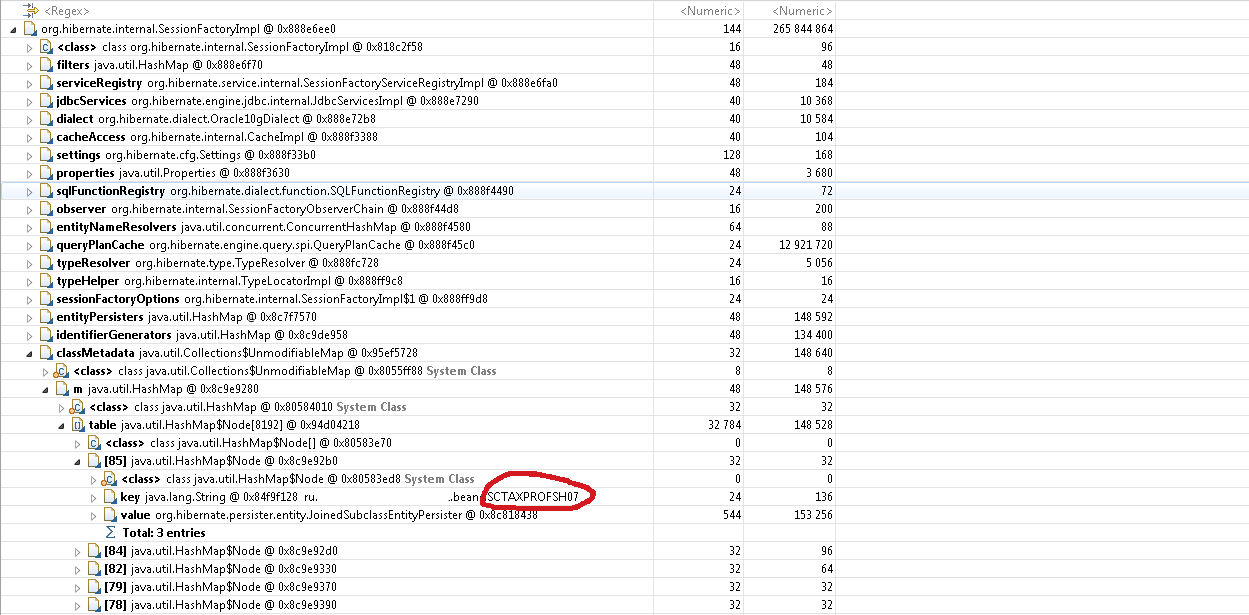
Let's go back to two instances of SessionFactoryImpl. Click Duplicate Classes and see that there are really 2 instances of each Entity bean class. That is, the links to the old classes of the Entity beans remain and, most likely, these are links from the SesssionFactoryImpl. Based on the source code of this class, references to bean classes should be stored in the classMetaData field.
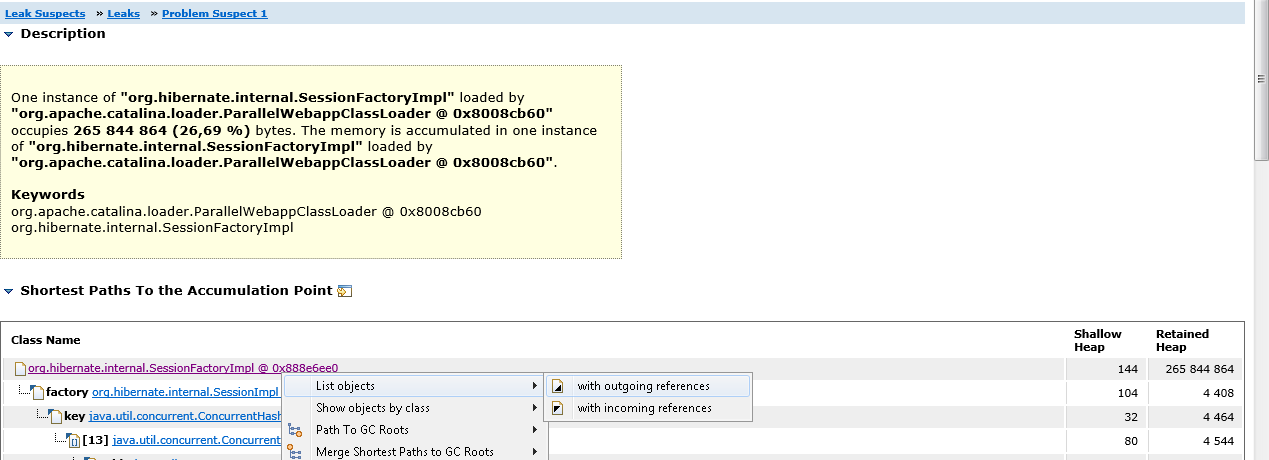
Click on Problem Suspect 1, then on the SessionFactoryImpl class and select List Objects-> With outgouing references from the context menu. This way we can see all the objects referenced by SessionFactoryImpl.
Expand the classMetaData object and make sure that it actually stores an array of Entity bean classes.
Now we need to understand what prevents the garbage collector from disposing of a single instance of SessionFactoryImpl. If we go back to Leak Suspects-> Leaks-> Problem Suspect 1, we will see a stack of links that leads to a link to SessionFactoryImpl.
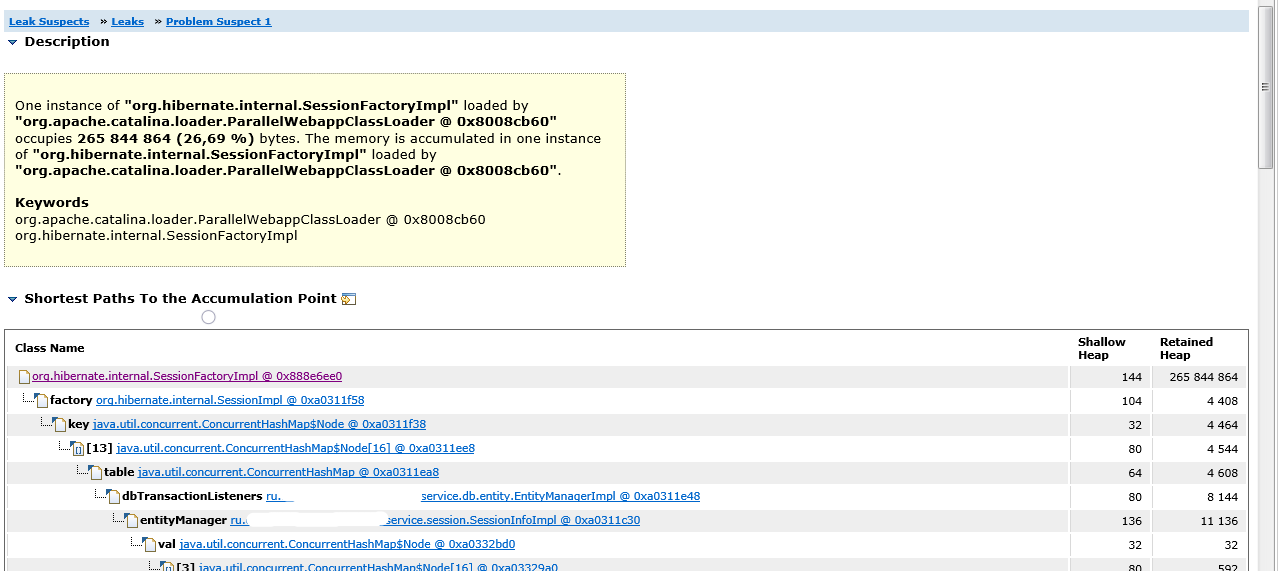
We see that the entityManager variable of the SessionInfoImpl bean containing the context of the HTTP session has an array dbTransactionListeners that uses Hibernate SessionImpl objects as keys, and sessions refer to SessionFactoryImpl.
The fact is that session objects were cached in dbTransactionListeners for certain purposes, and before the bean classes were regenerated, references to them could remain in this array. Sessions, in turn, referenced the session factory, which stored an array of references to all bean classes. In addition, sessions kept references to instances of entity classes, and they referenced the bean classes themselves.
Thus, the entry point to the problem was found. It turned out to be references to old sessions from dbTransactionListeners. After the error was fixed and the dbTransactionListeners array began to be cleared, the problem was fixed.
Eclipse Memory Analizer Features
So, Eclipse Memory Analyzer allows you to:
- Find out which chains of objects occupy the maximum amount of memory and determine the entry points into these chains (Leak Suspects)
- View a tree of all incoming object references (Shortest Paths To the accumulation point)
- View a tree of all outgouing references of an object (Object-> List Objects-> With outgouing references)
- See duplicate classes loaded by different ClassLoaders (Duplicate Classes)