
Introducing a custom and interactive decision tree structure written in Python. This implementation is suitable for extracting knowledge from data, testing intuition, improving understanding of the inner workings of decision trees, and exploring alternative causal relationships for your learning problem. It can be used as part of more complex algorithms, visualizations and reports, for any research purpose, and as an accessible platform to easily test your decision tree algorithm ideas.
TL; DR
- HDTree repository
- Complementary Notebook inside
examples. The repository directory is here (every illustration you see here will be generated in notepad). You can create illustrations yourself.
What is the post about?
Another implementation of decision trees that I wrote as part of my thesis. The work is divided into three parts as follows:
- I'll try to explain why I decided to take my time to come up with my own implementation of decision trees. I will list some of its features , but also the disadvantages of the current implementation.
- I'll show you basic usage of HDTree with some code snippets and some details explained along the way.
- Tips on how to customize and extend HDTree with your ideas.
Motivation and background
For my dissertation, I started working with decision trees. My goal now is to implement a human-centered ML model where HDTree (Human Decision Tree, for that matter) is an additional ingredient that is applied as part of the real UI for that model. Although this story is exclusively about HDTree, I could write a sequel detailing the other components.
HDTree features and comparison with scikit learn decision trees
Naturally, I came across a decision tree implementation
scikit-learn[4]. The implementation sckit-learnhas many advantages:
- It's fast and streamlined;
- Written in the Cython dialect. Cython compiles to C code (which, in turn, compiles to binary code), while retaining the ability to interact with the Python interpreter;
- Simple and convenient;
- Many people in ML know how to work with models
scikit-learn. Get help everywhere thanks to its user base; - It has been tested in combat conditions (it is used by many);
- It just works;
- It supports a variety of pre-trimming and post-trimming techniques [6] and provides many features (eg, trimming with minimal cost and sample weights);
- Supports basic rendering [7].
However, it certainly has some disadvantages:
- It's not trivial to change, in part because of the rather unusual Cython dialect (see advantages above);
- There is no way to take into account user knowledge about the subject area or change the learning process;
- The visualization is quite minimalistic;
- No support for categorical features;
- No support for missing values;
- The interface for accessing nodes and traversing the tree is cumbersome and not intuitive;
- No support for missing values;
- Binary partitions only (see below);
- There are no multivariate partitions (see below).
HDTree features
HDTree offers a solution to most of these problems, but sacrifices many of the benefits of scikit-learn's implementation. We'll come back to these points later, so don't worry if you don't already understand the entire following list:
- Interacts with learning behavior;
- The main components are modular and fairly easy to extend (implement an interface);
- Written in pure Python (more available)
- Has rich visualization;
- Supports categorical data;
- Supports missing values;
- Supports multivariate splitting;
- Has a convenient navigation interface through the tree structure;
- Supports n-ary partitioning (more than 2 child nodes);
- Solution textual representations;
- Encourages explainability by printing human readable text.
Minuses:
- Slow;
- Not tested in battles;
- The quality of the software is mediocre;
- Not many cropping options. The implementation supports some basic parameters though.
There are not many disadvantages, but they are critical. Let's be clear right away: Don't feed big data to this implementation. You will wait forever. Do not use it in a production environment. It can break unexpectedly. You've been warned! Some of the problems above can be resolved over time. However, the learning rate is likely to remain low (although the inference is valid). You will need to come up with a better solution to fix this. I invite you to contribute. However, what are the possible applications?
- Extracting knowledge from data;
- Checking the intuitive view of the data;
- Understanding the inner workings of decision trees;
- Explore alternative causal relationships in relation to your learning problem;
- Use as part of more complex algorithms;
- Creation of reports and visualization;
- Use for any research purposes;
- As an accessible platform to easily test your ideas for decision tree algorithms.
Decision tree structure
Although decision trees will not be covered in detail in this paper, we will summarize their basic building blocks. This will provide a basis for understanding the examples later, and also highlight some of the features of HDTree. The following figure shows the actual output of HDTree (excluding markers).
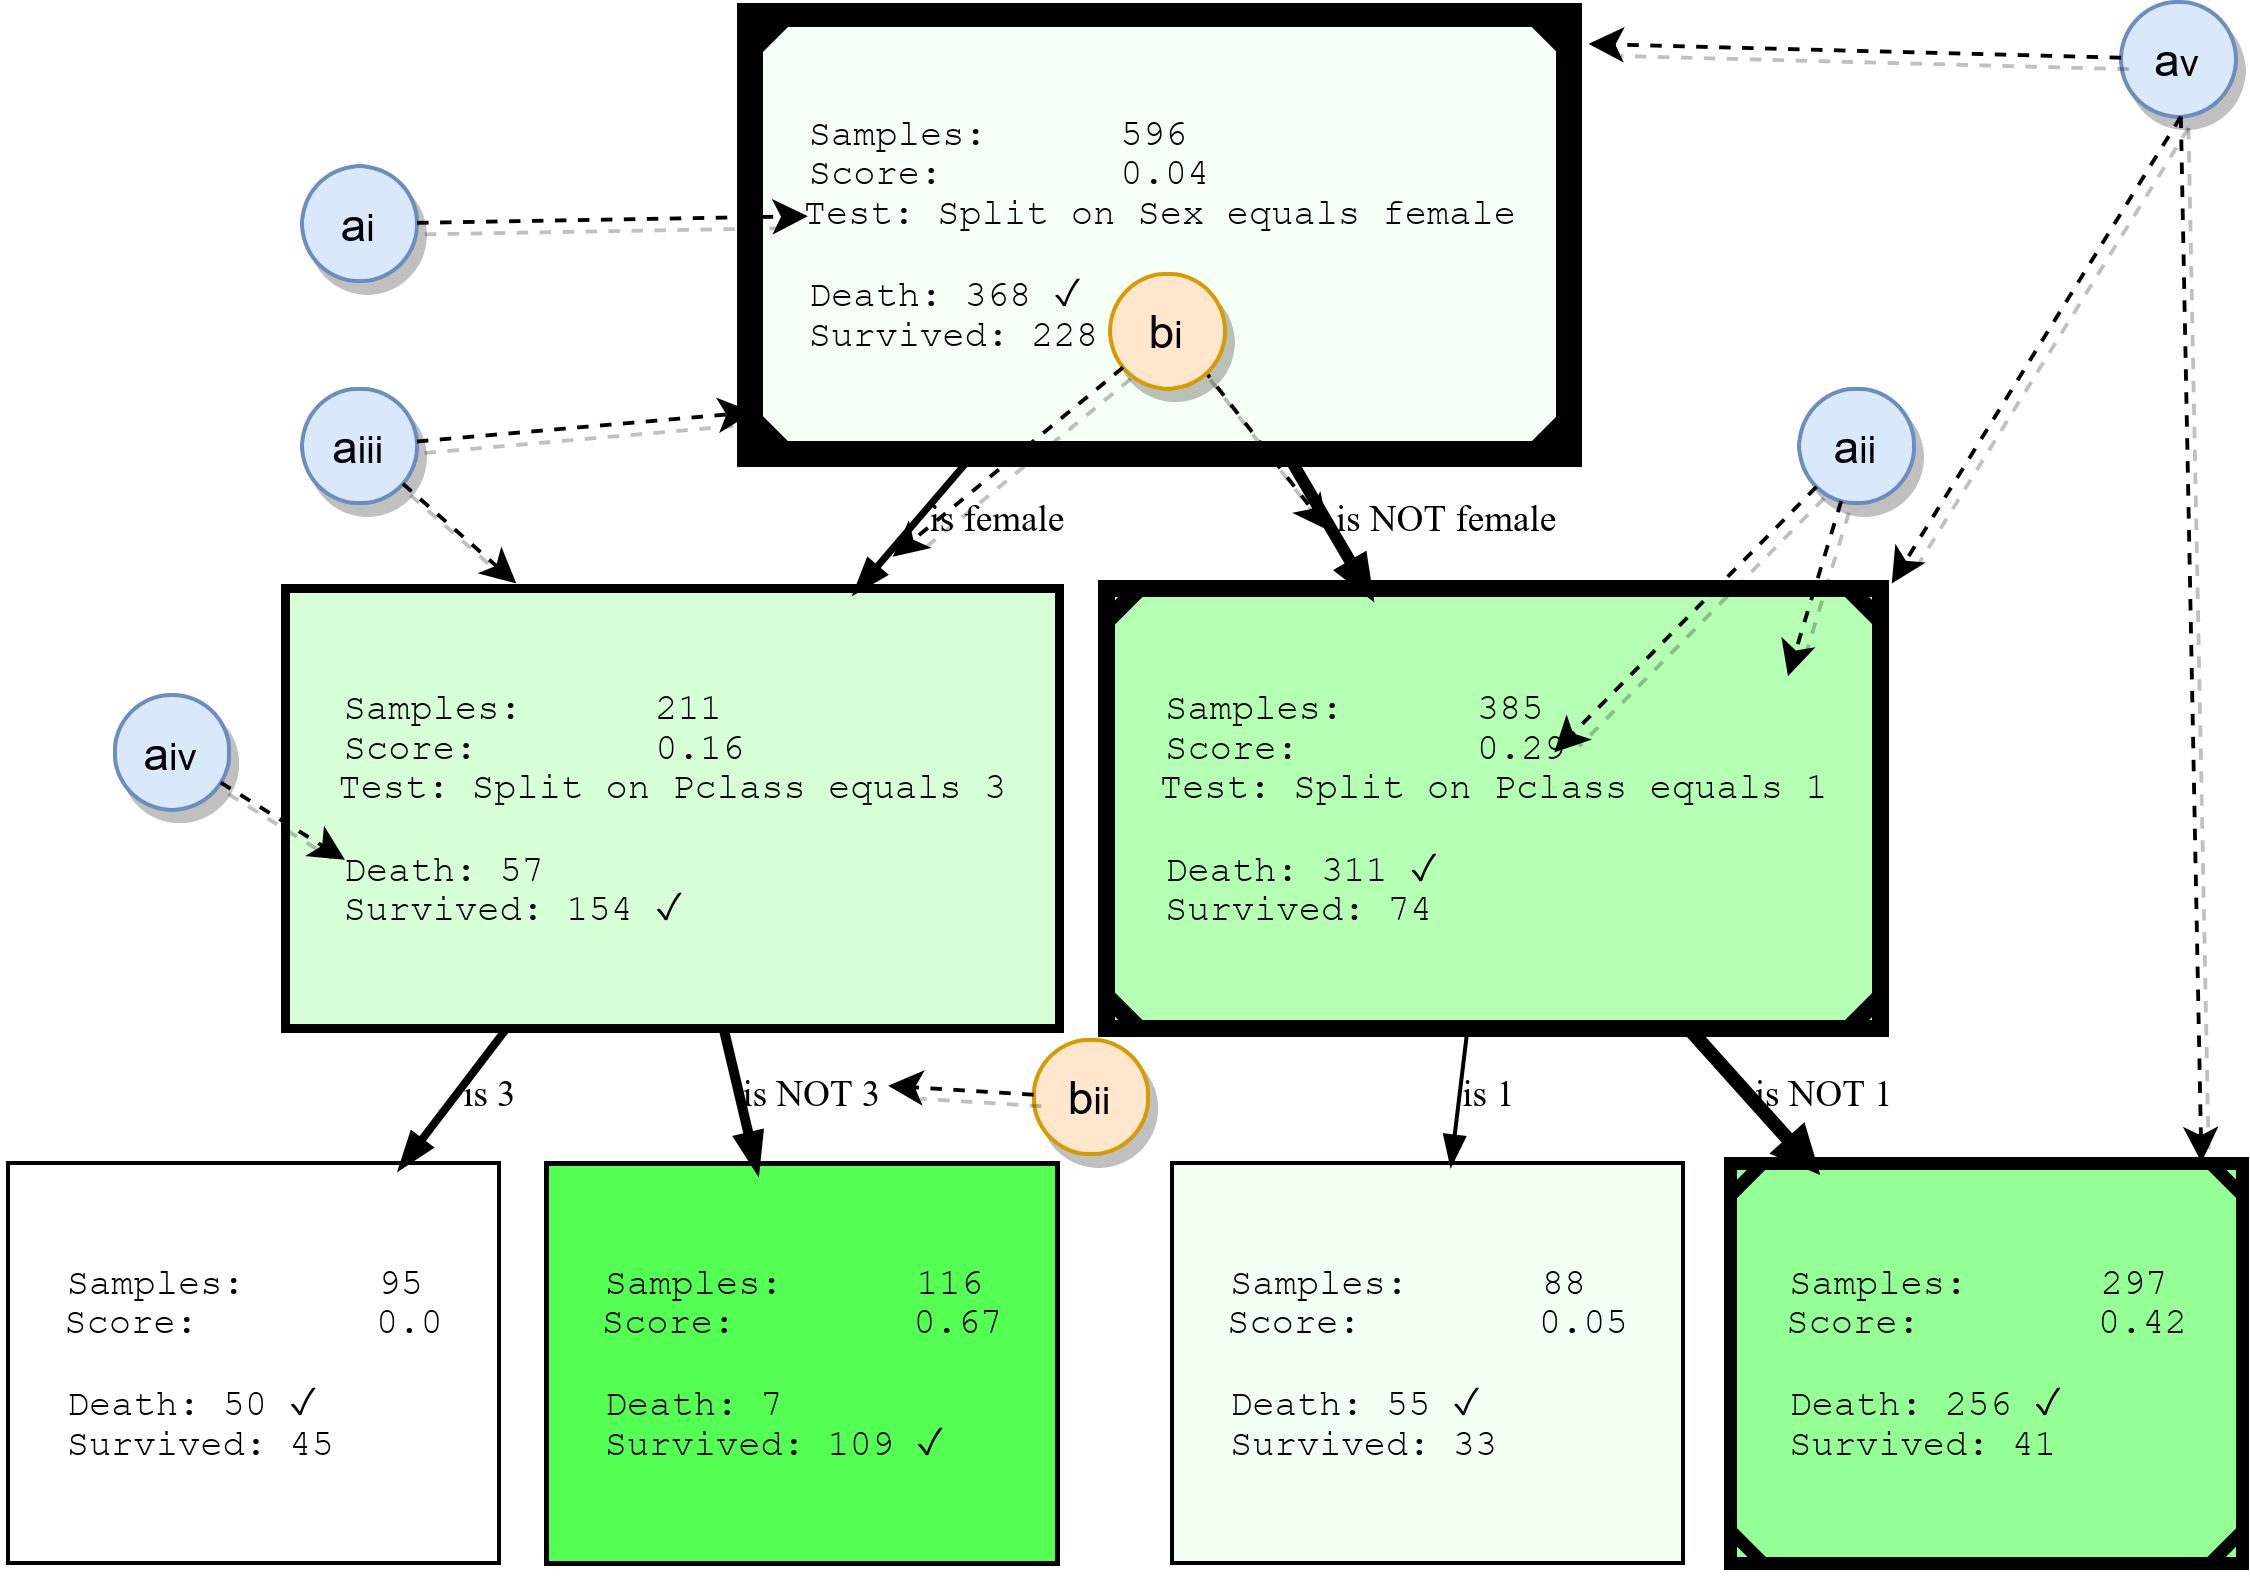
Nodes
- ai: , . . * * . . 3.
- aii: , , , , . , . . , ( , .. ). HDTree.
- aiii: The border of the nodes indicates how many data points go through this node. The thicker the border, the more data flows through the node.
- aiv: list of prediction targets and labels that have data points passing through this node. The most common class is marked.
- av: Optionally, the visualization can mark the path that individual data points follow (illustrating the decision that is made when the data point traverses the tree). This is marked with a line in the corner of the decision tree.
Ribs
- bi: an arrow connects each possible split result (ai) to its child nodes. The more data relative to the parent "flows" around the edge, the thicker it is displayed.
- bii: each edge has a human-readable textual representation of the corresponding split result.
Where are the different split sets and tests coming from?
At this point, you may already be wondering how HDTree differs from a tree
scikit-learn(or any other implementation) and why we might want to have different kinds of partitions? Let's try to clarify this. Maybe you have an intuitive understanding of feature space . All the data we work with is in a certain multidimensional space, which is determined by the number and type of features in your data. The task of the classification algorithm is now to divide this space into non-overlapping areas and assignthese areas are class. Let's visualize this. Since our brains have a hard time tinkering with high dimensionality, we'll stick with a 2D example and a very simple two-class problem, like so:

You see a very simple dataset made up of two dimensions (traits / attributes) and two classes. The generated data points were normally distributed in the center. A street that is just a linear function
f(x) = yseparates the two classes: Class 1 (bottom right) and Class 2 (top left). Some random noise has also been added (blue data points in orange and vice versa) to illustrate the effects of overfitting later on. The job of a classification algorithm like HDTree (although it can also be used for regression problems ) is to find out which class each data point belongs to. In other words, given a pair of coordinates (x, y)like(6, 2)... The goal is to find out if this coordinate belongs to orange class 1 or blue class 2. The discriminant model will try to divide the object space (here these are the (x, y) axes) into blue and orange territories, respectively.
Given this data, the decision (rules) on how the data will be classified seems very simple. A reasonable person would say "think for yourself first.""This is class 1 if x> y, otherwise class 2." The
y=xdotted function will create a perfect separation . Indeed, a maximum margin classifier such as support vector machines [8] would suggest a similar solution. But let's see which decision trees solve the question differently:

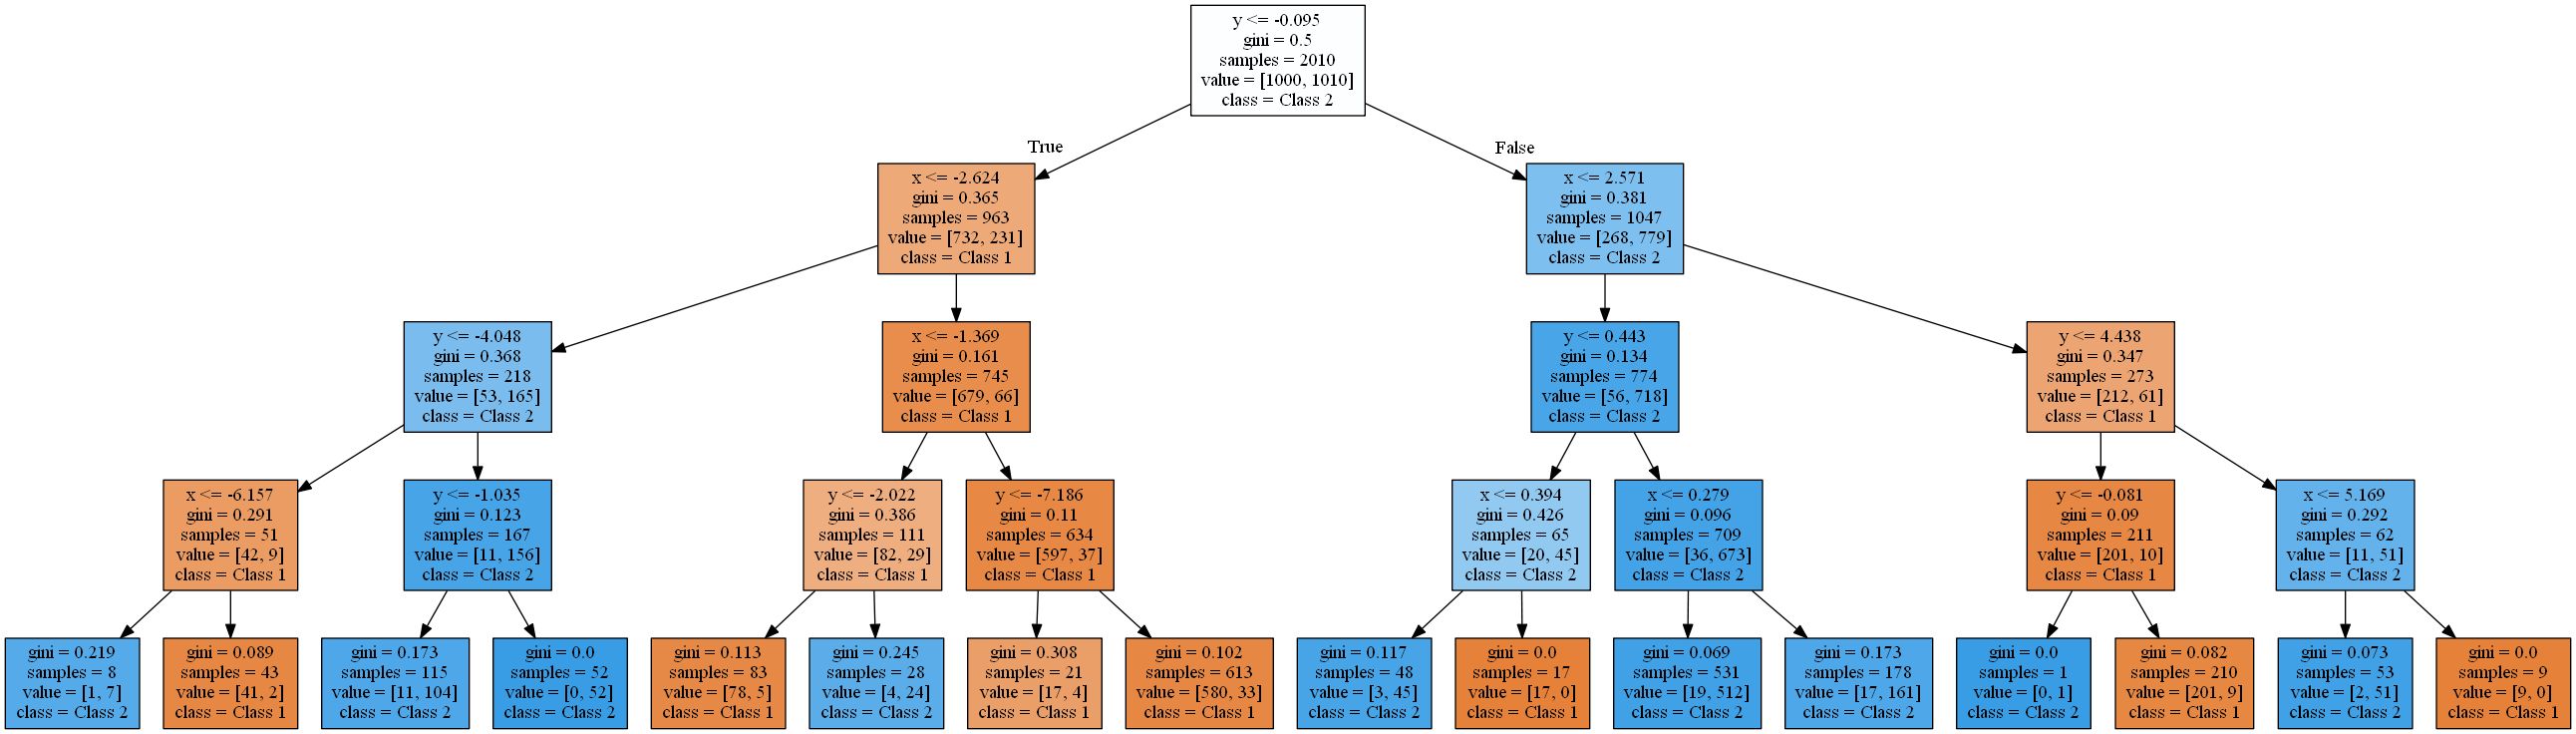
The image shows the areas where a standard decision tree with increasing depth classifies a data point as class 1 (orange) or class 2 (blue).
A decision tree approximates a linear function using a step function.This is due to the type of validation and partitioning rule that decision trees use. They all work in a pattern
attribute < thresholdthat will result in hyperplanes that are parallel to the axes . In 2D space, rectangles are "cut". In 3D, these would be cuboids and so on. In addition, the decision tree starts modeling noise in the data when there are already 8 levels, that is, overfitting occurs. However, it never finds a good approximation to a real linear function. To verify this, I used a typical 2-to-1 split of training and test data and calculated the accuracy of the trees. It is 93.84%, 93.03%, 90.81% for the test set and 94.54%, 96.57%, 98.81% for the training set(ordered by tree depths 4, 8, 16). While the accuracy in the test decreases , the training accuracy increases .
An increase in training efficiency and a decrease in test results is a sign of overtraining.The resulting decision trees are quite complex for such a simple function. The simplest of these (depth 4) rendered with scikit learn already looks like this:
I will rid you of the trees more difficult. In the next section, we'll start by solving this problem using the HDTree package. HDTree will allow the user to apply knowledge about the data (just like the knowledge about linear separation in the example). It will also allow you to find alternative solutions to the problem.
Application of the HDTree package
This section will introduce you to the basics of HDTree. I'll try to touch on some parts of its API. Please feel free to ask in the comments or contact me if you have any questions about this. I will be happy to answer and, if necessary, supplement the article. Installing HDTree is a little more complicated than
pip install hdtree. Sorry. First you need Python 3.5 or newer.
- Create an empty directory and inside it a folder named hdtree (
your_folder/hdtree) - Clone the repository to hdtree directory (not another subdirectory).
- Install the required dependencies:
numpy,pandas,graphviz,sklearn. - Add
your_foldertoPYTHONPATH. This will include the directory in the Python import engine. You will be able to use it like a regular Python package.
Alternatively add
hdtreeto site-packagesyour installation folder python. I can add the installation file later. At the time of writing, the code is not available in the pip repository. All of the code that generates the graphics and output below (as well as previously shown) is in the repository, and is directly posted here . Solving a linear problem with a sibling tree
Let's start right away with the code:
from hdtree import HDTreeClassifier, SmallerThanSplit, EntropyMeasure
hdtree_linear = HDTreeClassifier(allowed_splits=[SmallerThanSplit.build()], # Split rule in form a < b
    information_measure=EntropyMeasure(), # Use Information Gain for the scores attribute_names=['x', 'y' ]) # give the
    attributes some interpretable names # standard sklearn-like interface hdtree_linear.fit(X_street_train,
y_street_train) # create tree graph hdtree_linear.generate_dot_graph() 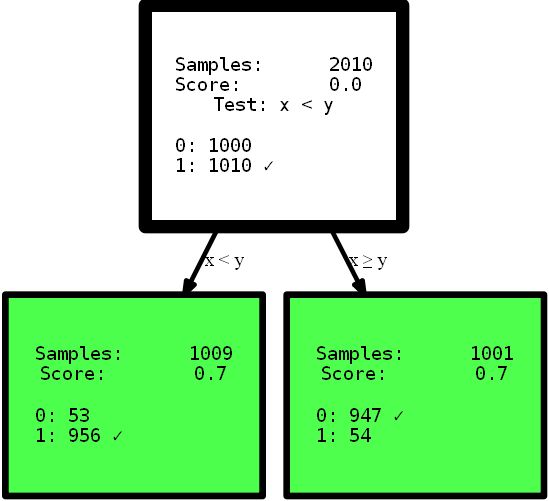
Yes, the resulting tree is only one level high and offers the perfect solution to this problem. This is an artificial example to show the effect. However, I hope it clarifies the point: have an intuitive view of the data, or simply provide a decision tree with different options for partitioning the feature space, which may offer a simpler and sometimes even more accurate solution . Imagine that you need to interpret the rules from the trees presented here to find useful information. Which interpretation you can understand first, and which one you trust more? A complex interpretation using multi-step functions, or a small precise tree? I think the answer is pretty simple. But let's dive a little deeper into the code itself. When initializing, the
HDTreeClassifiermost important thing you have to provide is allowed_splits. Here you provide a list containing the possible partitioning rules that the algorithm tries during training for each node to find a good local partitioning of the data. In this case, we have provided exclusively SmallerThanSplit. This split does exactly what you see: it takes two attributes (tries any combination) and splits the data according to the schema a_i < a_j. Which (not too randomly) matches our data as well as possible.
This type of split is referred to as multivariate splitIt means that separation uses more than one feature to make a decision. This is not like the one-way partitioning used in most other trees, such as
scikit-tree(see above for details) that take exactly one attribute into account . Of course, it HDTreealso has options to achieve "normal partitioning" like those in scikit trees — the family QuantileSplit. I'll show you more as the article progresses. Another unfamiliar thing you might see in the code is the hyperparameter information_measure. The parameter represents a dimension that is used to evaluate the value of a single node or a complete split (parent node with its child nodes). The chosen option is based on entropy [10]. You may have also heard ofthe Gini coefficient , which would be another valid option. Of course, you can provide your own dimension by simply implementing the appropriate interface. If you like, implement a gini-Index , which you can use in the tree without reimplementing anything else. Just copy EntropyMeasure()and adapt for yourself. Let's dig deeper into the Titanic disaster . I love to learn from my own examples. Now you will see a few more HDTree functions with a specific example, not on the generated data.
Data set
We'll be working with the famous machine learning dataset for the young fighter course: the Titanic disaster dataset. This is a fairly simple set, which is not too large, but contains several different data types and missing values, although not completely trivial. In addition, it is understandable to humans, and many people have already worked with it. The data looks like this:

You can see that there are all kinds of attributes. Numeric, categorical, integer types and even missing values (look at the Cabin column). The challenge is to predict whether a passenger survived the Titanic disaster based on available passenger information. You can find a description of value-attributes here . By studying ML tutorials and applying this dataset, you are doing all kinds ofpreprocessing to be able to work with common machine learning models, for example, removing missing values
NaNby replacing values [12], dropping rows / columns, unitary encoding [13] categorical data (for example, Embarkedand Sexor grouping data to obtain a valid dataset which accepts the ML model. This kind of cleanup is not technically required by HDTree. You can serve the data as is and the model will gladly accept it. Change the data only when designing real objects. I simplified everything to start.
Training the first HDTree on Titanic data
Let's just take the data as it is and feed it to the model. The basic code is similar to the code above, however, in this example, many more data splits will be allowed.
    hdtree_titanic = HDTreeClassifier(allowed_splits=[FixedValueSplit.build(), # e.g., Embarked = 'C'
    SingleCategorySplit.build(), # e.g., Embarked -> ['C', 'Q', 'S']
    TwentyQuantileRangeSplit.build(), # e.g., IN Quantile 3-5
    TwentyQuantileSplit.build()], # e.g., BELOW Quantile 7
    information_measure=EntropyMeasure(),
    attribute_names=col_names,
    max_levels=3) # restrict to grow to a max of 3 levels
    hdtree_titanic.fit(X_titanic_train.values, y_titanic_train.values)
    hdtree_titanic.generate_dot_graph()
Let's take a closer look at what is happening. We created a decision tree with three levels, which we chose to use 3 of 4 possible SplitRules. They are marked with the letters S1, S2, S3. I will briefly explain what they do.
- The S1:
FixedValueSplit. This division works with categorical data and chooses one of the possible values. The data is then split into one part that has this value and another part that has no value set. For example, PClass = 1 and Pclass ≠ 1 . - S2: ()
QuantileRangeSplit. . , . 1 5 . ( ) (measure_information). (i) (ii) — . . - S3: (Twenty)
QuantileSplit. Similar to Split Range (S2), but splits data by threshold. This is basically what regular decision trees do, except that they usually try all possible thresholds instead of a fixed number.
You may have noticed that you are
SingleCategorySplitnot involved. I'll take a chance to clarify anyway, as the omission of this division will come up later:
- S4:
SingleCategorySplitWill work similarlyFixedValueSplit, but will create a child node for every possible value, for example: for the PClass attribute it will be 3 child nodes (each for Class 1, Class 2 and Class 3 ). Note that itFixedValueSplitis identicalSingleValueSplitif there are only two possible categories.
Individual divisions are somewhat "smart" with respect to the data types / values that "accept". Until some extension, they know under what circumstances they apply and not apply. The tree was also trained with a 2-to-1 split of the training and test data. Performance was 80.37% accuracy on training data and 81.69 on test data. Not so bad.
Limiting splits
Let's assume that you are not too happy with the solutions found for some reason. Maybe you decide that the very first split at the top of the tree is too trivial (split by attribute
sex). HDTree solves the problem. The simplest solution would be to prevent FixedValueSplit(and, for that matter, the equivalent SingleCategorySplit) from appearing at the top. It's pretty simple. Change the initialization of the splits like this:
    - SNIP -
    ...allowed_splits=[FixedValueSplit.build_with_restrictions(min_level=1),
    SingleCategorySplit.build_with_restrictions(min_level=1),...],
    - SNIP -
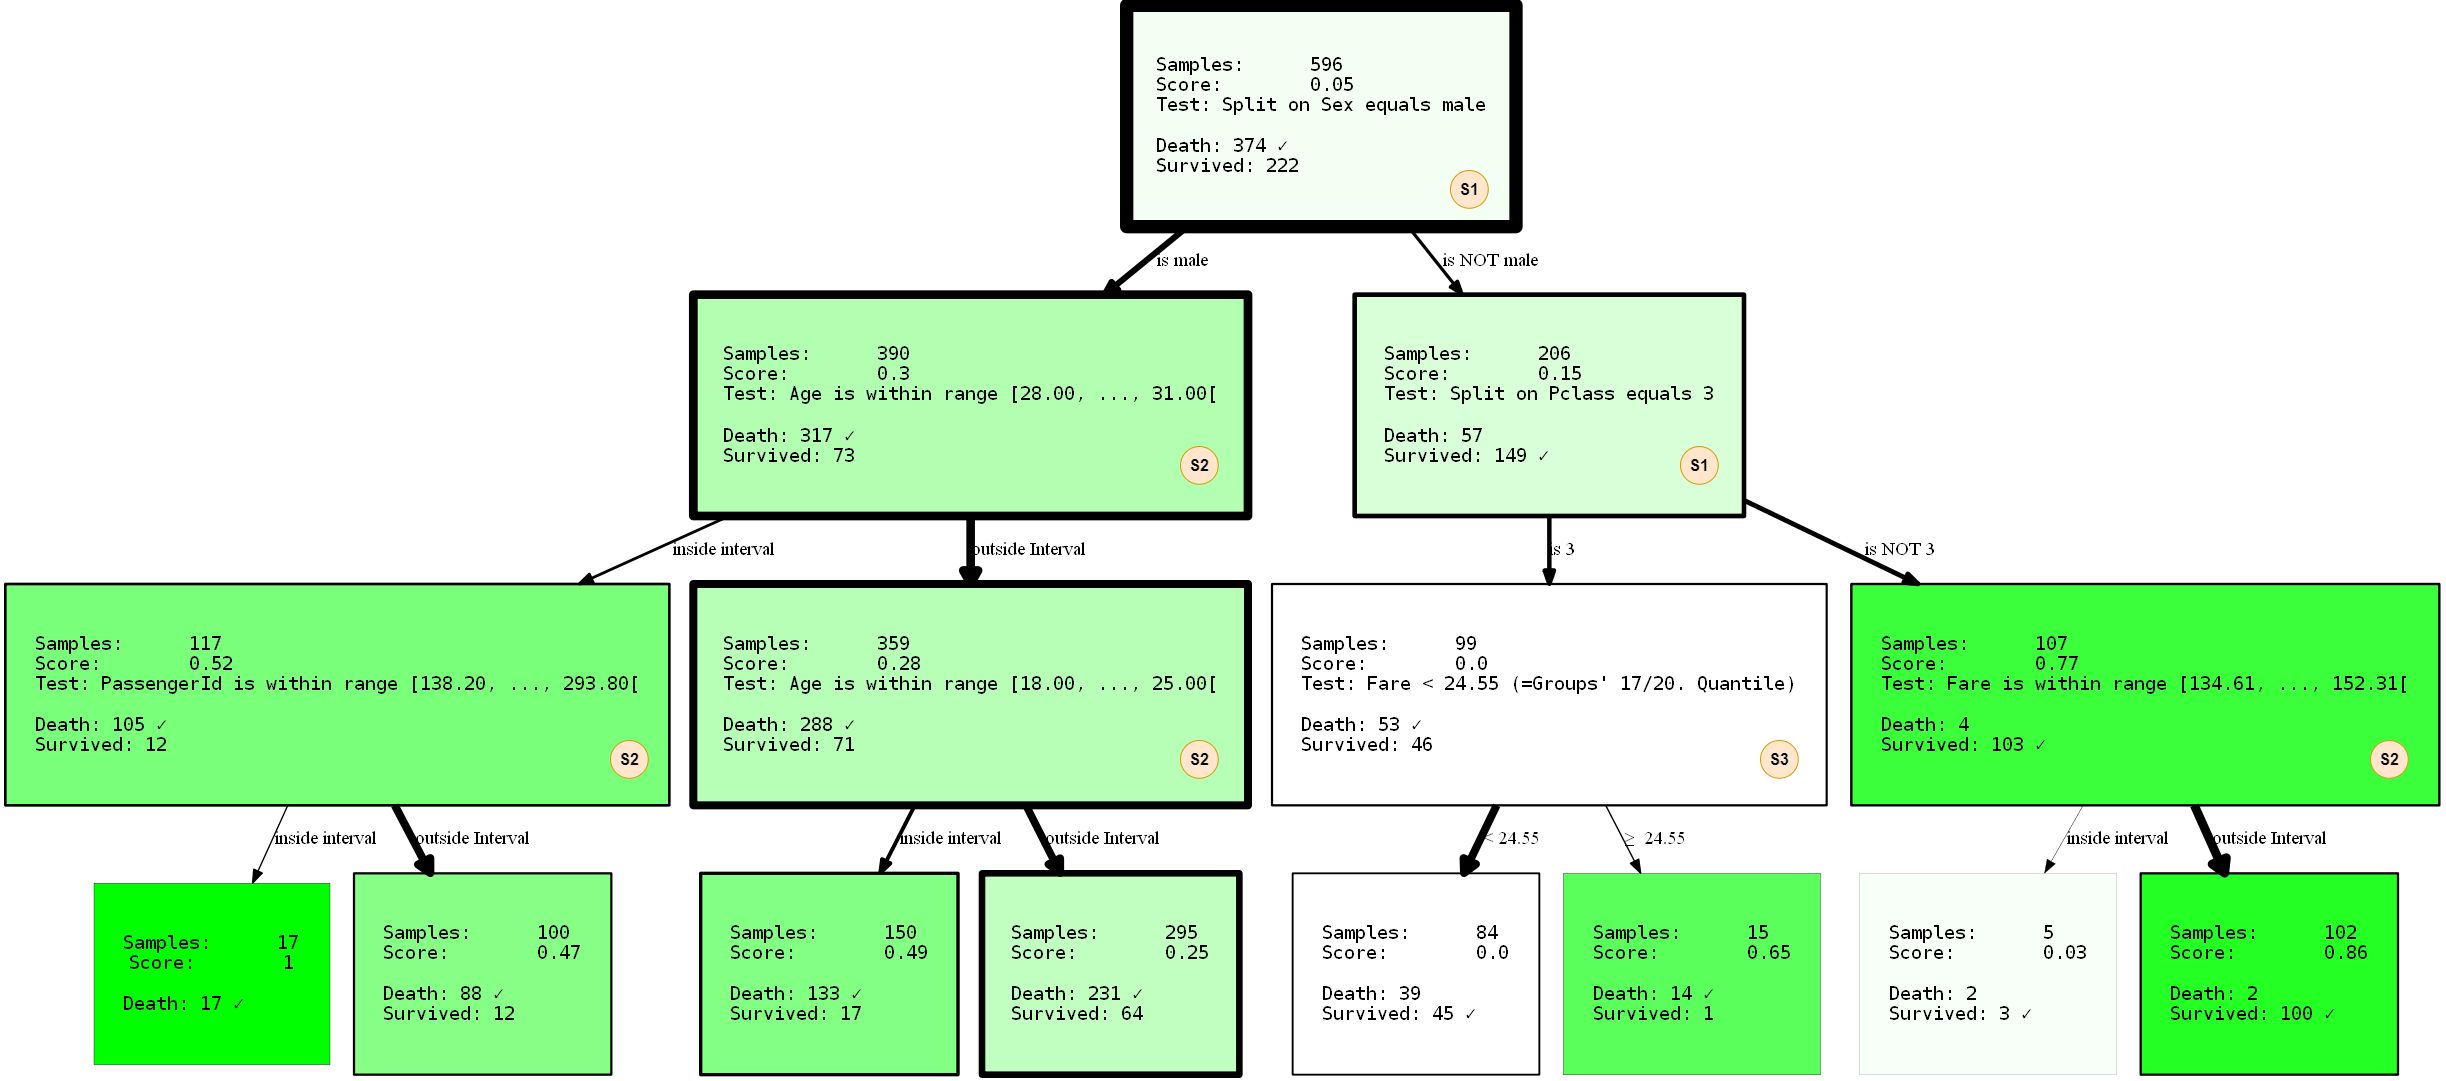
I will present the resulting HDTree in its entirety, since we can observe the missing split (S4) inside the newly generated tree.
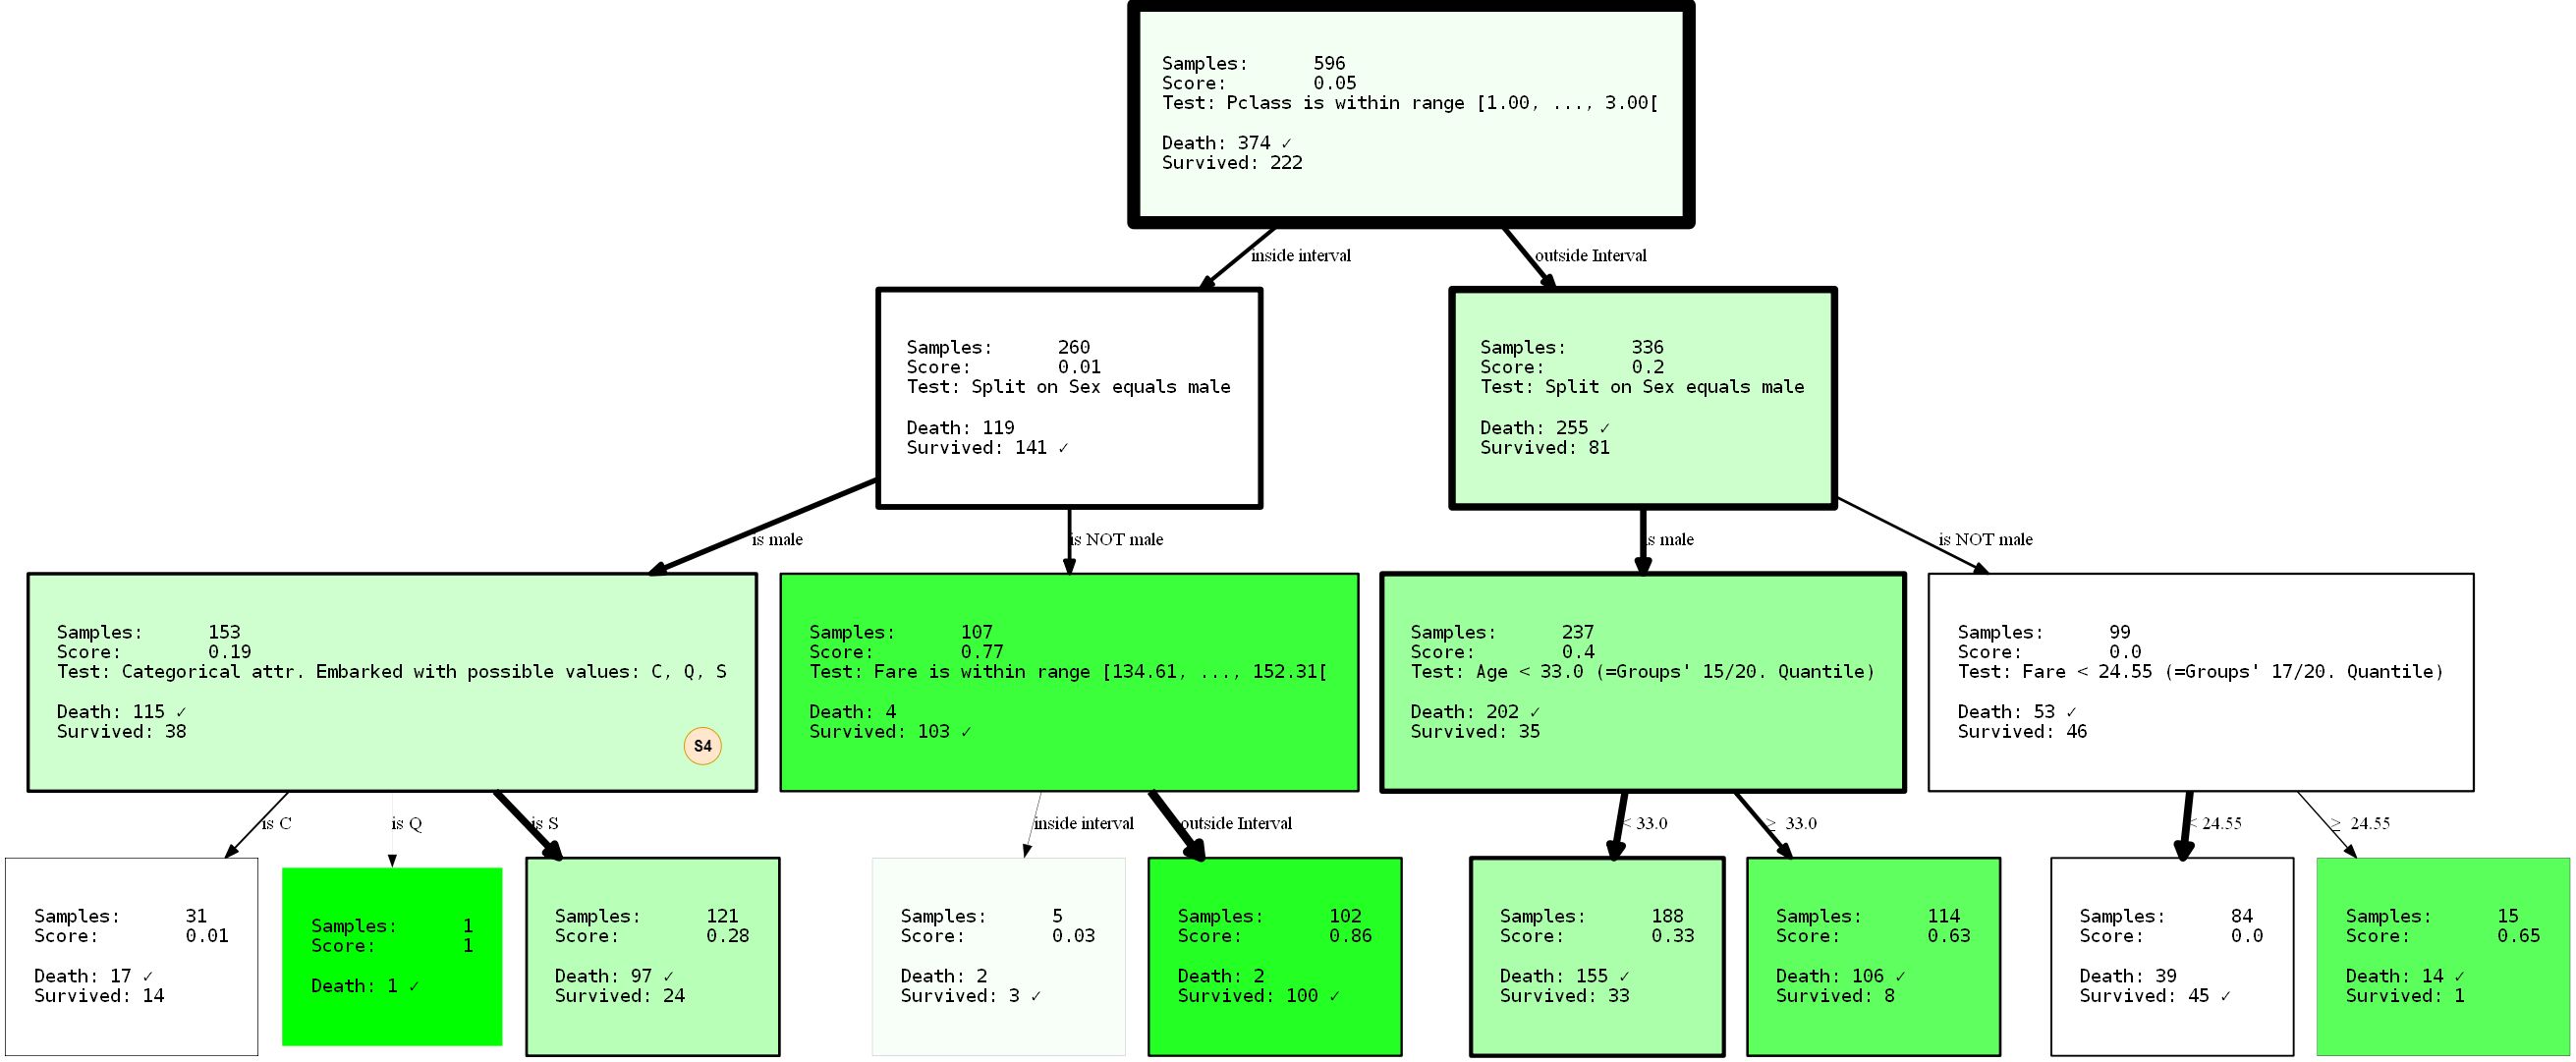
By preventing the split from
sexappearing at the root thanks to the parameter min_level=1(hint: of course you can also provide max_level), we have completely restructured the tree. Its performance is now 80.37% and 81.69% (training / test). It did not change at all, even if we took the supposedly better separation at the root node.
Because decision trees are greedy, they will only find the local _ best partition for each node, which is not necessarily the _ best _ option at all. In fact, finding an ideal solution to a decision tree problem is an NP-complete problem, as was proved in [15].So the best we can ask for are heuristics. Let's go back to the example: notice that we've already got a non-trivial representation of the data? It's trivial though. to say that men will only have a low chance of survival, to a lesser extent, it may be concluded that being a first or second grade person
PClassflying out of Cherbourg ( Embarked=C) may increase your chances of survival. Or what if you are a male PClass 3under 33, your chances also increase? Remember: women and children first. A good exercise is to draw these conclusions yourself by interpreting the visualization. These conclusions were only possible due to the tree limitation. Who knows what else can be revealed by applying other restrictions? Try it!
As a final example of this kind, I want to show you how to restrict the partitioning to specific attributes. This is applicable not only to prevent tree learning on unwanted correlations or forced alternatives , but also narrows the search space. The approach can dramatically reduce execution time, especially when using multivariate partitioning. If you go back to the previous example, you might find a node that checks for an attribute
PassengerId. Perhaps we don't want to model it, since at least it shouldn't contribute to information about survival. Checking for passenger ID can be a sign of retraining. Let's change the situation with a parameter blacklist_attribute_indices.
    - SNIP -
    ...allowed_splits=[TwentyQuantileRangeSplit.build_with_restrictions(blacklist_attribute_indices=['PassengerId']),
    FixedValueSplit.build_with_restrictions(blacklist_attribute_indices=['Name Length']),
    ...],
    - SNIP -
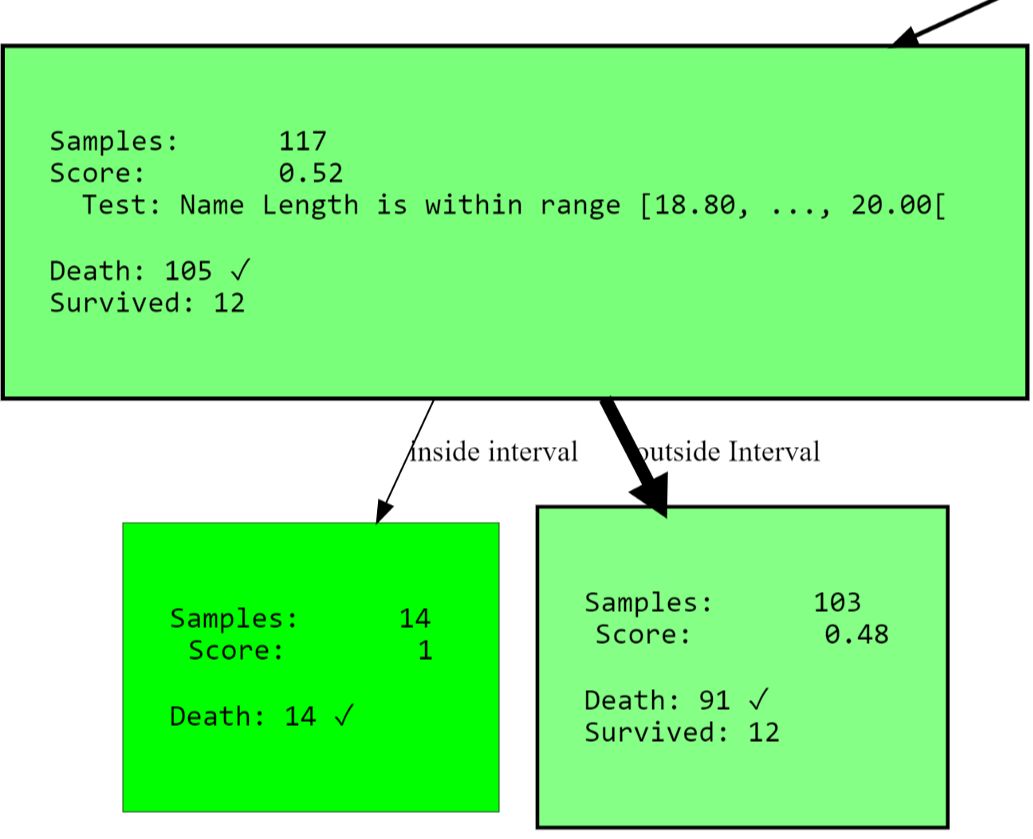
You may ask why
name lengthit appears at all. Keep in mind that long names (double names or [noble] titles) can indicate a rich past, increasing your chances of survival.
Additional tip: you can always add the same thingSplitRuletwice. If you only want to blacklist an attribute for certain HDTree levels, just addSplitRuleno level limit.
Data Point Prediction
As you may have already noticed, the scikit-learn generic interface can be used for prediction. This
predict(), predict_proba()as well score(). But you can go further. There is explain_decision()one that will display a textual representation of the solution.
print(hdtree_titanic_3.explain_decision(X_titanic_train[42]))
This is assumed to be the last change to the tree. The code will output this:
Query:
Query:
 {'PassengerId': 273, 'Pclass': 2, 'Sex': 'female', 'Age': 41.0, 'SibSp': 0, 'Parch': 1, 'Fare': 19.5, 'Cabin': nan, 'Embarked': 'S', 'Name Length': 41}

Predicted sample as "Survived" because of:
Explanation 1:
Step 1: Sex doesn't match value male
Step 2: Pclass doesn't match value 3
Step 3: Fare is OUTSIDE range [134.61, ..., 152.31[(19.50 is below range)
Step 4: Leaf. Vote for {'Survived'}
This works even for missing data. Let's set attribute index 2 (
Sex) to missing (None):
    passenger_42 = X_titanic_train[42].copy()
    passenger_42[2] = None
    print(hdtree_titanic_3.explain_decision(passenger_42))
Query:
 {'PassengerId': 273, 'Pclass': 2, 'Sex': None, 'Age': 41.0, 'SibSp': 0, 'Parch': 1, 'Fare': 19.5, 'Cabin': nan, 'Embarked': 'S', 'Name Length': 41}

Predicted sample as "Death" because of:
Explanation 1:
Step 1: Sex has no value available
Step 2: Age is OUTSIDE range [28.00, ..., 31.00[(41.00 is above range)
Step 3: Age is OUTSIDE range [18.00, ..., 25.00[(41.00 is above range)
Step 4: Leaf. Vote for {'Death'}
---------------------------------
Explanation 2:
Step 1: Sex has no value available
Step 2: Pclass doesn't match value 3
Step 3: Fare is OUTSIDE range [134.61, ..., 152.31[(19.50 is below range)
Step 4: Leaf. Vote for {'Survived'}
---------------------------------
This will print all the decision paths (there is more than one, because on some nodes the decision cannot be made!). The end result will be the most common class of all leaves.
... other useful things
You can go ahead and get the tree view as text:
    Level 0, ROOT: Node having 596 samples and 2 children with split rule "Split on Sex equals male" (Split Score:
    0.251)
    -Level 1, Child #1: Node having 390 samples and 2 children with split rule "Age is within range [28.00, ..., 31.00["
    (Split Score: 0.342)
    --Level 2, Child #1: Node having 117 samples and 2 children with split rule "Name Length is within range [18.80,
    ..., 20.00[" (Split Score: 0.543)
    ---Level 3, Child #1: Node having 14 samples and no children with
    - SNIP -
Or access all clean nodes (with a high score):
[str(node) for node in hdtree_titanic_3.get_clean_nodes(min_score=0.5)]
    ['Node having 117 samples and 2 children with split rule "Name Length is within range [18.80, ..., 20.00[" (Split
    Score: 0.543)',
    'Node having 14 samples and no children with split rule "no split rule" (Node Score: 1)',
    'Node having 15 samples and no children with split rule "no split rule" (Node Score: 0.647)',
    'Node having 107 samples and 2 children with split rule "Fare is within range [134.61, ..., 152.31[" (Split Score:
    0.822)',
    'Node having 102 samples and no children with split rule "no split rule" (Node Score: 0.861)']
HDTree extension
The most significant thing you might want to add to the system is your own
SplitRule. The separation rule can really do whatever it wants to separate ... Implement SplitRulethrough implementation AbstractSplitRule. This is a bit tricky since you have to handle data ingestion, performance evaluation and all that stuff yourself. For these reasons, there are mixins in the package that you can add to the implementation depending on the split type. The mixins do most of the hard part for you.
Bibliography
- [1] Wikipedia article on Decision Trees
- [2] Medium 101 article on Decision Trees
- [3] Breiman, Leo, Joseph H Friedman, R. A. Olshen and C. J. Stone. “Classification and Regression Trees.” (1983).
- [4] scikit-learn documentation: Decision Tree Classifier
- [5] Cython project page
- [6] Wikipedia article on pruning
- [7] sklearn documentation: plot a Decision Tree
- [8] Wikipedia article Support Vector Machine
- [9] MLExtend Python library
- [10] Wikipedia Article Entropy in context of Decision Trees
- [12] Wikipedia Article on imputing
- [13] Hackernoon article about one-hot-encoding
- [14] Wikipedia Article about Quantiles
- [15] Hyafil, Laurent; Rivest, Ronald L. “Constructing optimal binary decision trees is NP-complete” (1976)
- [16] Hackernoon Article on Decision Trees
Find out the details of how to get a high-profile profession from scratch or Level Up in skills and salary by taking online SkillFactory courses:
- Machine Learning Course (12 weeks)
- Advanced Course "Machine Learning Pro + Deep Learning" (20 weeks)
- « Machine Learning Data Science» (20 )
- «Python -» (9 )
E
- Data Science (12 )
- - (8 )
- (9 )
- DevOps (12 )
- Java- (18 )
- JavaScript (12 )
- UX- (9 )
- Web- (7 )