In this post, I would like to share my experience in collecting and analyzing the base of games of the Metacritic.com site, tell you what happened and what else is in the plans. I hope that the material will find its readers, and possible feedback will indicate weaknesses and potential directions for further analysis.
Background
Many of us this spring and summer got a few free hours a day at our disposal - working from home, business downturn and other reasons everyone knows. I decided to use my free time for good - to tighten up R, which I had not used since my university days, and at the same time to practice on real data (it’s worthless for certificates without real projects).
Why did I choose this particular base? Because I love games. And also, because in June there was a scandal around the game The Last of Us. Part II , which received almost complete critical acclaim, and was extremely negatively received by part of the gaming community.
I was interested in finding an answer to several questions:
- How do the ratings of the press and the players correspond to each other?
- Is there a significant dynamic in a) press assessments; b) the assessments of the players; c) the difference in estimates?
And I started looking for answers.
First try. Relative success
I decided to look for answers on metacrtitic.com - this is a large site that aggregates ratings of gaming publications and makes it possible for users to rate games (and not only them) (important note: in order to rate a game, it is not at all necessary to confirm ownership of it). It seemed that the task would be simple: "Parse the metacritic and feel the base with your hands!"
No sooner said than done. Probably, for the audience of Habr it will not be a secret: today, in order to write working (! = Good) code, it is not at all necessary to be a programmer. At least, I fully believed in this, solving my problem.
Armed with Google, stackoverflow, and what I can learn on DataCamp, in a day I collected a database of ~ 16 thousand lines, where for each post I saved the name, platform, user rating, critics' rating and release date, and immediately built two graphics, which he then posted on one of the Russian platforms for gaming and near-game themes.
First results
There was no intelligible analysis behind the graphs - only a careful description of the observed effects. However, the community warmly accepted the visualization (and someone even developed the idea and subsequently rolled out a neural network that generates reviews for games ), which gave an incentive not to abandon everything halfway and continue digging into the database.
Second try. Interesting is just beginning
I believe that for the Habr audience this will not be a secret: arrogance is bad, and writing a working (! = Good) code is not an easy task, no matter how useful stackoverflow, google and guides are “it's easy to parse pages on the Internet, you just need … ”
I published the first resulting graphs on June 24 and 25, and the next week I could hardly think about anything other than collecting more information.
However, the code I wrote was behaving completely awful. Is he:
- Worked slowly (and this was obvious);
- I collected duplicates of some records and completely ignored others (and this was not obvious, because after compiling the base of links to pages with games, I cleaned out duplicates from them, and when the number of lines goes to tens of thousands it is impossible to say with certainty if you missed something) ...
In the end, The Last of Us helped to find the second problem. Part 2, which I could not find in the compiled database - and after a couple of iterations I managed to come up with a code that would work correctly.
The solution to the first problem may seem trivial to anyone who makes money by programming - but I'm not one of them, so I suggest you just grin with me (frankly, it was a real “Aha!” Moment, although the problem itself is just ridiculous).
History did not save the code, but I still have a screenshot - you can evaluate it under the spoiler (be careful, an attack of Spanish shame is possible ).
You have been warned
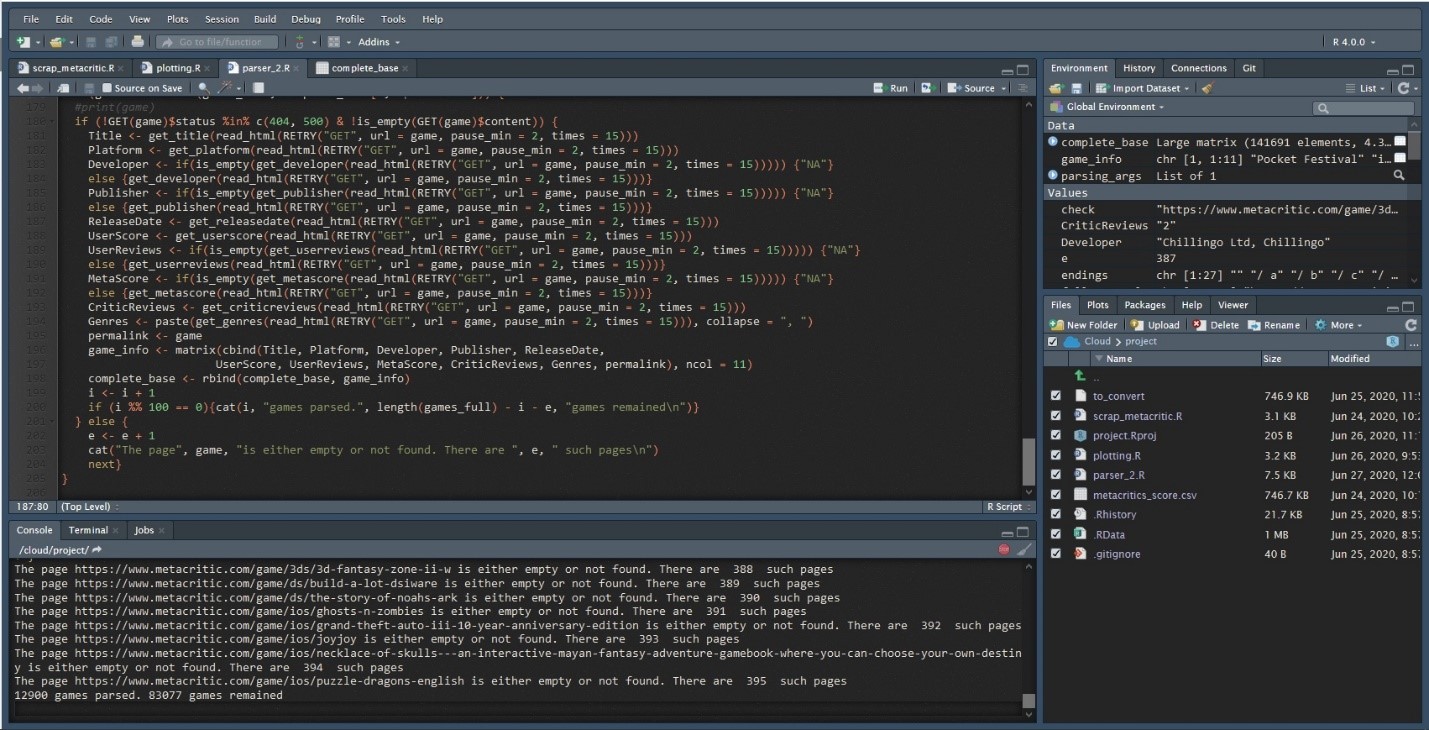
Ultimately, both problems were resolved. The parser code is posted on GitHub . I'm sure there are still a lot of controversies in it, but now it seems to work (which definitely adds points to my PSI).
Outpatient card or description of the Metacritic.com database
The final list of pages with games that needed to be parsed was compiled on July 1 and included 96,719 entries - links to the game page on Metacritic.com (I collected the link base from the alphabetical index for each platform available, so the same game can be found in the database for each individual platform; in fairness, it should be noted that the estimates in these cases are also independent).
> length(all_platforms)
[96719]
This is interesting: in fact, there were 96,718 records in this database suitable for work. Metacritic stores a game called *** in an alphabetical list for the PC (yes, these are three asterisks - and no, this is not censorship), but the link is in this the list points to the PC games page, not the existing game page . I don't see much point in adding it "by hand" - the game has neither user rating nor criticism; therefore, there is practically no benefit for the analysis (taking into account the size of the database, of course).
Of the 96,718 remaining lines, 213 links lead to a 404 page or "swear" at 500 server errors - these pages are skipped when the database is collected and updated.
> length(all_platforms) - nrow(base_df)
[1] 213
How are these games divided by platform? Let's take a look at the top:

In terms of the number of games, PC is expectedly in first place, and then, quite unexpectedly (for me), iOS follows, overtaking all consoles of the current generation. In addition, even without a separate breakdown by year, it can be seen that the number of games increases with each subsequent generation.
Let's look at the number of games by release time - by year, half year and month of the game's release:
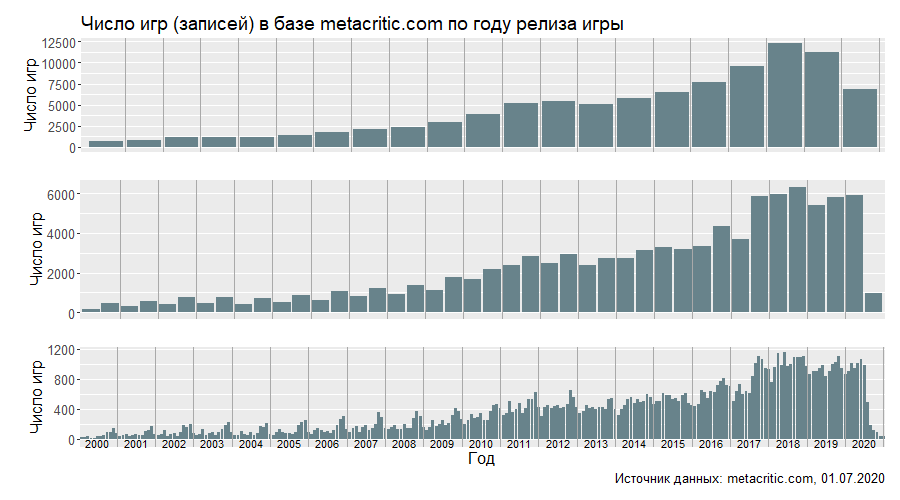
In 2019, a drawdown is clearly visible compared to 2018 - perhaps the Metacritic database will still be replenished, but so far the difference is quite noticeable. It will be interesting to look at the results of 2020.
In addition to the expected increase in the number of games year on year, it is also clear that the second half of the year is somewhat more popular - the strategy of releasing games for the New Year holidays is clearly read (or rather, the release with a certain "lag" - release in October-November so that the game has time to collect press and recommendations). It is impossible to say about the success of such a strategy based on metacritic data - you need to look at the sales data, but this consistent behavior of publishers makes you believe in its effectiveness.
There are no such clear peaks in the first half of the year - after all, Christmas / New Year holidays are the most universal celebrations in the world, clearly associated with gifts.
It is interesting:in the metacritic database only 18 games do not have a full release date. 17 of them are games on PC, one more - on Wii U. Four of them have the year indicated, one more has the status of "TBA 2011", the rest - TBA or TBA - Early Access. Not bad for such an impressive base!
Among the remaining 96,505 entries, 25,943 (26.9%) have critic ratings, 29,129 (30.2%) have user ratings, and 20,739 (21.5%) games have both ratings.
: 1/5 metacrtitic.com , . , 20 – , . , metacritic.com ( metacritic.com, , ). , (, ), . , , – metascore, .Information about the number of entries,% of rated games (gray label with a number between the platform name and the bar - it is also shown with a colored fill) in a graphical representation.
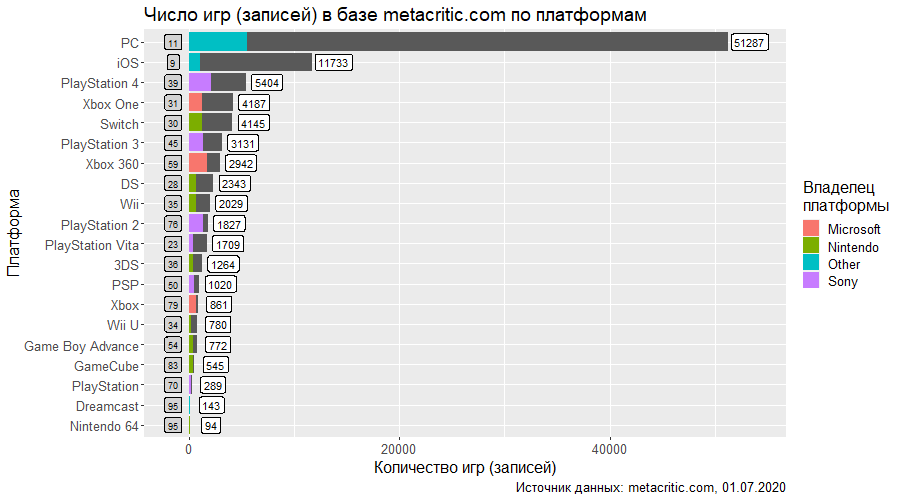
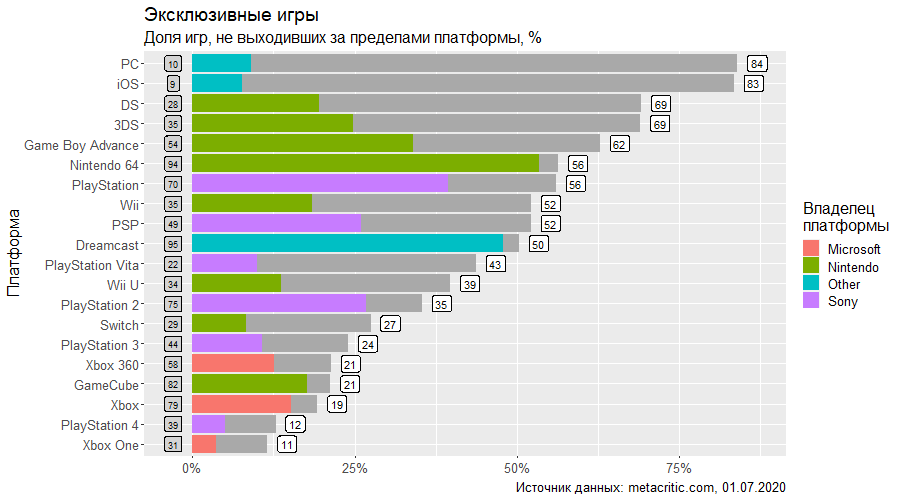
I was also interested to see the share of exclusives on each platform. Here again, PC and iOS are the leaders - PC obviously due to the platform's peculiarities (the developer does not owe anything to the platform holder - because the platform holder, in the sense similar to consoles, simply does not exist); and iOS due to the fact that mobile gaming is a completely separate world, only partially intersecting with classic gaming (at least in the sense of titles released on the platform). Further, it is clearly seen that the newer the generation, the more multi-platform games on it - although Nintendo stands apart here, which also has many portable consoles in its portfolio, with its own set of exclusive series. Please note that the main consoles of the outgoing generation - PS4 and Xbox One, round out the list,showing almost the same result - 12% and 11% of exclusives, respectively. But it is important to make an adjustment for the number of games published on the platform - the console from Sony is ahead of the competitor from Microsoft in this indicator - accordingly, and the absolute number of exclusives is greater here. But in general, the policy is comparable - except that the company from Redmond spends less on marketing support for games available only on its platform.
Below is a graph of the distribution of ratings (user ratings are reduced to a 100-point scale) - one cannot say that there are no differences in ratings at all, but they are quite close.
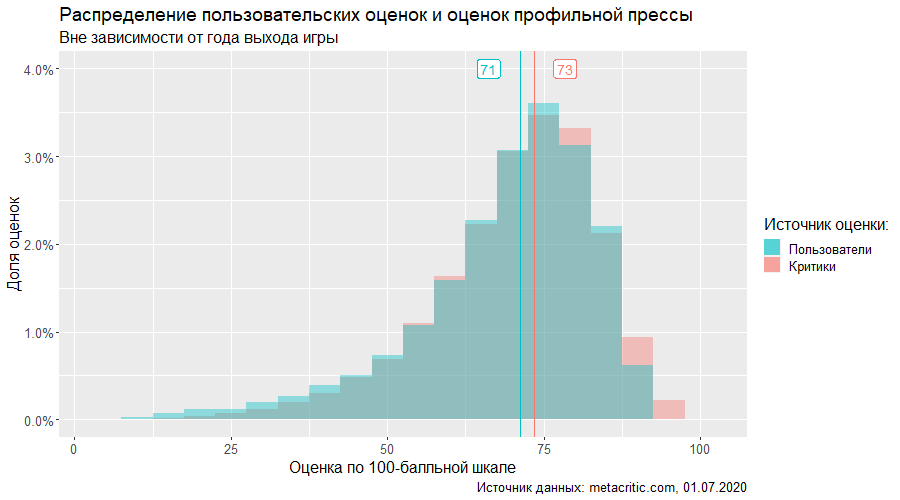
To make an unambiguous conclusion about the difference in scores, we compare the average scores with the paired t-test (since we compare the mean values of two features for the same objects). Separately, I note that the given averages are weighted by the number of game ratings. The result - taking into account the size of the database - is expected, the differences are significant:
> t.test(x = both_scores$UserScore * 10,
       y = both_scores$MetaScore,
       paired = TRUE)
	Paired t-test

data:  both_scores$UserScore * 10 and both_scores$MetaScore
t = -17.603, df = 20738, p-value < 2.2e-16
alternative hypothesis: true difference in means is not equal to 0
95 percent confidence interval:
 -1.823471 -1.458075
sample estimates:
mean of the differences
              -1.640773
At this stage, two conclusions suggest themselves:
- The distribution of assessments, regardless of the source, is shifted to the right, the ten-point scale is used very limitedly - the assessments of games tend to the upper part of the scale.
- Users and critics tend to rate games differently - on average, the user score is ~ 1.6 below MetaScore on a 100-point scale (which, however, may be a minor difference for one of the consumers of these ratings - a player trying to get an idea of the game before buying).
What's next? Let's go all the way.
Breaking bad
First of all, I want to look at the histogram at full scale.
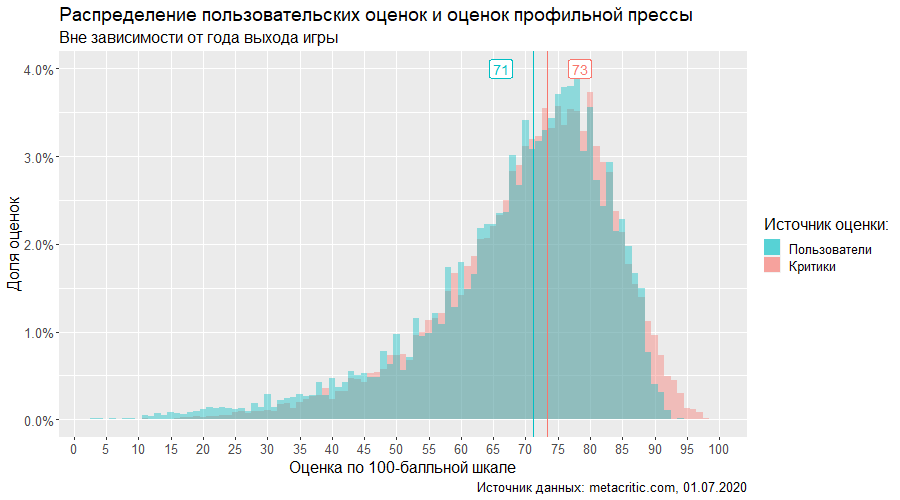
Several interesting things can be seen on the graph. Some estimates are clearly more common than neighboring ones. This is quite understandable with "round" numbers - 40, 50, 70 points are popular with users. The graph clearly shows that the game is less likely to receive a score of 79 points - if it has reached this value, then it is not a pity to throw an extra one either for those who write reviews professionally, or those who simply share their opinions. But if you can't pull it in any way, then the game will most likely receive a grade one point lower - hence the peaks in points ending in 8 or 3. Everyone loves pretty numbers!
Further in the program - histograms of the distribution of estimates separately for each year, starting in 2001 (frankly, I was guided by the beauty of the visualization rather than any other reason). Here we are witnessing an amazing journey of the average user rating from an exorbitant 83 points in 2001 to a terrifying 47 points in 2020 - we will return to the latter, but for now, remember that at the time of collecting the base, exactly half a year had passed, and some games have yet to be released. Against this background, the critics' ratings look remarkably stable, ranging from 70 points in 2007 to 75 in 2020, which is not yet over.

What about platforms? Here one can clearly see the critics' favorites - these are games published on the Nintendo 64 (let me remind you, however, that there are only 94 of them - with estimates from both sources - in the database) and ... iOS, oddly enough. Gamers' sympathies are back on the retro side - just compare the impressive 86 points average on the PlayStation with the paltry 66 on PS4 games! A similar dynamic is seen in the Xbox family. Separately, the Nintendo Switch and Xbox 360 show an astounding consensus between critics and users.
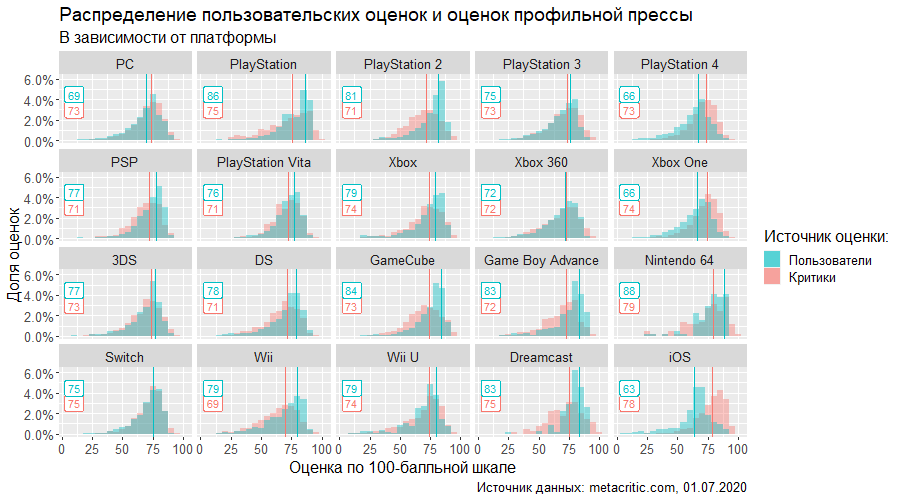
Perhaps the reason for the higher user ratings for older games lies in the plane of psychology - my hypothesis is that people gave them ratings years, and possibly decades after the release, evaluating their memories of the game and a happy childhood rather than the game itself. In order to confirm or disprove this hypothesis, however, it is necessary to obtain metadata for each user survey - the existing base for inference is not enough.
Let's get back to the analysis by year.
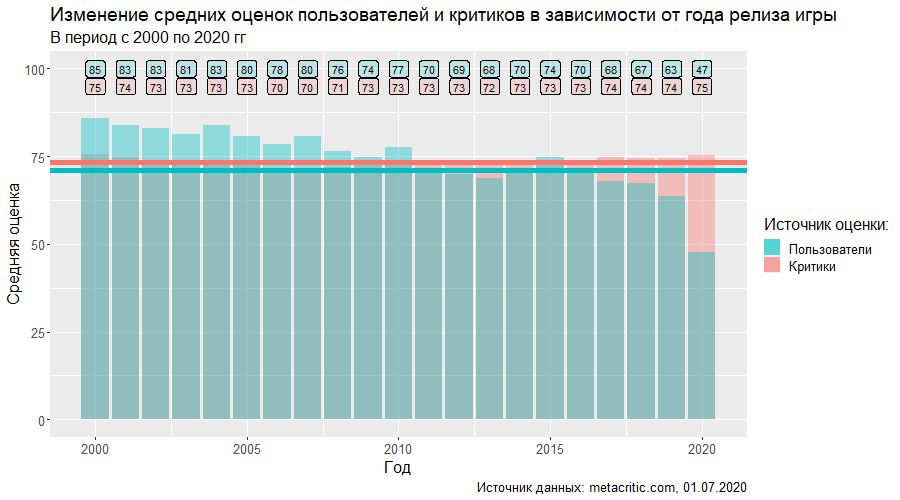
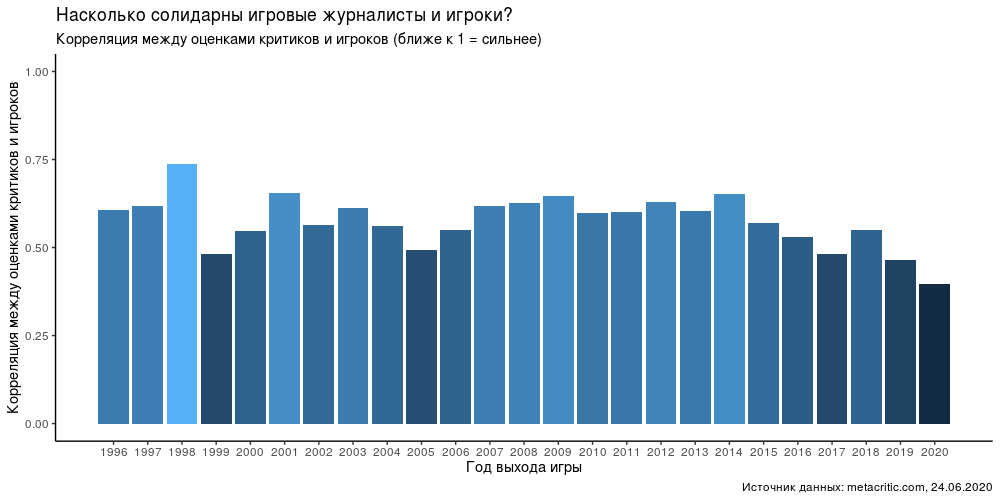
Here again - but more clearly - we can observe the stability of the critics' ratings and the constant decline in the average user rating - up to 47 points in 2020. Intuitively, it seems that the correlation between the estimates should decrease - it is worth looking at the graph with correlations.
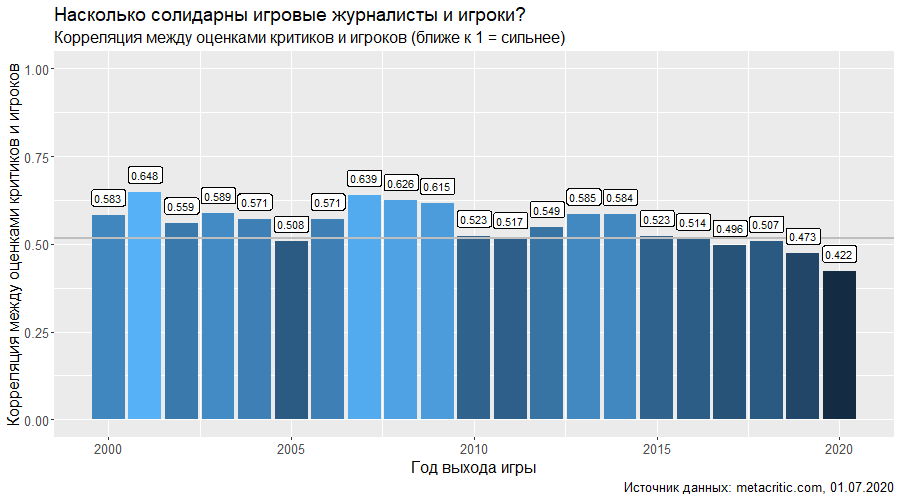
The gray line indicates the general correlation for all observations in the database (including games released before 2000). At first glance, the assessments of games released since the middle of the outgoing decade are getting farther and farther apart, the opinions of critics and players are more and more different.
However, we still have an abnormally low average player rating in 2020. And before continuing, you need to deal with it.
Let's build a scatterplot for the number of user reviews and critics reviews. I deliberately did not make the scale with the number of players' ratings logarithmic - this way two extreme outliers are read much better.

Pay attention to the two points with the maximum number of user reviews - Warcraft 3: Reforged and The Last of Us: Part 2. Both games have a low average user rating (in contrast to their less-rated neighbors from the top 10 in terms of the number of ratings). and the number of assessments itself acts as a coefficient in calculating the average grade for the year - thus, they both greatly underestimate the average grade. Below is the mentioned top 10 - and it just so happened that both games were released in 2020.

Both games are clear victims of the so-called "review bombing" - although Warcraft 3: Reforged is, in principle, quite a big disappointment for the entire community, including critics. But purging ratings that are too high or too low by continuing to talk about the link between player ratings and critics is unwise. What if only these two games were excluded? Well, the average user rating in 2020 will rise markedly. However, the influence on the correlation coefficient will be practically unnoticeable - unlike the average, its calculation did not take into account the "weight" of the game.

What if we exclude all games with too many ratings from the analysis? And how much is too big? Let's take a closer look at the variable:
> summary(both_scores$UserReviews)
    Min.  1st Qu.   Median     Mean  3rd Qu.     Max.
     4.0     11.0     25.0    144.2     75.0 104424.0
One of the classic criteria for finding outliers is the threshold of one and a half interquartile range. In our case - (75-11) * 1.5 = 96 (which must be added to the value of the third quartile). There are no emissions “from the bottom” - the user score is set when there are at least four reviews, but from above we get rid of 2768 games, leaving 17 971 entries.

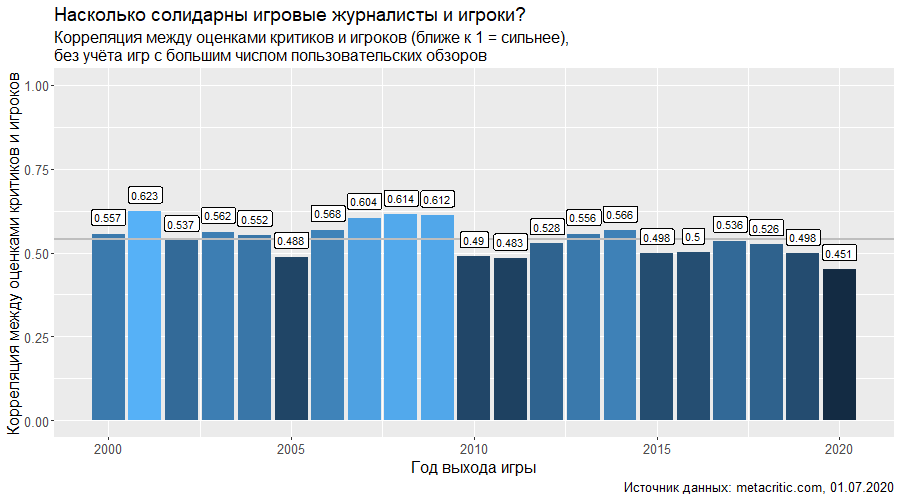
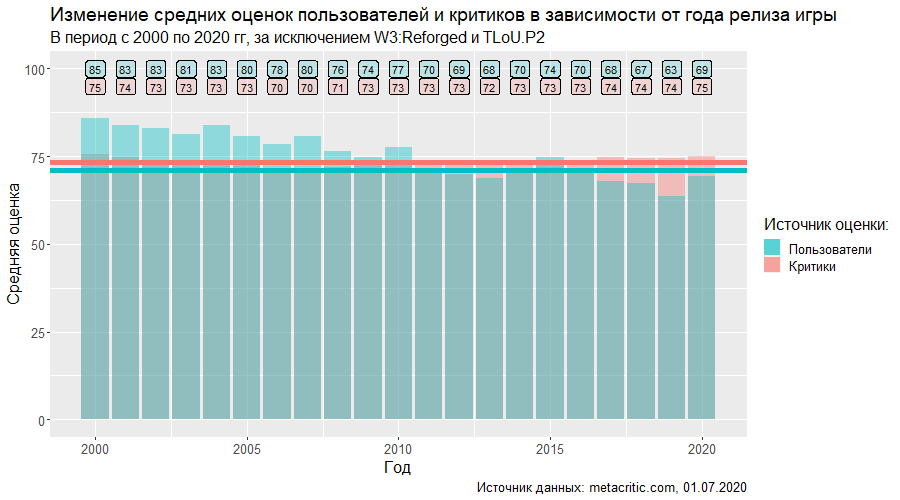
Again, we can observe average user ratings below 70 after 2011 and a gradual decline in correlation since 2017 - however, it is worth noting that similar indicators of correlation have been encountered before - in the period 2000-2020 depicted clearly stand out 2005, 2010-2011, 2015- 2016 years. But the decline has never been systematic - signs of which are noticeable in the 2017-2020 segment. There are two possible explanations: first, the contribution of review bombing can be overestimated; secondly, I may underestimate its scale, and it is necessary to further reduce the criterion of the acceptable maximum of user reviews; nevertheless, for the sake of this material, I will stick to the first hypothesis, leaving the verification of the second as a possible discussion.
In addition to everything that has already been discussed above, I would like to draw the public's attention directly to the difference in ratings - for the calculation of which, again, the average user rating was multiplied by 10.
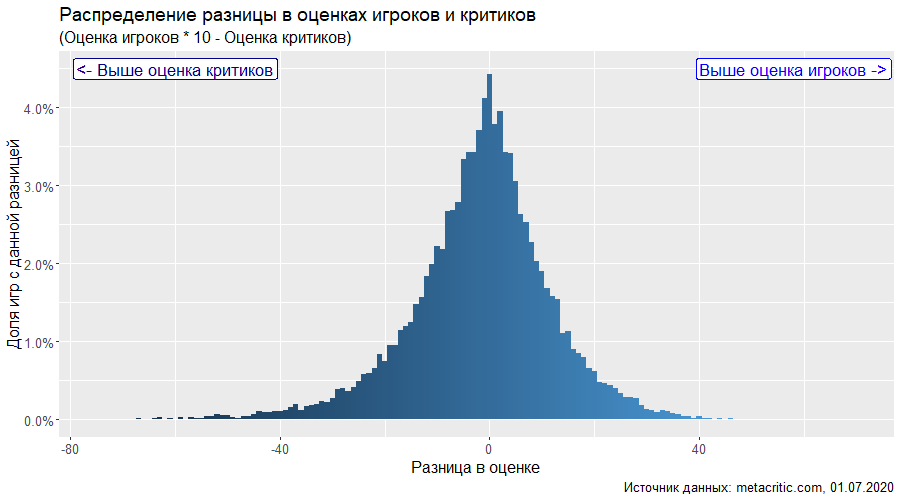
For the first time, a distribution appears in this material that resembles a normal in its shape (theoretically, the researcher it is necessary to check the distribution for normality, however, there is a caveat according to which, given the randomness of the selection of observations and a sufficiently large base, the difference from the normal distribution can be ignored using standard statistical tools) - this can be considered a local success! However, it will not be possible to consolidate the success with a formal check - checking the normality by the Pearson Chi-square will return us a p-value significantly lower than 0.05:
> Diff <- unlist(both_scores %>%
  mutate(ReleaseDate = year(ReleaseDate), Diff = UserScore * 10 - MetaScore) %>%
  select(Diff))
> nortest::pearson.test(Diff)
	Pearson chi-square normality test
data:  Diff
P = 35078, p-value < 2.2e-16
It remains only to accept, to remind ourselves that the conclusions based on the analysis of games with both ratings on Metacritic.com should not be generalized for games in general - and with this thought continue the analysis.
Let's look at the difference in ratings by year of the game's release:
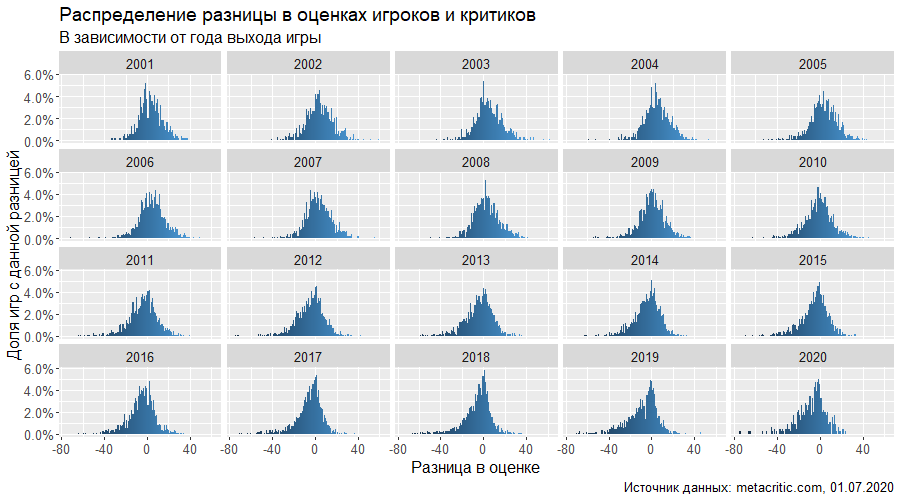
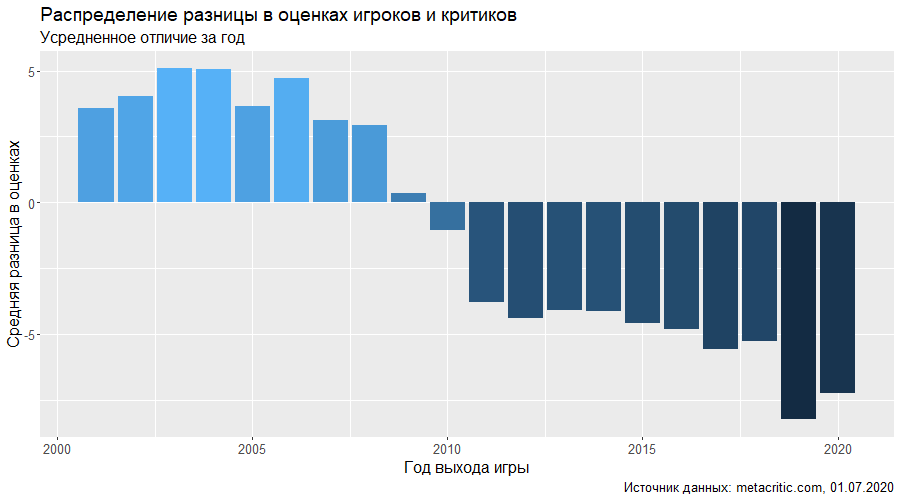
If the first graph is difficult to interpret, then the second clearly shows the previously indicated tendency - the players are more favorable to the "old" games - and tend to evaluate new games worse than the press. Interestingly, the average difference is very close to zero for games released in 2009-2010 - and just look what games were released a decade ago! It is worth remembering, however, that the correlation between the estimates in 2010 is relatively low - it seems that the actual number of games with diverging estimates this year is great, but the vectors of the differences balance each other.
Finally, let's take a look at the platforms - individually and regardless of the release year of the game:
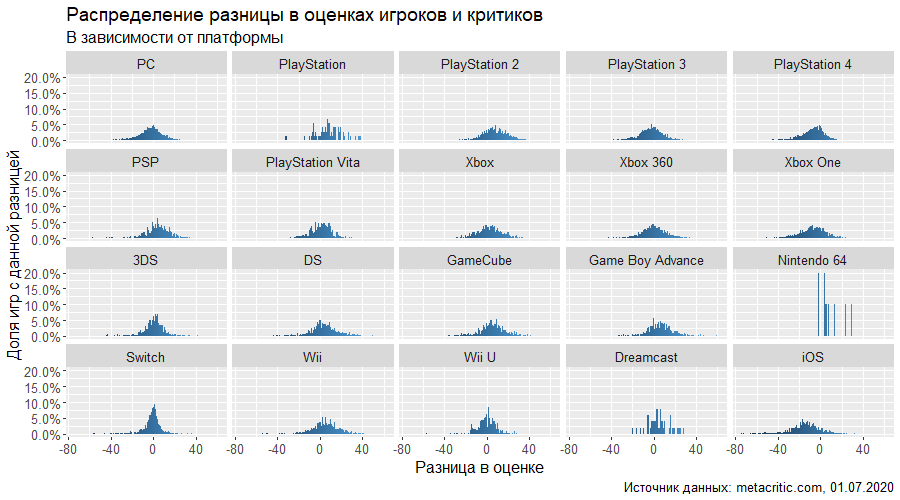
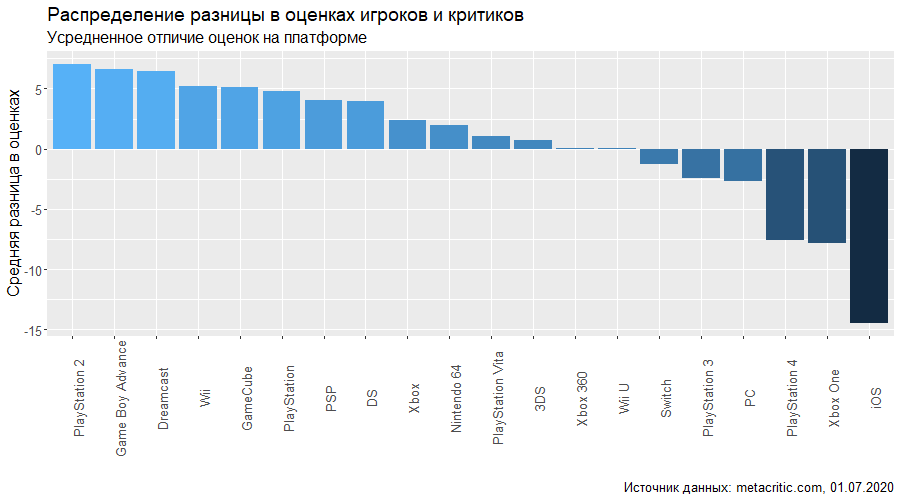
If we exclude the Nintendo 64 with its 89 titles, the situation is, in general, expectedly similar across different platforms. The peak in zero difference, however, fluctuates - for example, the ratings of games on the Nintendo Switch are more consistent, while ratings of games on iOS are "smeared" on the scale - and the "peak" of the distribution is more likely at a value of about -20 - the platform is the clear leader in terms of the number of dissatisfied players. The graph below only confirms this. By the way, here the main consoles of the outgoing generation are also among the "leaders" in the dislike of PS4 and Xbox One users. Although in the Nintendo camp, everything is not cloudless at all - the balance is negative.
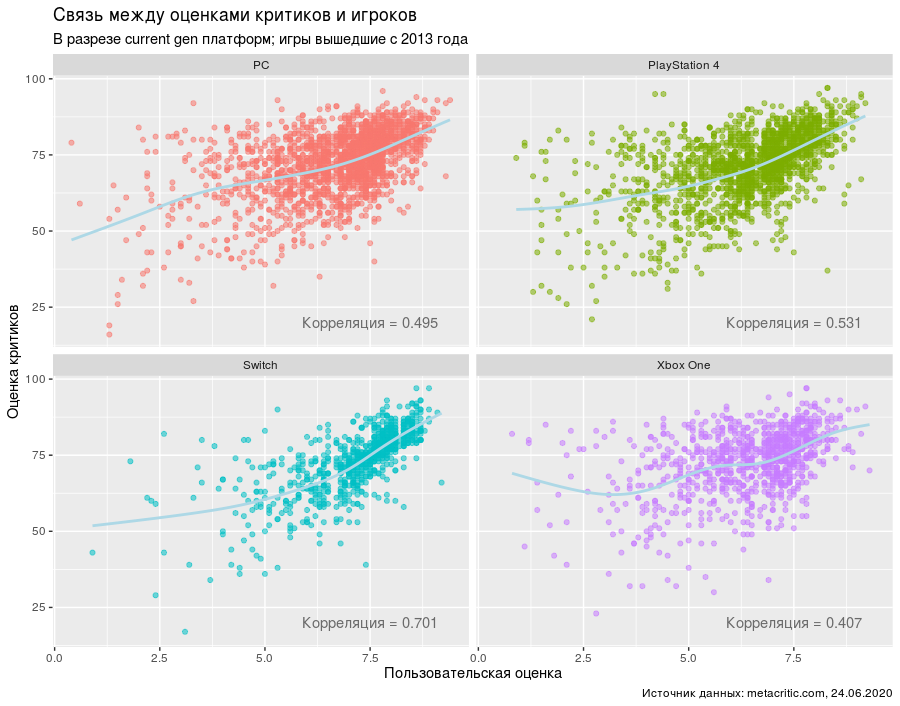
You may have already seen the graph below at the beginning of the article - however, in this version of it there are more games and the iOS platform is added - it gets the honorable last place in the connectedness of ratings.

Perhaps it is worth stopping at this and moving on to conclusions.
Summing up
The world is not cast in bronze or carved out of stone. Something about him is changing.
Obviously, the games themselves are changing. Players also change - their number and diversity of opinions are growing. And if the review industry tries to adhere to some - albeit unspoken - standards, keeping the average score at ~ 7.5 points, the players clearly assess the situation differently - for games released 20 years apart (in 2000 and 2020), the average user rating is Metacritic dropped from 8.5 to 6.9 - a serious loss!
What are the reasons behind this? My hypotheses:
- Metacritic gamers tend to better rate the games they spent their childhoods - nostalgic effects (probably) absent - or wiped out - by professional critics;
- , , Metacritic, - , «» 7.5 ;
- , Metacritic – , , «» ( ).
Two of them can be verified, and the approach is almost identical - with some effort, it is possible to establish whether the ratings given long after the release of the game are higher than the ratings given in the first days / weeks after it. To eliminate the effect of review bombing, it is additionally worth "cleaning up" games with an extremely high number of ratings in the first hours after the opportunity to publish reviews becomes available - or at least ignore these first user ratings.
Verification of the second hypothesis requires a huge amount of work to reassess the entire array of games (since it questions the objectivity of critics, there is no way to rely on this assessment). Perhaps a good indicator would be the ratio of fees to game budgets, but publishers are reluctant to share such figures - and the marketing effect has not been canceled (you can blame the same type of athletes or the conveyors of Ubisoft and Activision Blizzard for a long time, but these games are still sold from year to year enough large editions).
Let's watch.