in 2003 . For the first time in the PHP ecosystem, it is possible to collect code coverage data. In 2004, Sebastian Bergmann released PHPUnit 2 , where he first used it. Developers now have the ability to measure the performance of their test suites using coverage reports. Since then, the functionality has been moved to a generic, independent php-code-coverage component . PHPDBG and PCOV have appeared as alternative drivers . But fundamentally, the core process for developers hasn't changed over the past 16 years.
In August 2020, with the release of php-code-coverage 9.0 and its related releases PHPUnit 9.3 and behat-code-coverage 5.0 , a new way to estimate coverage became available.
Today we will consider
- A quick tour of the basics
- Limitations
- Alternative metrics
- Branch coverage
- Covering paths
- Including new metrics
- Which metric to use?
- Are there any reasons not to include new metrics?
- Outcome
A quick tour of the basics
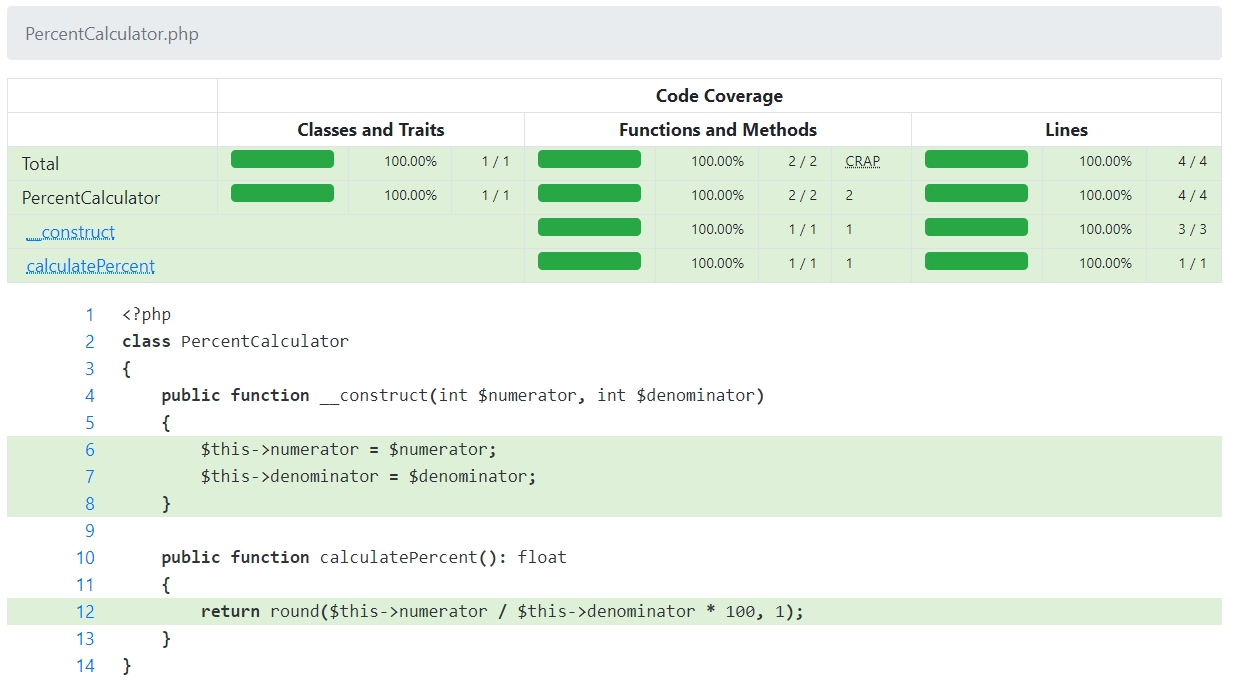
Most PHP developers are familiar with the idea of automated code testing. The idea of code coverage is closely related to automated testing and is about measuring the percentage of code that has been executed or, as they say, “covered” by tests. For example, if you have the following code:
<?php
class PercentCalculator
{
    public function __construct(int $numerator, int $denominator)
    {
        $this->numerator = $numerator;
        $this->denominator = $denominator;
    }

    public function calculatePercent(): float
    {
        return round($this->numerator / $this->denominator * 100, 1);
    }
}
Then we can write a PHPUnit test as shown below:
<?php
class PercentCalculatorTest extends PHPUnit\Framework\TestCase
{
    public function testTwentyIntoForty(): void
    {
        $calculator = new PercentCalculator(20, 40);
        self::assertEquals(50.0, $calculator->calculatePercent());
    }
}
After running the test, PHPUnit confirms that we have reached 100% coverage in this trivial example:
Limitations
In the example above, however, there was a small potential error. If $ denominator is 0 , then we get a division by zero error. Let's fix that and see what happens:
<?php
class PercentCalculator
{
    public function __construct(int $numerator, int $denominator)
    {
        $this->numerator = $numerator;
        $this->denominator = $denominator;
    }

    public function calculatePercent(): float
    {
        //     ,
        //
        //
        return $this->denominator ? round($this->numerator / $this->denominator * 100, 1) : 0.0;
    }
}
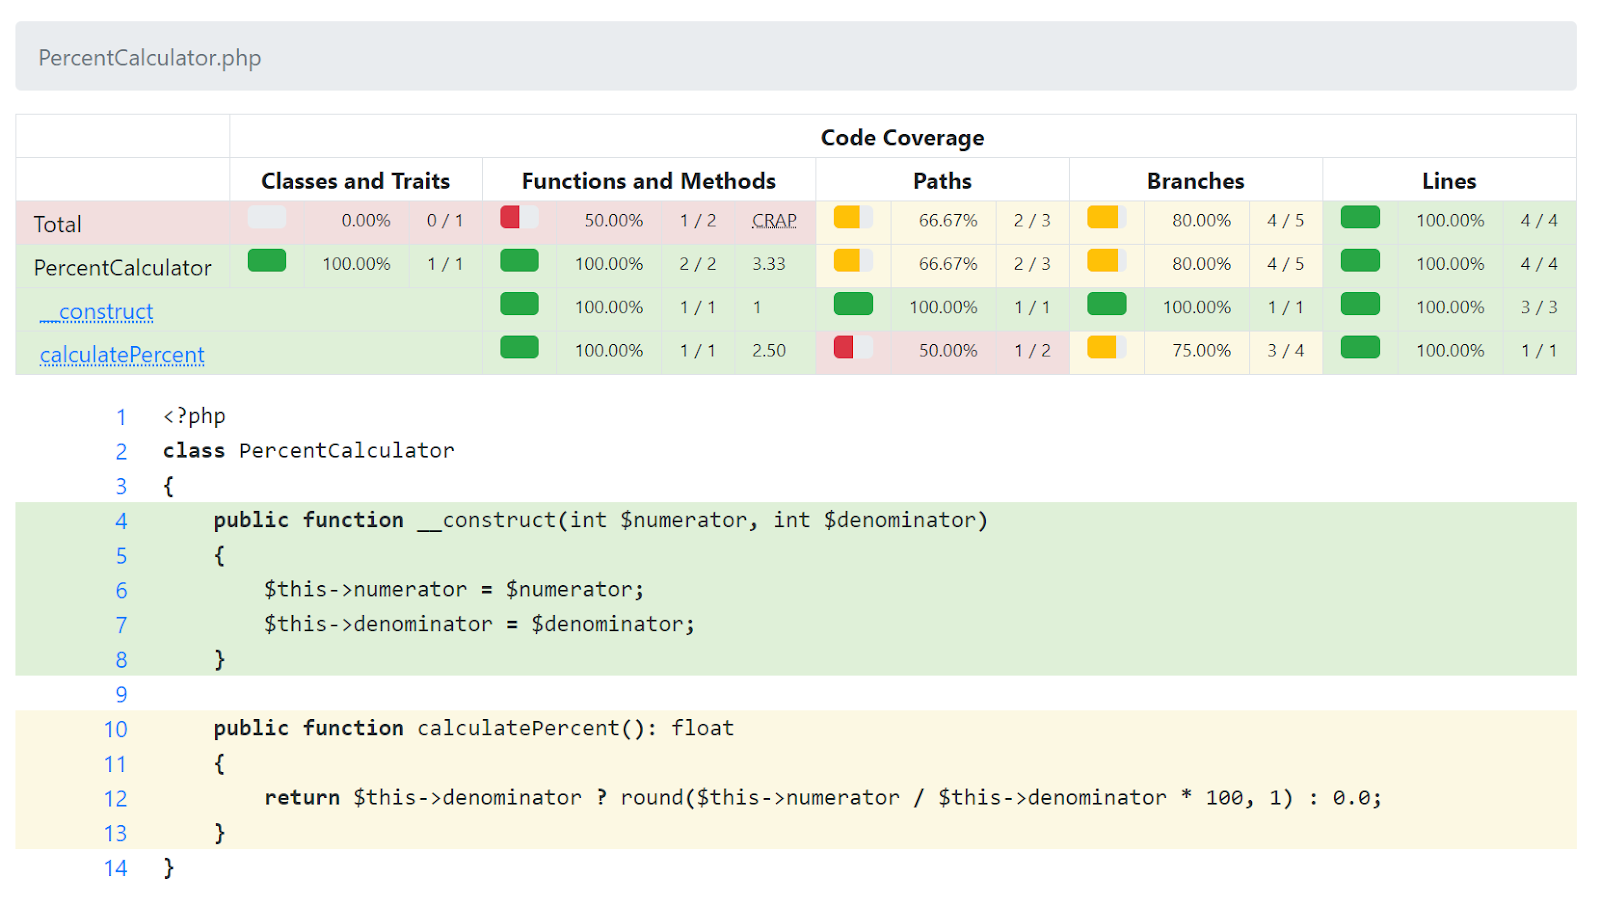
Even though line 12 now uses the ternary if / else statement (and we haven't even written a test to verify that our null handling is correct), the report tells us that we still have 100% code coverage.
If part of the line is covered by the test, then the entire line is marked as covered . This can be misleading!
By simply calculating whether a line is executed or not, other code constructs can often have the same problems, for example:
if ($a || $b || $c) { //  **
    doSomething();    //     100%
}

public function pluralise(string $thing, int $count): string
{
    $string = $count . ' ' . $thing;

    if ($count > 1) {   //     $count >= 2,  - 100%
        $string .= 's'; //      $count === 1,
    }                   //      ,

    return $string;
}
Alternative metrics
Since version 2.3, Xdebug was able to collect not only the familiar line-by-line metrics, but also alternative branch and path coverage metrics. Derik's blog post talking about this feature ended with the infamous statement:
“It remains to wait until Sebastian (or someone else) has time to update PHP_CodeCoverage to show branch and path coverage. Happy hacking!
Derik Retans, January 2015 "
After 5 years of waiting for this mysterious "someone else", I decided to try to implement it all myself. Many thanks to Sebastian Bergman for accepting my pull request .
Branch coverage
In all but the simplest code, there are places where the execution path can diverge into two or more paths. This happens at every decision point, such as every if / else or while . Each "side" of these divergence points is a separate branch. If there is no decision point, the flow contains only one branch.
Note that despite the use of the tree metaphor, a branch in this context is not the same as a version control branch, do not confuse the two!
When branch and path coverage is enabled, HTML report generated with php-code-coverage, in addition to the regular line coverage report, includes add-ons for displaying branch and path coverage. This is what branch coverage looks like using the same code example as before:
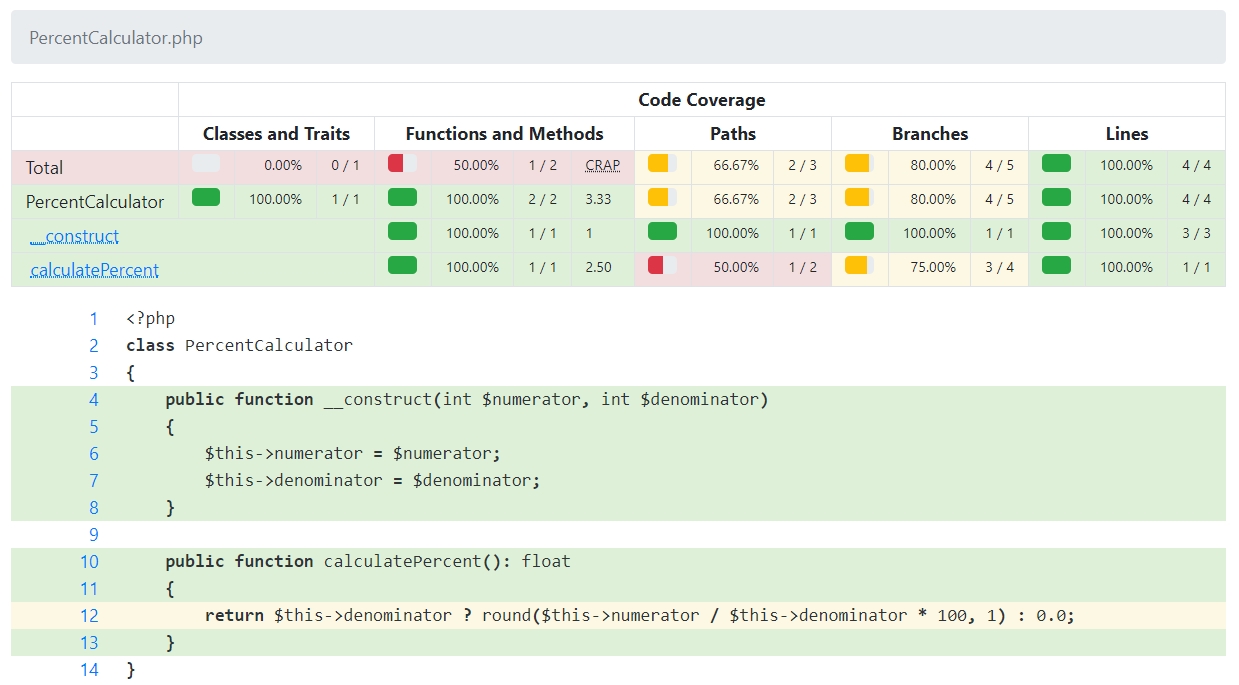
As you can see, the pivot box at the top of the page immediately indicates that although we have full line-by-line coverage, this does not apply to branch and path coverage ( paths are discussed in detail in the next section).
In addition, line 12 is highlighted in yellow to indicate that it has incomplete coverage (a line with 0% coverage will be displayed in red as usual).
Finally, the more attentive may notice that, unlike line-by-line coverage, more lines are highlighted in color. This is because branches are computed based on the flow of execution inside the PHP interpreter. The first branch of each function starts when that function is entered. This is in contrast to string-based coverage, where only the function body is considered to contain executable strings, and the function declaration itself is considered non-executable.
Finding branches
Such differences between what the PHP interpreter considers to be a logically separate branch of code and the developer's mental model can make metrics difficult to understand. For example, if you asked me how many branches are in calculatePercent () , I would answer that 2 (a special case for 0 and a general case). However, looking at the php-code-coverage report above, this one-line function actually contains ... 4 branches ?!
To understand what the PHP interpreter means, there is an additional coverage report under the upstream. It shows an extended version of the display of each branch, which helps to more efficiently identify what is hidden in the source code. It looks like this:
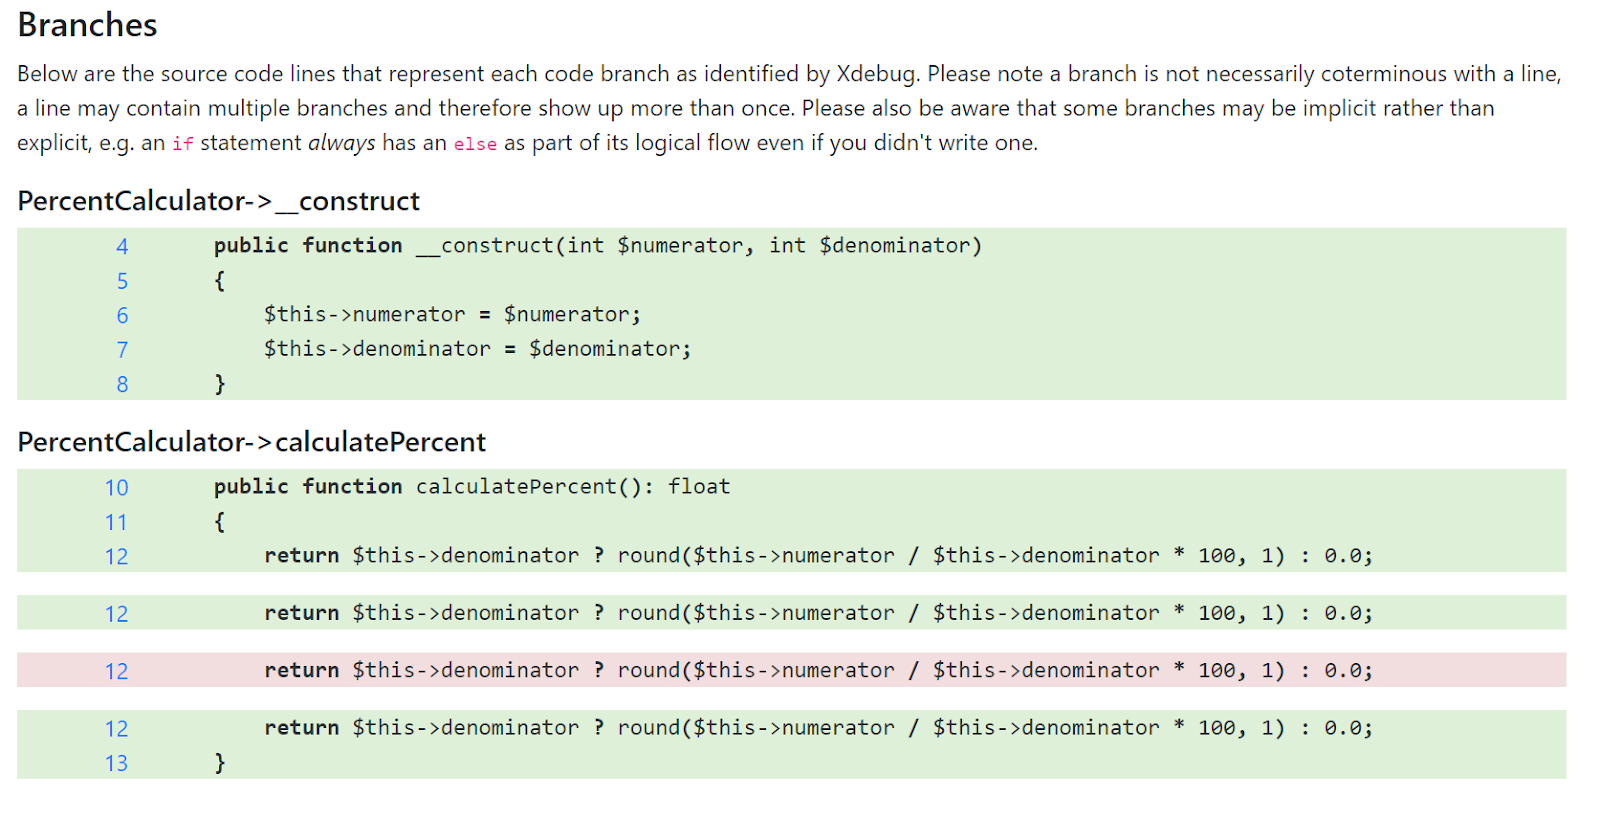
The caption reads: “Below are the lines of source that represent each branch of code that Xdebug found . Note that a branch does not have to be the same as a string: a string can contain multiple branches and therefore appear more than once. Also keep in mind that some branches may be implicit, for example, an if statement always has an else in the logical flow, even if you did not write it. "
All this is not quite obvious yet, but you can already understand what branches are actually in calculatePercent () :
- Branch 1 starts at function entry and includes the $ this-> denominator check ;
- The execution is then split into branches 2 and 3 depending on whether the special case is handled or not;
- Branch 4 is where branches 2 and 3 merge. It consists of return and exiting the function.
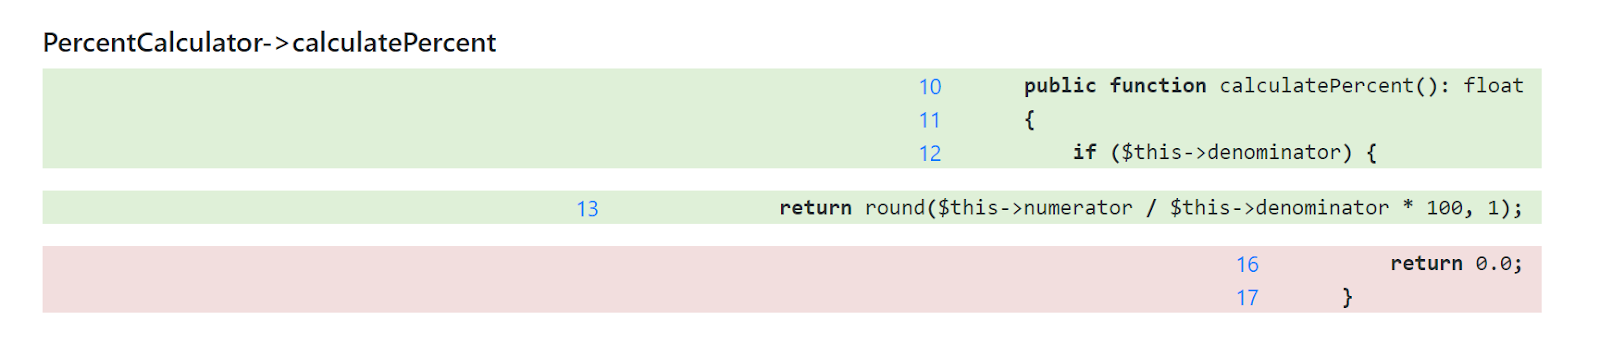
Mentally matching branches to individual parts of the source code is a new skill that takes a little practice. But doing it with easily readable and understandable code is definitely easier. If your code is full of smart one-liners that combine several pieces of logic, as in our example, then expect more complexity compared to code where everything is structured and written in several lines, completely corresponding to the branches. The same logic written in this style would look like this:
Clover
If you export the php-code-coverage report in Clover format to transfer it to another system, then with branch-based coverage enabled, the data will be written to the conditionals and coveredconditionals keys . Previously (or if branch coverage was not enabled) the exported values were always zero.
Covering paths
Paths are possible combinations of branches. The calculatePercent () example has two possible paths, as shown above:
- Branch 1, then Branch 2, then Branch 4;
- Branch 1, then branch 3, and then branch 4.
However, often the number of paths is greater than the number of branches, for example, in code that contains many conditionals and loops. The following example, taken from php-code-coverage , has 23 branches, but there are actually 65 different paths for the function:
final class File extends AbstractNode
{
    public function numberOfTestedMethods(): int
    {
        if ($this->numTestedMethods === null) {
            $this->numTestedMethods = 0;

            foreach ($this->classes as $class) {
                foreach ($class['methods'] as $method) {
                    if ($method['executableLines'] > 0 &&
                        $method['coverage'] === 100) {
                        $this->numTestedMethods++;
                    }
                }
            }

            foreach ($this->traits as $trait) {
                foreach ($trait['methods'] as $method) {
                    if ($method['executableLines'] > 0 &&
                        $method['coverage'] === 100) {
                        $this->numTestedMethods++;
                    }
                }
            }
        }

        return $this->numTestedMethods;
    }
}
If you can't find all 23 branches, remember that foreach can accept an empty iterator, and if there is always an invisible else .
Yes, that means 65 tests are needed for 100% coverage.
The php-code-coverage HTML report , like branches, includes an additional view for each path. It shows which ones are covered with the dough and which are not.
CRAP
Enabling path coverage further affects the displayed metrics, namely the CRAP score . The definition published on crap4j.org uses the historically unavailable percentage path coverage metric in PHP as input for the calculation . Whereas in PHP , line-by-line coverage has always been used. For small features with good coverage, the CRAP score is likely to remain the same or even decrease. But for functions with many execution paths and poor coverage, the value will increase significantly.
Including new metrics
Branch and path coverage is turned on or off together, since both are simply different representations of the same underlying code execution data.
PHPUnit
For PHPUnit 9.3+, additional metrics are disabled by default and can be enabled either through the command line or through the phpunit.xml configuration file , but only when running under Xdebug . Attempting to enable this feature when using PCOV or PHPDBG will result in a configuration incompatibility warning and coverage will not be collected.
- In the console, use the --path-coverage option : vendor / bin / phpunit - path-coverage .
- In phpunit.xml, set the coverage element's pathCoverage attribute to true .
<?xml version="1.0" encoding="UTF-8"?>
<phpunit xmlns:xsi="http://www.w3.org/2001/XMLSchema-instance"
         xsi:noNamespaceSchemaLocation="https://schema.phpunit.de/9.3/phpunit.xsd">
    <testsuites>
        <testsuite name="default">
            <directory>tests</directory>
        </testsuite>
    </testsuites>

    <coverage pathCoverage="true" processUncoveredFiles="true" cacheDirectory="build/phpunit/cache">
        <include>
            <directory suffix=".php">src</directory>
        </include>

        <report>
            <text outputFile="php://stdout"/>
            <html outputDirectory="build/coverage"/>
        </report>

    </coverage>
</phpunit>
In PHPUnit 9.3, the format of the configuration file has been seriously changed , so the structure above probably looks different from what you are used to.
behat-code-coverage
For behat-code-cover 5.0+, the setting is done in behat.yml , the attribute is called branchAndPathCoverage . If you try to enable it with a driver other than Xdebug , a warning will be issued, but coverage will still be generated. This is to make it easier to use the same configuration file in different environments. If not explicitly configured, the new coverage will be enabled by default when running under Xdebug .
Which metric to use?
Personally, I ( Doug Wright ) will use the new metrics whenever possible. I tested them on various code to see what is "normal". On my projects, most likely, I will use a hybrid approach, which I will show below. For commercial projects, the decision to switch to new metrics, obviously, should be made by the whole team, and I am looking forward to the chance to compare their findings with my own.
My opinion
100% path-based coverage is undoubtedly the holy grail, and where it is wise to apply it is a good metric to strive for, even if you don't achieve it. If you write tests, you should still think about things like edge cases. Path-based coverage helps you make sure it's okay.
However, if a method contains tens, hundreds, or even thousands of paths (which is actually not uncommon for fairly complex things), I would not waste time writing hundreds of tests. It's wise to stop at ten. Testing is not an end in itself, but a risk mitigation tool and an investment in the future. Tests should pay off, and the time spent on that muchtests are unlikely to pay off. In situations like this, it is best to aim for good branch coverage, as it at least ensures that you think about what is happening at each decision point.
In cases of a large number of paths (they are now well defined with honest CRAP), I evaluate if the code in question does not do too much, and is there a reasonable way to break it down into smaller functions (which can already be parsed in more detail)? Sometimes not, and that's okay - we don't need to eliminate absolutely all project risks. Even knowing about them is wonderful. It is also important to remember that function boundaries and their isolated unit testing are an artificial separation of logic, not the true complexity of your overall software. Therefore, I would recommend not breaking large functions just because of the daunting number of execution paths. Do this only where separation reduces cognitive load and helps code perception.
Are there any reasons not to include new metrics?
Yes, performance. It's no secret that Xdebug code is incredibly slow compared to normal PHP performance . And if you turn on the coverage of branches and paths, then everything is aggravated by the addition of overheads for all additional execution data that he now needs to track.
The good news is that having to tackle these issues has inspired the developer to make general performance improvements within php-code-coverage that will benefit anyone using Xdebug . The performance of test suites varies greatly, so it's hard to judge how this will affect each test suite, but collecting string-based coverage will be faster anyway.
Branches and paths still cover about 3-5 times slower. This must be taken into account. Consider selectively enabling individual test files rather than the entire test suite, or a nightly build with "better coverage" instead of running every push.
Xdebug 3 will be significantly faster than current versions due to the work done on modularization and performance, so these caveats should be viewed as specific to Xdebug 2 only . With version 3, even considering the overhead of collecting additional data, it is possible to generate branch-based and path-based coverage in less time than it takes today to get line-by-line coverage!
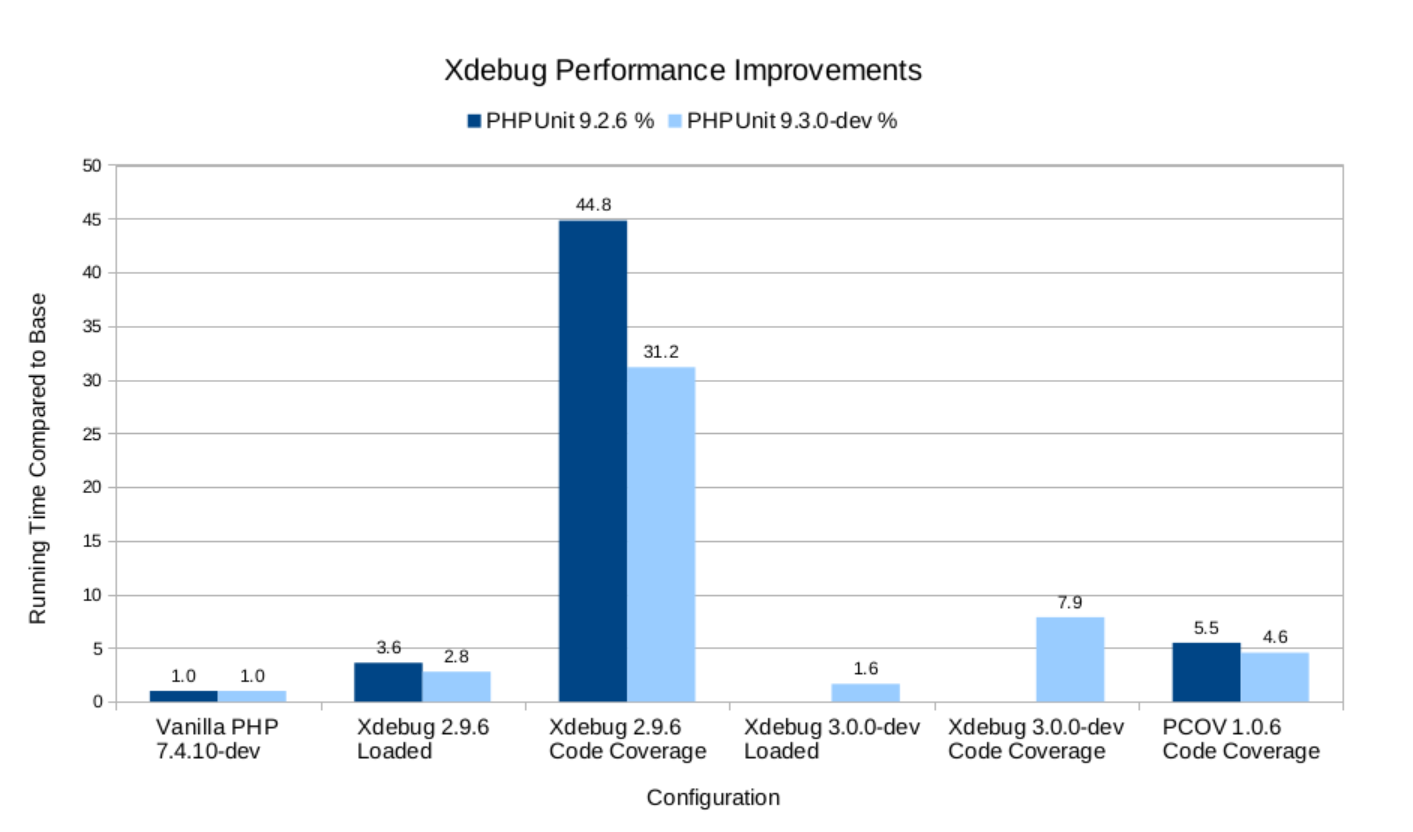
Tests conducted by Sebastian Bergmann, graph plotted by Derick Rethans
Outcome
Please test the new features and write to us. Are they helpful? Ideas for alternative visualization (possibly from other languages) are especially interesting.
Well, I am always interested in your opinion on what is the normal level of code coverage.

At PHP Russia on November 29, we will discuss all the most important questions about PHP development, about what is not in the documentation, but what will give your code a new level.
Join us at the conference: not only to listen to reports and ask questions to the best speakers of the PHP-universe, but also for professional communication (finally offline!) In a warm atmosphere. Our communities: Telegram , Facebook , VKontakte , YouTube .