Today we will investigate the data on hate crimes. First, let's look at all the statistics in full, and then we will take a closer look at racial intolerance and specifically crimes committed by whites and blacks on the basis of enmity towards whites and blacks.
Disclaimer
, , . , , .
Initial data
As the initial data, I downloaded a dataset from the Crime Data Explorer site , which is maintained by the FBI as part of the US criminal reporting program (I already wrote about this site in the previous article). You can download the direct link here (4.4 MB). The downloaded archive contains the actual data in CSV format, as well as a text description. I have not transformed the data in any way, so if you want to repeat the analysis yourself, you should get the same results.
I also used data on the US population, disaggregated by race, obtained from the official data of the Census Bureau and supplemented with model data for the period from 1991 to 2009. You can download it here(Yandex.Disk). To analyze the geographical distribution of specific indicators, I also needed the population size by state, obtained from the same source (download here ). I used the same data in my previous article.
What are hate crimes and how are they reported?
From the FBI website:
The FBI's UCR Program defines hate crime as a committed criminal offense which is motivated, in whole or in part, by the offender's bias (es) against a race, religion, disability, sexual orientation, ethnicity, gender, or gender identity.
Transfer:
The FBI's Criminal Reporting Program defines a hate crime as a crime motivated (in part or in whole) by the offender's bias against race, religion, physical restraint, sexual orientation, ethnicity, gender, or gender identity.
The note accompanying the original crime dataset also states the following (italics retained):
Because motivation is subjective, it is sometimes difficult to know with certainty whether a crime resulted from the offender’s bias. Moreover, the presence of bias alone does not necessarily mean that a crime can be considered a hate crime. Only when a law enforcement investigation reveals sufficient evidence to lead a reasonable and prudent person to conclude that the offender’s actions were motivated, in whole or in part, by his or her bias, should an agency report an incident as a hate crime.
In other words, all the cases recorded in the database as a Hate Crime,
Naturally, it is impossible to verify the conclusions of the investigation in each case, since the database aggregates the reports of hundreds of different law enforcement agencies throughout the country and access to all investigation materials is (one can assume) only for FBI employees. The database itself provides only ready-made statistics.
Database structure
The database contains data on crimes motivated by intolerance from 1991 to 2018. At the time of this writing, the last entry is dated December 31, 2018, a total of 201403 entries. Each entry is one crime case. Thus, we get an average of 7193 crimes per year.
List of database fields in original CSV format
- INCIDENT_ID: ID ()
- DATA_YEAR: ,
- ORI: ID ( ),
- PUB_AGENCY_NAME: / ( )
- PUB_AGENCY_UNIT: (, )
- AGENCY_TYPE_NAME: ( / )
- STATE_ABBR:
- STATE_NAME:
- DIVISION_NAME: ( )
- REGION_NAME: ( )
- POPULATION_GROUP_CODE:
- POPULATION_GROUP_DESC: ( « 0,5 1 .»)
- INCIDENT_DATE:
- ADULT_VICTIM_COUNT:
- JUVENILE_VICTIM_COUNT:
- TOTAL_OFFENDER_COUNT:
- ADULT_OFFENDER_COUNT:
- JUVENILE_OFFENDER_COUNT:
- OFFENDER_RACE: /- /-
- OFFENDER_ETHNICITY: /- ( / / / )
- VICTIM_COUNT: ( )
- OFFENSE_NAME:
- TOTAL_INDIVIDUAL_VICTIMS: ( )
- LOCATION_NAME: (, , , ..)
- BIAS_DESC: ( )
- VICTIM_TYPES: /- ( / / ..)
- MULTIPLE_OFFENSE: (.. , )
- MULTIPLE_BIAS: ( , )
I only use a few fields in my research (those in bold) because my main goal is to find links between types of crime, types of intolerance, and race of criminals . However, in your own research, you can, of course, go further and analyze, for example, the age of the criminals and victims or the typical locations of the crimes depending on their types, etc. As they say, the scope of imagination is not limited :)
Types of crimes
The database includes 13 main types of crimes:
- crimes against the person : murder, rape, assault, grave assault, personal threat and human trafficking (sexual slavery and slave labor)
- property crimes : robbery, illegal entry, theft, theft, arson and damage to property / vandalism
as well as (in the extended database that we will use) additional types of offenses such as drug dealing, fraud and even more “exotic” intolerance contexts such as prostitution, incest or sodomy.
All 48 categories of crimes (titles in original)
Aggravated Assault
All Other Larceny
Animal Cruelty
Arson
Assisting or Promoting Prostitution
Betting/Wagering
Bribery
Burglary/Breaking & Entering
Counterfeiting/Forgery
Credit Card/Automated Teller Machine Fraud
Destruction/Damage/Vandalism of Property
Drug Equipment Violations
Drug/Narcotic Violations
Embezzlement
Extortion/Blackmail
False Pretenses/Swindle/Confidence Game
Fondling
Hacking/Computer Invasion
Human Trafficking, Commercial Sex Acts
Identity Theft
Impersonation
Incest
Intimidation
Kidnapping/Abduction
Motor Vehicle Theft
Murder and Nonnegligent Manslaughter
Negligent Manslaughter
Not Specified
Pocket-picking
Pornography/Obscene Material
Prostitution
Purchasing Prostitution
Purse-snatching
Rape
Robbery
Sexual Assault With An Object
Shoplifting
Simple Assault
Sodomy
Statutory Rape
Stolen Property Offenses
Theft From Building
Theft From Coin-Operated Machine or Device
Theft From Motor Vehicle
Theft of Motor Vehicle Parts or Accessories
Weapon Law Violations
Welfare Fraud
Wire Fraud
Types of intolerance / motives of crime
In accordance with the definition above, the following types of intolerance are entered into the database:
- against race (against whites, against blacks, against Asians, against Jews, etc.)
- against ethnicity (against Hispanics)
- against confession or religious worldview (against Christians, against atheists, against Muslims, against Jehovah's Witnesses, etc.)
- against sexual orientation or gender (against male and female homosexuals, against men, against women, against transgender people, etc.)
- against physical limitations (hatred of the disabled)
Moreover, each crime can have up to 5 different types of intolerance as a motive. Therefore, when dealing with such multiple characteristics, we will have to enlarge the categories.
Categories of victims
The program registers crimes against both individuals and organizations, the state or even society as a whole, while highlighting the number of individuals affected. We will only consider cases with injured people.
So, armed with Python with pandas or a couple of other libraries (see the section "Tools" in my previous article ), and also not forgetting to skip coffee, tea, beer or kombucha (whoever likes what) ... pull the mask over our face, put on surgical gloves , adjusting the operating lamp and ...
We dissect the data
As in the previous article, I do all the analysis in a Jupyter Lab / Notebook in Python 3.8. Here I will not provide and comment on the code itself - you can download it from this link (in the archive there is a listing and a file in Jupyter Notebook format). Let's focus more on the results we get. All charts are clickable .
Data overview and top lists
After loading data from CSV (only the columns needed for research), we get the following dataframe:
| YEAR | STATE_NAME | OFFENDER_RACE | OFFENSE_NAME | BIAS_DESC | VICTIM_TYPES | |
|---|---|---|---|---|---|---|
| 0 | 1991 | Arkansas | White | Intimidation | Anti-Black or African American | Individual |
| 1 | 1991 | Arkansas | Black or African American | Simple assault | Anti-White | Individual |
| 2 | 1991 | Arkansas | Black or African American | Aggravated Assault | Anti-Black or African American | Individual |
| 3 | 1991 | Arkansas | Black or African American | Aggravated Assault; Destruction / Damage / Vandalis ... | Anti-White | Individual |
| 4 | 1991 | Arkansas | Black or African American | Aggravated Assault | Anti-White | Individual |
| ... | ... | ... | ... | ... | ... | ... |
| 201398 | 2018 | West virginia | NaN | Burglary / Breaking & Entering | Anti-Black or African American | Individual |
| 201399 | 2018 | West virginia | White | Simple assault | Anti-Black or African American | Individual |
| 201400 | 2018 | West virginia | NaN | Intimidation | Anti-Asian | Individual |
| 201401 | 2018 | West virginia | White | Intimidation | Anti-White | Law Enforcement Officer |
| 201402 | 2018 | West virginia | NaN | Burglary / Breaking & Entering; Destruction / Damag ... | Anti-Other Religion | Religious Organization |
201403 rows × 6 columns
More than 200 thousand lines and just over 8 MB of memory. Let's first look at the top 10 crimes committed, types of intolerance (motives), races of perpetrators and categories of victims: So, what we see here:


- The most common type of crime is damage to property / vandalism , followed closely by personal threat (intimidation). Each of these types of crime accounts for almost a third of all cases. Then comes assault, and robbery and other crimes are much less common.
- Among the types of intolerance, intolerance towards blacks leads by a large margin (more than a third of all cases), then in descending order, but at approximately the same level: intolerance towards Jews, intolerance towards whites, intolerance towards gays. Other types of intolerance are statistically less frequent than the leader.
- 70% of all crimes are committed by whites , about 23% - by blacks, the rest - “within the margin of error”.
- Crimes against the person account for 80% of all cases.
Looking only at these graphs, one can imagine that almost all crimes are white, threatening blacks with violence or spoiling their property ... However, let's see what crimes and types of intolerance are most typical for each racial category of criminals:
| OFFENSE_COUNT | TOP_OFFENSE | TOP_OFFENSE_SHARE | TOP_BIAS | TOP_BIAS_SHARE | TOP_VICTIM | TOP_VICTIM_SHARE | |
|---|---|---|---|---|---|---|---|
| OFFENDER_RACE | |||||||
| White | 79514 | Intimidation | 36.796036 | Anti-Black or African American | 46.877279 | Individual | 92.730840 |
| Black or African American | 25956 | Simple assault | 36.292187 | Anti-White | 46.594236 | Individual | 94.760364 |
| Multiple | 4047 | Simple assault | 36.545589 | Anti-Black or African American | 29.033852 | Individual | 91.153941 |
| Asian | 1453 | Simple assault | 31.865107 | Anti-Black or African American | 30.075705 | Individual | 93.048864 |
| American Indian or Alaska Native | 1095 | Simple assault | 40.182648 | Anti-White | 31.415525 | Individual | 93.059361 |
| Native Hawaiian or Other Pacific Islander | 35 | Simple assault | 45.714286 | Anti-Other Religion | 22.857143 | Individual | 77.142857 |
In this table:
- OFFENSE_COUNT - the total number of crimes committed by representatives of this race
- TOP_OFFENSE - the most common type of crime for representatives of this race
- TOP_BIAS - the most common type of intolerance (motive for a crime) for representatives of this race
- TOP_VICTIM - the most frequent category of victims for representatives of this race
For each typical category, the corresponding percentages of the total number of crimes committed by members of that race are also presented.
Here you can see that for black and white the main motive is racial intolerance towards representatives of the opposite race (47% of crimes for both races). At the same time, white criminals mainly engage in threats and intimidation (37% of crimes), and black ones - in non-aggravated attacks (36% of crimes). (It's amazing what a percentage coincidence these two races find!) By the way, only for white criminals, the main type of crime is not associated with physical harm (threats); members of other races are more likely to attack.
It can also be noted that Asians and representatives of mixed races (mestizos) also, basically, show dislike for blacks, Indians and Eskimos for whites, but Hawaiians for "Gentiles". Well, this statistic so far (for me personally) turned out to be quite expected.
Let's take a look at the number of crimes by year for each race of criminals:
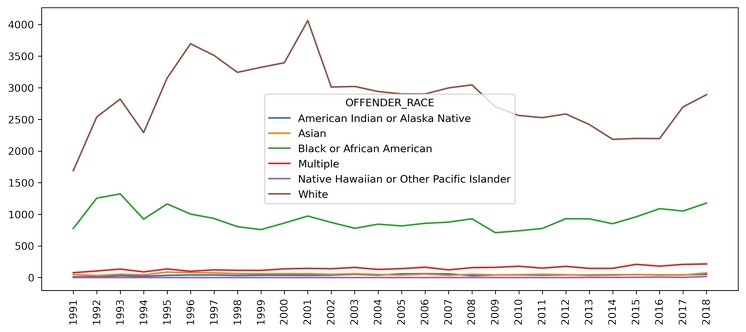
As expected, the crimes of whites and blacks on the graph dominate the rest of the races, for which no change is even visible due to the difference in scale. The peak on the part of whites here falls on 1995-2002, and on the part of blacks - the beginning of the 1990s. Since 2002, the number of crimes committed by whites motivated by intolerance has been declining quite steadily, having dropped by 2 times compared to the peak in 2001; however, after 2016, it began to rise sharply again. Intolerance among blacks gradually subsided from 1995 to 2004, but then began to grow just as smoothly, reaching the 1995 level in 2018.
It is interesting to note here that under Barack Obama (who we know is African American), that is, from 2009 to 2017, the number of crimes among whites dropped very sharply, but at the same time the number of crimes among blacks showed a stable height. Earlier under Bush (2001-2009), after the peak of crimes among whites in the first year of his presidency, the number of crimes committed by representatives of both races came to the “shelf” and practically did not change. But under Clinton (1993 - 2001), crimes among whites grew rapidly, almost year after year, while crimes among blacks, on the contrary, gradually decreased.
Well, we looked at the main trends. Let's filter the data now, leaving only the essentials for further analysis.
First filtering: by type of crime and victim
According to the research presented in my previous article, let's perform a similar filtering of data for analysis:
- among the categories of victims, we will leave only individuals (exclude crimes against organizations, authorities and the whole society);
- among the types of crimes we will leave only murders, assaults (grave and ordinary), robberies and rapes as the most "villainous".
Let's see what happened:
| YEAR | STATE_NAME | OFFENDER_RACE | OFFENSE_NAME | BIAS_DESC | COUNT | |
|---|---|---|---|---|---|---|
| 0 | 1991 | Arizona | Black or African American | Assault | Anti-Gay (Male) | 1 |
| 1 | 1991 | Arizona | Black or African American | Assault | Anti-White | 4 |
| 2 | 1991 | Arizona | White | Assault | Anti-Black or African American | ten |
| 3 | 1991 | Arkansas | Black or African American | Assault | Anti-Black or African American | 1 |
| 4 | 1991 | Arkansas | Black or African American | Assault | Anti-White | 4 |
| ... | ... | ... | ... | ... | ... | ... |
| 16428 | 2018 | Wisconsin | White | Assault | Anti-Hispanic or Latino | 1 |
| 16429 | 2018 | Wisconsin | White | Assault | Anti-Hispanic or Latino; Anti-White | 1 |
| 16430 | 2018 | Wisconsin | White | Assault | Anti-Physical Disability | 1 |
| 16431 | 2018 | Wisconsin | White | Assault | Anti-Sikh | 1 |
| 16432 | 2018 | Wisconsin | White | Assault | Anti-White | 1 |
16433 rows × 6 columns
Filtering and aggregating data has reduced the volume by 12 times without compromising the factors important for the analysis. A new COUNT column at the end contains the number of crimes for the given year, state, race of the offender, type of crime, and motive.
As an intermediate step, let's look at the distribution of crimes by race of criminals: and by types of intolerance:
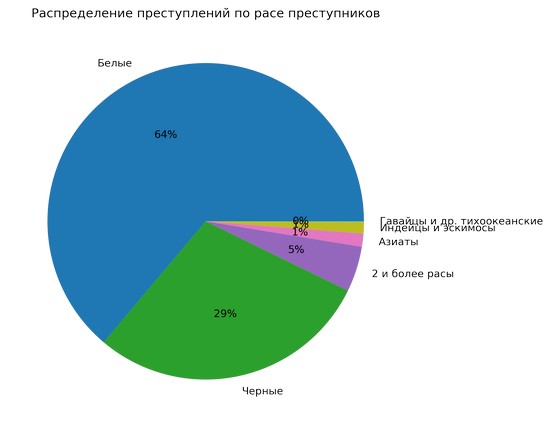
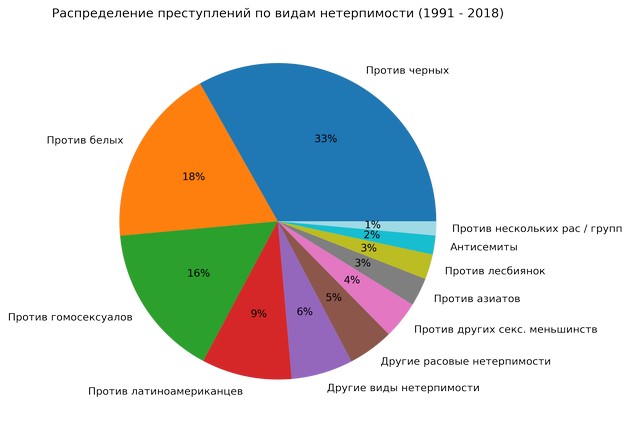
So, white and black criminals together make up 93% of all cases (there are twice as many crimes among whites, but we know that there are 5 times more white people themselves). Therefore, it is not at all surprising that the proportion is almost the same in terms of types of intolerance: 33% of crimes are motivated by intolerance towards blacks, 18% - by intolerance towards whites. It is interesting to note here in passing that crimes motivated by intolerance towards whites are quantitatively approximately equal to crimes motivated by intolerance towards homosexuals - this is the third largest motive.
Second filtering: by race of criminals and motive
The next logical step is to leave only black and white criminals and, accordingly, only “black and white” motives of crimes. By this we narrow the subject matter to racism among whites and blacks. After additional filtering, our data array looks something like this:
| YEAR | STATE_NAME | OFFENDER_RACE | OFFENSE_NAME | BIAS_DESC | COUNT | |
|---|---|---|---|---|---|---|
| 0 | 1991 | Arizona | Black | Assault | Anti-White | 4 |
| 1 | 1991 | Arizona | White | Assault | Anti-Black | ten |
| 2 | 1991 | Arkansas | Black | Assault | Anti-Black | 1 |
| 3 | 1991 | Arkansas | Black | Assault | Anti-White | 4 |
| 4 | 1991 | Arkansas | Black | Murder | Anti-White | 1 |
| ... | ... | ... | ... | ... | ... | ... |
| 3870 | 2018 | West virginia | White | Assault | Anti-White | 2 |
| 3871 | 2018 | Wisconsin | Black | Assault | Anti-Black | 1 |
| 3872 | 2018 | Wisconsin | Black | Assault | Anti-White | 4 |
| 3873 | 2018 | Wisconsin | White | Assault | Anti-Black | 6 |
| 3874 | 2018 | Wisconsin | White | Assault | Anti-White | 2 |
3875 rows × 6 columns
It is time to include specific indicators in the analysis (per population for each racial group). To do this, load population data from a file
us_pop_1991-2018.csv.
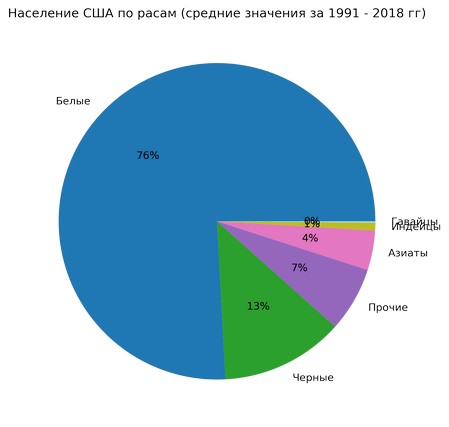
Let's see how the overall population of the United States is distributed by race (average annual indicators for 1991 - 2018): There are 5.8 times more Whites than Blacks. All other races make up 11% of the population. Next, we add data on the number to our dataset and calculate the specific number of crimes per 1 million representatives of each race. Keeping in mind that after the first filtering we have 4 types of crimes (murder, assault, robbery and rape), let's look at the distribution of these crimes by both races in absolute and specific terms:

Separately for murders and rapes (since they are not visible on the general graphs): What do we see here? And we see this:

- Of the analyzed types of crimes, attacks are by far the leading (25 times more than robbery, 250 times more than murder and rape).
- There are twice as many attacks by White, but in terms of specificity, Black attacks almost 3 times more often.
- The number of robberies committed by blacks is 1.5 times more in absolute numbers and 10 times more in specific numbers.
- Overall, whites committed slightly more murders than blacks, and about the same number of rapes. In specific terms, blacks rape 6 times more often and kill 3.6 times more often than whites. Between murder and rape, whites "prefer" murder, while blacks prefer rape.
Racist Crimes by Year
Let's see how the number of racist crimes committed by blacks and whites has changed over the entire period: It is easy to draw obvious conclusions from these graphs:


- On average, whites commit slightly more racist crimes per year, but 4-5 times less often in specific terms (in other words, an African American is 4-5 times more likely to commit a racist crime than whites).
- Nevertheless, since the 1990s, the proportion of racist crimes among blacks has been gradually falling, having dropped by half in a quarter of a century.
- , , , . : , . , ( ) 1993 , , , , - .
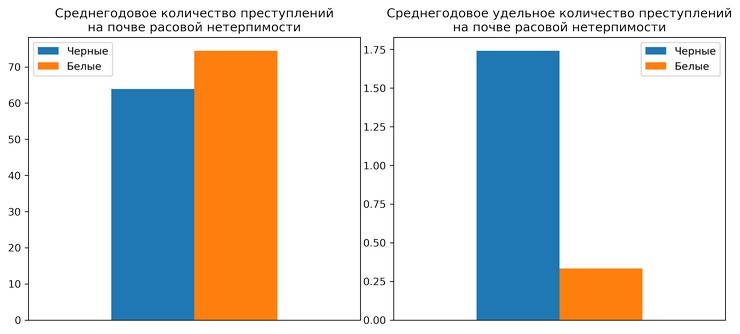
Let's take a look at the generalized (annual average) indicators: Once again we are convinced of the observations made: on average, whites commit 15-16% more racist crimes, but at the same time, due to the difference in the number of whites and blacks, as we know, almost in 6 times, Black is as many times more likely to commit such crimes.
Is it only white against black, black against white?
Let's add the intolerance parameter to our generalized indicators, i.e. motive for the crimes. As you remember, as a result of filtering, we left only two motives: intolerance of the white race and intolerance of the black race. How are they distributed between white and black criminals? 100% polar, of course? But no! Of course, the polarization is obvious, but it turns out that there are crimes committed by blacks on the basis of racial hostility to their own, and the same is true among whites. (I am sure that there are also crimes committed by homosexuals motivated by hatred of homosexuals, by women motivated by hatred of women, etc., because “man” sounds

But what is curious here: the share of crimes committed by blacks motivated by hatred of their own is 11% of all crimes committed by blacks, while for whites this figure is 9%. That is, a black person has a slightly higher chance of turning against his own people.
Geography of crimes
Finally, let's look at the distribution of racist
us_pop_states_race_2010-2019.csv.
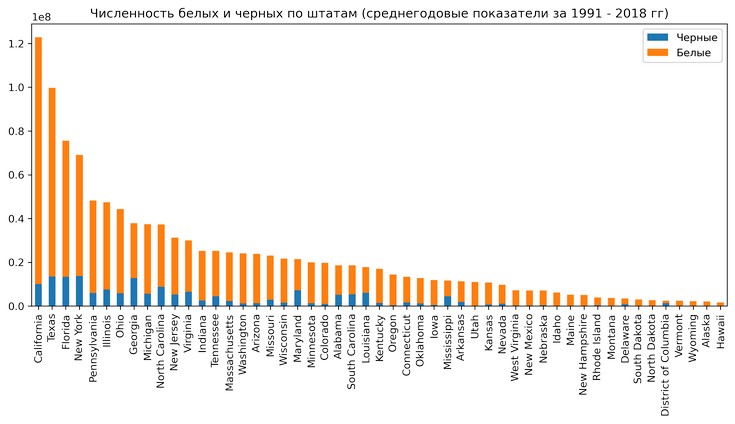
State Averages for Whites and Blacks: OK, Nothing New: Overpopulated California, Texas, Florida, and New York, where, as you could see in the last article, more crime is being committed. But is the proportion of the black population the same everywhere - the notorious 13%? Let's see: So, more than half of the entire District of Columbia (where the glorious

What about crimes? We look at the average annual indicators in absolute and specific terms:

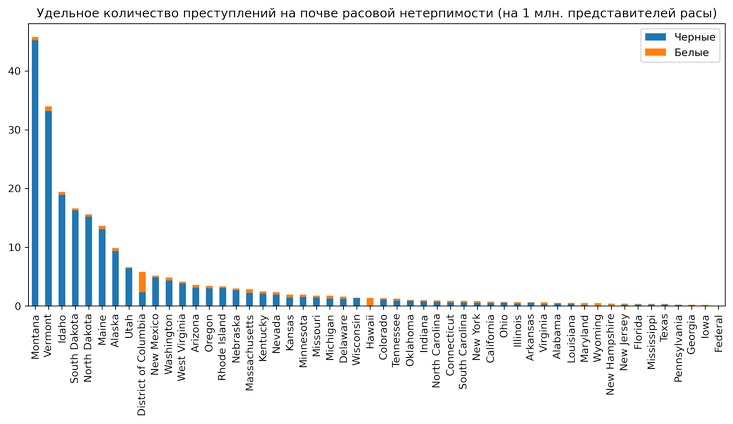
It can be seen that the most populous state, California, is the leader in the absolute number of crimes. But then Florida and Texas were pushed aside by Michigan, Illinois and Maryland - the economically more developed northern states. And on the specific schedule, the least populated states - Montana, Vermont, Idaho, North and South Dakota, Alaska (all also in the north of the country) - are ahead. At the same time, it is clear that the proportion of crimes between whites and blacks is not the same across states, despite the dominance of blacks in terms of specific indicators (for example, the District of Columbia and Hawaii stand out in the "white" side).
We will display it on the map (for greater clarity, we will replace the average annual indicators with the accumulated amount).
First in absolute terms:
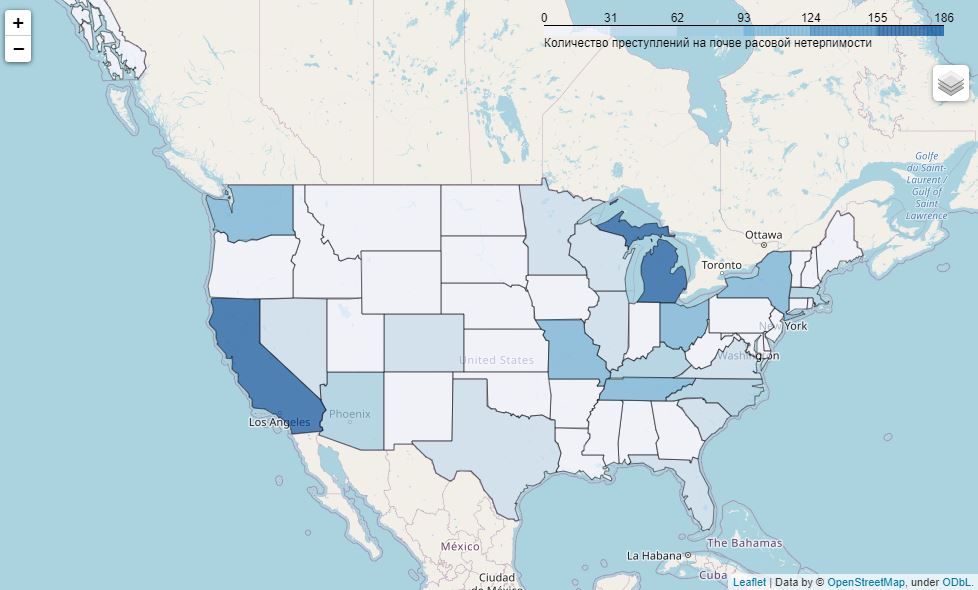
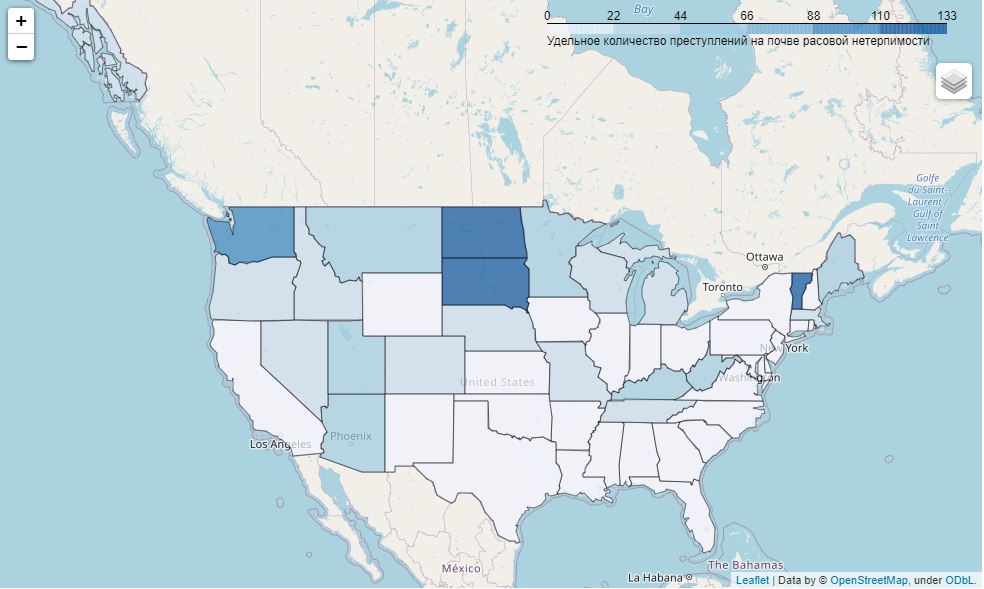
Here stands out the northeast of the country (especially Michigan) plus California and Washington on the Pacific coast. And in specific terms: The prevalence of the north with the least populated states is noticeable here: the District of Columbia, both Dakotas and all the same Washington, as well as a couple of states on the east and west sides. At the same time, the southern states do not show significant criminality among the population. In general, if you are asking the question “Where will I see more racist crimes?”, See the first card. If your question is "Where is the most likely for each person to commit a racist crime?" - see the second map. I will not draw any other conclusions regarding the distribution.
Instead of conclusions
How is Bulgakov doing? "Facts are the most stubborn thing in the world." If we are told something from all sides, it is not at all necessarily true - it may turn out to be half-truth or a lie. But having facts in your hands in the form of N-number of datasets, you yourself can confirm or refute certain arguments. You can build hypotheses and confirm / refute them by statistical methods, or you can simply consider the data without any hypotheses and find some regularities in them, which in turn will help either draw conclusions or propose hypotheses that can be further dissected. It's up to you to take everything at your word or check.
Of course, this little analysis is far from complete. It is executed superficially, because I have only considered the basic indicators, without using even a quarter of the available apparatus of mathematical statistics. Of course, one can argue about the quality of the initial data. Can all recorded data be trusted? Are all crimes recorded? Who and how determines the motives of intolerance? But as for me, I would rather analyze the official open data as-is than be content with statements like "poisonous substance X was found in Mr. N's blood" or "country W has been systematically violating human rights for decades."
PSIn the comments on my previous research, I was asked many times to separate "pure white" and "Latinos", as cultures do differ. I would not mind, but, unfortunately, this cannot be done in either case, due to the scarcity of information about this ethnicity in the initial data. So, for example, in the data that we analyze in this article, out of 79514 crimes committed by whites, only 6999 are marked with ethnicity, and only 489 are marked as “Hispanic or Latino” (this is 0.6%). Of course, such data cannot be used for analysis.