Some attractors bewitch with their beauty even in static pictures. We wanted to make an application that will be able to visualize most of the attractors in dynamics, in 3D and without lags.
About Us
We are Roman Venediktov, Vladislav Nosivskoy and Kirill Karnaukhov - second-year students of the Bachelor's program "Applied Mathematics and Computer Science" at the Higher School of Economics - St. Petersburg. We have been fond of programming since school days. All three of them were engaged in Olympiad programming and passed in different years to the final stage of the All-Russian Olympiad for schoolchildren in computer science, but they had no experience in industrial programming before, and for us this is the first large team project. We defended it as a term paper on C ++.
Modeling
There are many ways to define a dynamical system with a strange attractor, but the most common is a system of three first-order differential equations. We started with her.
Before visualizing something, you need to simulate the process itself and find the trajectories of the points. Accurate modeling methods are quite laborious, and we would like to do it as quickly as possible.
When implementing modeling, we decided to use metaprogramming, abandoning std :: function and other similar mechanics. They could have simplified architecture and coding, but they would have greatly reduced performance, which we didn't want.
Initially, the simplest Runge - Kutta method of the 4th order of accuracy with a constant step was used for modeling. So far we have not returned to increasing the number of methods and other mathematical component of the model, and now this is the only method presented. On most systems found, it is accurate enough to produce images similar to images from other sources.
The model accepts as input:
- the 'derivatives' functor for getting derivatives by the coordinates of a point;
- the 'observer' functor, which is called from the point as soon as it is received;
- simulation parameters (starting point, step size, number of points).
In the future, you can add a check to see how the presented picture matches the real one, some stronger methods for modeling (for example, by connecting the Boost.Numeric.Odeint library) and some other analysis methods for which our knowledge of mathematics is still not enough.
Systems
We found the most popular strange attractor systems to get the best performance out of them. Here we want to say thanks to the site chaoticatmospheres.com, which made this search very easy for us.
All systems had to be wrapped up so that, despite the fact that they are all "our templates", they could be put into a container and work normally with them in the controller. We came to the following solution:
- DynamicSystem ‘observer’, (, ...) std::function ‘compute’. ‘Compute’ , , ‘derivatives’ .
- std::function , DynamicSystemInternal compute .
- DynamicSystemInternal ‘observer’, ‘derivatives’. ‘derivatives’, .
We started work on adding a DynamicSystemWrapper, which would own the DynamicSystem and could do the preprocessing required for visualization (selection of a constant for normalization, acceptable error for methods with step length control ...), but did not have time to finish.
Visualization
We chose OpenGL as a rendering library because of its performance and capabilities, as well as Qt5, which has a convenient wrapper over OpenGL.
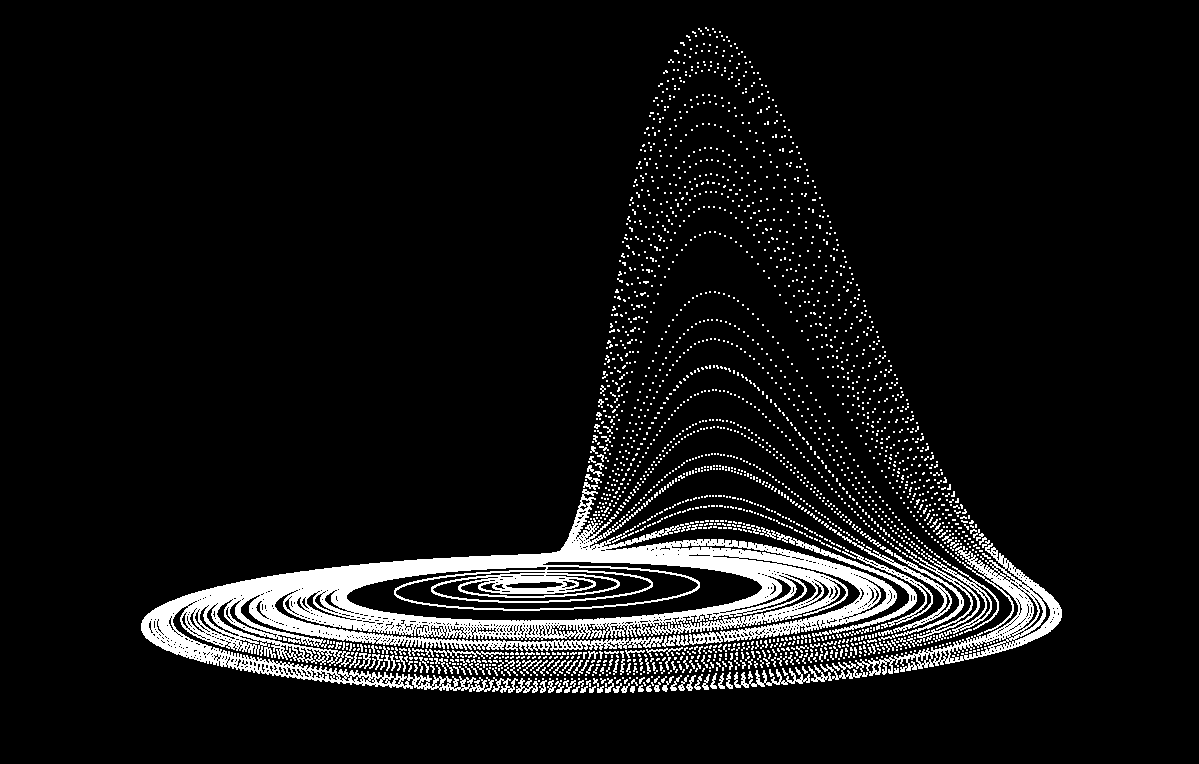
To begin with, we wanted to learn how to draw at least something, and after a while we were able to make our first cube. Shortly thereafter, a simple version of the mathematical model appeared, and here is the first visualization of the attractor:
With the first version of the rendering, a very simple version of the camera was also ready. She knew how to rotate around one point and approach / move away. We wanted more freedom in space: attractors are different, and they need to be explored in different ways. Then a second version of the camera appeared, which could freely rotate and move in all directions (we were guided by the camera in Minecraft). At that time, linear algebra was just beginning, and therefore there was not enough knowledge: we had to look for a lot of information on the Internet.
All this time the pictures were white, static and uninteresting. I wanted to add colors and dynamics. To begin with, we learned how to paint the whole picture in one color, but that also turned out to be uninteresting. Then we came up with the following solution:
- Take a lot (100-500, you can choose more in the settings, the main thing is that the performance is enough) close to each other starting points.
- Simulate the trajectory from each of them.
- Render the trajectories at the same time, while coloring them in different colors, and show only the segment of the trajectory.
It turned out the following:
Approximately such a scheme remained until the end.
It struck us that the lines are too "angular", and we decided to learn how to smooth them. Of course, we tried to reduce the simulation step, but, unfortunately, even modern processors are not able to count such a number of points. It was necessary to look for another option.
At first we thought that OpenGL should have a line smoothing tool, but after a lot of searching, we discovered that this is not the case. Then the idea came up to interpolate the curves and add a few more between each pair of neighboring points that are far enough away. To do this, it was necessary to choose a method for interpolating curves, and there are many such methods. Alas, most of them (for example, the Bezier curve) required a few more points to be specified, which was clearly not suitable for our task: we wanted the result to depend only on what the mathematical model gave us. After a while, we found a suitable interpolation: the Catmull - Roma curve. It turned out like this:
After that, we decided that it would be nice to record videos inside the app. We wanted to keep it cross-platform, so we settled on the libav library (there was almost no choice among the libraries). Unfortunately, the entire library is written in C and has a very awkward interface, so it took us a long time to learn how to write something. All subsequent gifs are made using the built-in recording.
Up to this point, all curve colors have been explicitly specified at creation. We decided that for a beautiful picture we need to set colors differently. To do this, only control colors began to be indicated, and the rest were calculated using a linear gradient. This part was transferred to shaders (before that they were standard).
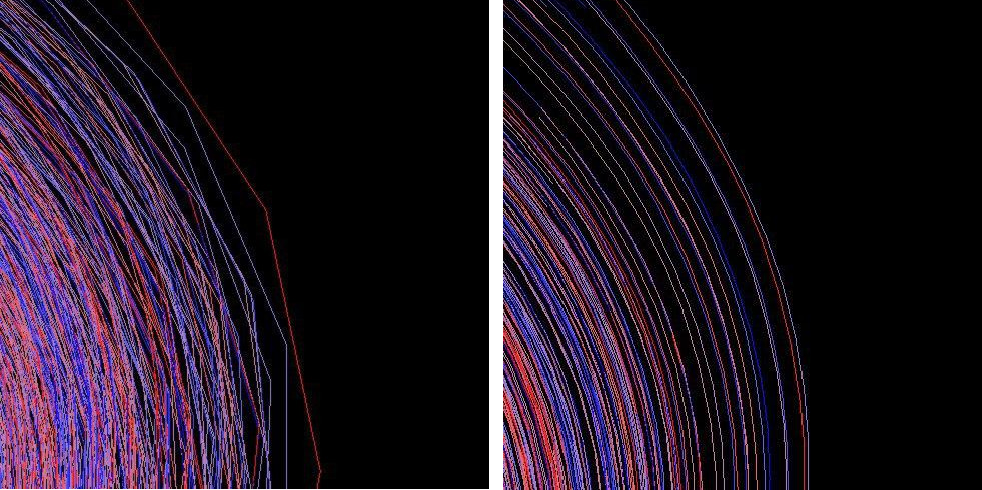
We found it interesting to color the trajectories in such a way that each of them changes color from head to tail. This allows you to observe the effect of speed:
Then we thought that it was worth trying to reduce the preprocessing time for the trajectory: interpolating a curve is an "expensive" operation. It was decided to transfer this part to shaders so that the GPU calculates the interpolation every time it is asked to draw a part of the trajectory. For this, we used the Geometry Shader. This solution gave many advantages: no delay on the rendering side before drawing, the ability to smooth curves even more (such calculations are performed on the GPU faster than on the CPU), the use of less RAM (before that, all interpolated points had to be stored, now - no ).
Controller and user interface
After choosing Qt5 as the base framework, the question of choosing technologies for the interface disappeared immediately. The built-in Qt Creator sufficiently satisfies all the needs of a small application.
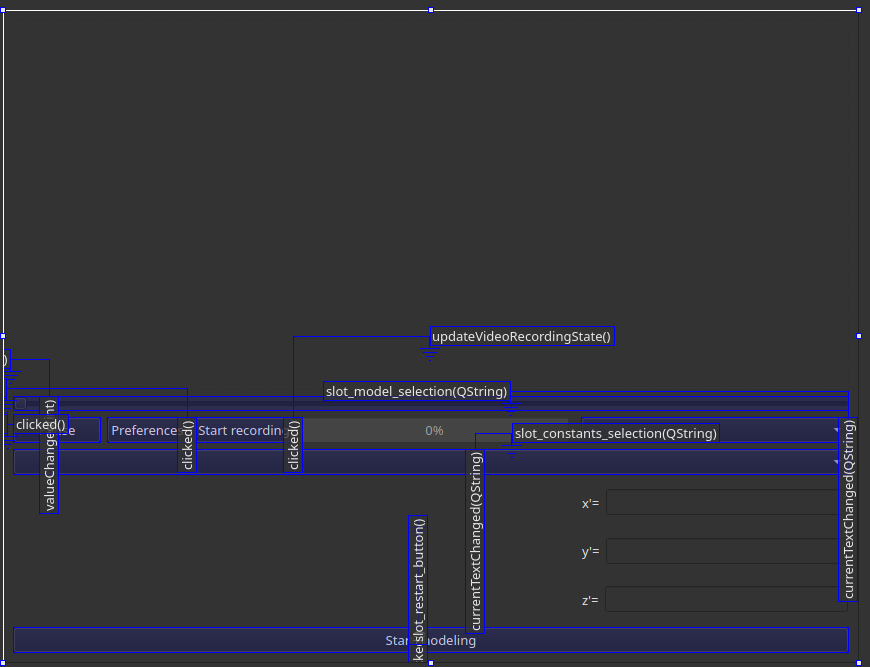
To respond to user requests, a controller had to be written. Fortunately, Qt has convenient ways to handle keystrokes and enter values into fields. This uses the main idea of Qt - the signals and slots mechanism. For example, if in our application we press the button responsible for rebuilding the model, a signal will be generated that will be accepted by the handler slot. It will start the rebuild itself.
When developing almost any application with an interface, sooner or later the idea of making the application multi-threaded comes up. It seemed necessary to us: building built-in models took several seconds, and building a custom one took 10 seconds. At the same time, of course, the interface hung, because all calculations were carried out in one thread. For a long time we discussed different options and thought about asynchrony using std :: async, but in the end we realized that we wanted to be able to interrupt calculations in another thread. To do this, I had to write a wrapper over std :: thread. Everything is as simple as possible: an atomic flag for checking and a neat interrupt if the check fails.
This gave not only the desired result - the interface stopped hanging - but also added some feature: due to the peculiarities of the architecture and the interaction between model data and visualization, it became possible to draw everything online, right in the course of counting. Previously, you had to wait for all data.
Custom systems
There are many attractors already provided in the application, but we also wanted to allow the user to enter the equations themselves. For this, we wrote a parser that supports variables (x, y, z), standard mathematical operations (+ - * / ^), constants, many mathematical functions (sin, cos, log, atan, sinh, exp, etc.) and brackets. This is how it works:
- The original query string is tokenized. Next, tokens are parsed from left to right and an expression tree is built.
- Possible operations are divided into groups. Each group has its own Node. Groups: plus-minus, multiplication-division, exponentiation, unary minus, so-called sheets (this includes constants, variables, function calls).
- Each group has its own level of computation. Each level causes recursive calculations at the next levels. You can see that the order of calls affects the distribution of priorities of operations. We have them in the order described above.
Look for more details in the parser source code .
Each level returns some kind of inheritor of the Node. There are four of them:
- binary operator - stores pointers to two children and its own type of operation;
- unary operator - stores a pointer to the child and its own operation type. This includes functions, since this is a special case of a unary operation;
- constant - stores its value;
- variable - stores a pointer to the place in memory where its value lies.
The Node structure only has a virtual calc function that returns the value of its subtree.
The resulting output is very conveniently tailored to the previously described system architecture. A lambda is simply passed to DynamicSystemInternal, which stores pointers to the root nodes of the three obtained trees and the xyz memory positions of the values. When called, it changes the values there to those provided and calls calc from the root vertices.
Outcome
As a result, we got a program that can visualize user-defined systems and has a base of a large number of attractors. She does it quite nicely and optimized, which is good news.
But there is still a lot of work:
- add more precise methods;
- add one more layer of systems processing (normalization and automatic error selection in more complex methods);
- improve work with user systems (support for variables, saving);
- optimize their work (JIT compilation or a utility that converts the saved systems to c ++ code and simply starts the recompilation so that they achieve the performance of embedded systems);
- add capabilities for results analysis or visualization that people who work with such systems really need;
- ...
Our repository .
And a few more videos with attractors: