 Hello Habitants! The Site Reliability Engineering book sparked a heated discussion. What is exploitation today, and why are reliability issues so fundamental? Now the Google engineers behind this best-selling book propose moving from theory to practice - the Site Reliability Workbook shows how SRE principles and practices are embodied in your production Google's expertise is complemented by Google Cloud Platform user cases. Representatives of Evernote, The Home Depot, The New York Times and other companies describe their combat experience, tell which practices they have adopted and which have not. This book will help you adapt SRE to the realities of your own practice, no matter the size of your company. You will learn to:
- Ensure the reliability of services in clouds and environments that you do not fully control;
- apply various methods of creating, launching and monitoring services, focusing on SLO;
- transform admin teams into SRE engineers;
- implement methods of starting SRE from scratch and based on existing systems. Betsy Beyer, Neil Richard Murphy, David Renzin, Kent Kawahara, and Stephen Thorne are all involved in ensuring the reliability of Google systems.
Monitoring system management
Your monitoring system is just as important as any other service you use. Therefore, monitoring should be treated with due care.
Treat your configuration as code Treating your
system configuration as code and storing it in a version control system is a common practice, with options such as storing change history, linking specific changes to the task management system, simplified rollbacks, static code analysis for errors, and forced code inspection procedures.
We also strongly recommend treating the monitoring configuration as code (for more information on configuration, see Chapter 14). A monitoring system that supports customization using well-formed descriptions of goals and functions, rather than systems providing only web interfaces or CRUD-style APIs (http://bit.ly/1G4WdV1). This configuration approach is standard for many open source binaries that only read a configuration file. Some third party solutions such as grafanalib (http://bit.ly/2so5Wrx) support this approach for components that are traditionally customizable using the UI.
Encourage consistency
Large companies with multiple project teams that use monitoring need to strike a delicate balance: on the one hand, a centralized approach ensures consistency, but on the other hand, individual teams may want to have complete control over how their configuration works.
The right decision depends on the type of your organization. Over time, Google's approach has evolved towards bringing together all of the best practices in a single platform that works as a centralized service. This is a good decision for us, and there are several reasons for this. A common infrastructure allows engineers to move from one team to another faster and easier and makes it easier to collaborate while debugging. In addition, there is a centralized dashboarding service where each team's dashboards are open and accessible. If you understand well the information provided by the other team, you can quickly fix both your own problems and the problems of other teams.
Whenever possible, keep basic monitoring coverage as simple as possible. If all of your services export a consistent set of baselines, you can automatically collect those metrics across your organization and provide a consistent set of dashboards. This approach means that there is basic monitoring for any new component that you launch automatically. This way, many teams in your company - not even engineering ones - will be able to use the monitoring data.
Prefer Loose Connections
Business requirements change and your production system will look different in a year. Just like the services you control, your monitoring system must develop and evolve over time, passing through various typical problems.
We recommend that the coupling between the components of your control system is not very strong. You must have reliable interfaces to configure each component and transfer monitoring data. Different components should be responsible for collecting, storing, alerting and visualizing your monitoring data. Stable interfaces make it easy to replace any particular component with the most appropriate alternative.
In the open source world, breaking down functionality into separate components is becoming popular. Ten years ago, monitoring systems such as Zabbix (https://www.zabbix.com/) combined all functions into one component. Modern design usually involves separating the collection and execution of rules (using solutions such as the Prometheus server (https://prometheus.io/)), storing long-term time series (InfluxDB, www.influxdata.com ), aggregating alerts ( Alertmanager, bit.ly/2soB22b ) and creating dashboards (Grafana, grafana.com ).
At the time of this writing, there are at least two popular open standards that allow you to equip software with the necessary tools and provide metrics:
- statsd — , Etsy, ;
- Prometheus — , . Prometheus OpenMetrics (https://openmetrics.io/).
A separate dashboard system using multiple data sources provides a centralized and unified view of your service. Google recently experienced this advantage in practice: our legacy monitoring system (Borgmon1) combined dashboards in the same configuration as alert rules. When switching to a new system (Monarch, youtu.be/LlvJdK1xsl4 ), we decided to move the dashboards to a separate service (Viceroy, bit.ly/2sqRwad ). Viceroy was not a Borgmon or Monarch component, so Monarch had fewer functional requirements. Since users can use Viceroy to display graphs based on data from both monitoring systems, they were able to gradually migrate from Borgmon to Monarch.
Meaningful Metrics
Chapter 5 explains how you can use quality of service (SLI) metrics to track and report threats to your budget. SLI metrics are the first metrics to check when alerts are triggered based on Quality of Service (SLO) targets. These metrics should appear on your service's dashboard, ideally on the front page.
When investigating the root cause of an SLO violation, you will most likely not get enough information from the SLO panels. These panels show that there are violations, but you are unlikely to know about the reasons that led to them. What other data should be displayed on the dashboard?
We believe the following guidelines will be helpful when implementing metrics: These metrics should provide meaningful monitoring that allows you to investigate operational issues and provide a wide range of information about your services.
Intentional changes
When diagnosing SLO-related alerts, you need to be able to move from alert metrics that notify you of issues affecting users to metrics that alert you to the root cause of those issues. Such reasons could be recent deliberate changes to your service. Add monitoring that informs you of any changes in production. To detect the fact that changes have been made, we recommend the following:
- monitoring the version of a binary file;
- , ;
- , .
If any of these components are not versioned, you need to track when the component was last assembled or packaged.
When trying to correlate emerging service issues with a deployment, it is much easier to look at a chart or panel referenced in an alert than to flip through the CI / CD logs after the fact.
Dependencies
Even if your service hasn't changed, any of its dependencies can change. Therefore, you also need to keep track of the responses coming from direct dependencies.
It is wise to export request and response size in bytes, response times and response codes for each dependency. When choosing a metric for a chart, keep these four golden signals in mind (see section"The Four Golden Signals," Chapter 6 of Site Reliability Engineering ).
You can use additional labels in the metrics to separate them by response code, RPC (remote procedure call) method name, and the name of the service being called.
Ideally, instead of asking each RPC client library to export such labels, you can tool the lower-level RPC client library for this purpose once. This provides more consistency and allows you to easily monitor new dependencies.
There are dependencies that offer a very limited API, where all the functionality is available through a single RPC method called Get, Query, or just as uninformative, and the actual command is specified as arguments to that method. The single-point approach to tools in the client library does not work for this type of dependency: you will see a lot of variability in latency and a certain percentage of errors that may or may not indicate that some part of this "muddy" The API has completely fallen off. If this dependency is critical, good monitoring for it can be implemented in the following ways.
- Export individual metrics designed specifically for this dependency, where requests will be unpacked to obtain a valid signal.
- Ask the owners of the dependency to rewrite it to export an extended API that supports separation of functions between individual RPC services and methods.
The level of workload
It is desirable to control and track the use of all resources with which the service works. Some resources have hard limits that you cannot exceed. For example, the size of RAM, hard disk allocated to your application, or CPU quota. Other resources, such as open file descriptors, active threads in any thread pools, queue timeouts, or the amount of logs written, may not have a clear hard cap, but still need to be managed.
Depending on the programming language you are using, you need to keep track of some additional resources:
- in Java, heap and metaspace size (http://bit.ly/2J9g3Ha), as well as more specific metrics depending on the type of garbage collection used;
- in Go, the number of goroutines.
The programming languages themselves provide various support for keeping track of these resources.
In addition to alerting you to significant events, as described in Chapter 5, you may also want to set up alerts that are triggered when certain resources are nearing critical depletion. This is useful, for example, in the following situations:
- when the resource has a hard limit;
- when a performance degradation occurs when the usage threshold is exceeded.
Monitoring is essential for all resources, even those that are well managed by the service. These metrics are vital when planning resources and capabilities.
Issued traffic status
It is recommended to add metrics or metric labels on the dashboard that will allow you to break the issued traffic by status code (if the metrics used by your service for SLI purposes do not contain this information). Here are some guidelines.
- Keep track of all response codes for HTTP traffic, even those that, due to possible incorrect client behavior, are not a reason for issuing alerts.
- If you are applying time limit or quota limits to your users, keep track of the number of requests denied due to lack of quota.
Plots of this data can help you determine when the error rate changes noticeably during a production change.
Implementation of target metrics
Each metric should serve its purpose. Don't be tempted to export multiple metrics just because they are easy to generate. Instead, think about how they will be used. Metrics architecture (or lack thereof) has implications. Ideally, the metric values used for alerting change abruptly only when a problem occurs in the system, and during normal operation they remain unchanged. On the other hand, these requirements are not imposed on debug metrics - they should give an idea of what happens when an alert is triggered. Good debug metrics will indicate potentially problematic parts of the system. When writing a postmortem, think about what additional metrics would allow you to diagnose the problem faster.
Testing the alert logic
In an ideal world, monitoring and alerting code should follow the same testing standards as development code. There is currently no widely accepted system that would allow you to implement such a concept. One of the first signs is the newly added rule unit testing functionality to Prometheus.
At Google, we test our monitoring and alerting systems using a domain-specific language that allows us to create synthetic time series. We then either check the values in the derived time series, or we clarify whether a particular alert has fired and has the required label.
Monitoring and issuing alerts is often a multi-step process, so multiple families of unit tests are required.
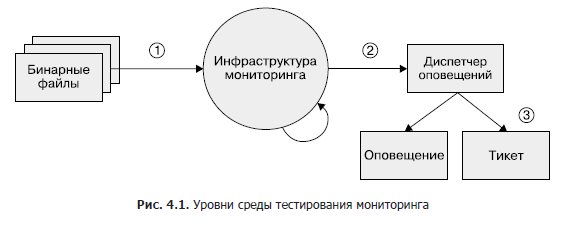
Although this area remains largely underdeveloped, if you wish to implement monitoring testing at some point, we recommend a three-tiered approach, as shown in Figure 1. 4.1.
- Binary files. Make sure the exported metric variables change values as expected under certain conditions.
- Monitoring infrastructure. Make sure that the rules are followed and the specific conditions are the expected alerts.
- Alert manager. Verify that the generated alerts are routed to a predefined destination based on label values.
If you cannot test your monitoring system with synthetic tools, or if a step is not testable at all, consider creating a production system that exports known metrics such as requests and errors. You can use this system to check time series and alerts. It's likely that your alert rules won't fire for months or years after you've set them up, and you need to make sure that when the metric goes over a certain threshold, the alerts remain meaningful and delivered to the intended engineers.
Chapter Summary
Since SR engineers must be responsible for the reliability of production systems, these specialists are often required to deeply understand the monitoring system and its functions and interact closely with it. Without this data, SREs may not know where to look and how to identify abnormal system behavior or how to find information they need during an emergency.
We hope that by pointing out the functions of the monitoring system that are useful from our point of view and justifying our choice, we can help you assess how your monitoring system meets your needs. In addition, we'll help you explore some of the additional features you can use and review the changes you are likely to want to make. You will most likely find it useful to combine sources of metrics and logs in your monitoring strategy. The right mix of metrics and logs is highly context dependent.
Be sure to collect metrics that serve a specific purpose. These are goals such as improving bandwidth scheduling, debugging, or reporting problems that arise.
When you have monitoring, it should be visual and useful. To do this, we recommend testing its settings. A good monitoring system pays dividends. Thorough pre-planning of which solutions to use to best cover your specific requirements, as well as continuous iterative improvements to the monitoring system, is an investment that will pay off.
»More details about the book can be found on the website of the publishing house
» Table of Contents
» Excerpt
For Habitants a 25% discount on coupon - Google
Upon payment for the paper version of the book, an e-book is sent to the e-mail.