The fact is that all our teams are built around separate information systems, microservices and fronts, so the teams do not see the overall health of the entire system as a whole. For example, they may not know how a small part in the deep backend affects the front end. The range of their interests is limited to the systems with which their system is integrated. If the team and its service A have almost nothing to do with service B, then such a service is almost invisible to the team.
Our team, in turn, works with systems that are very strongly integrated with each other: there are many connections between them, this is a very large infrastructure. And the work of the online store depends on all these systems (of which, by the way, we have a huge number).
So it turns out that our department does not belong to any team, but is a little aloof. Throughout this story, our task is to understand in a complex way how information systems work, their functionality, integrations, software, network, hardware, and how all this is interconnected.
The platform on which our online stores operate looks like this:
- front
- middle-office
- back-office
As much as we would like, but there is no such thing that all systems work smoothly and flawlessly. The point, again, is the number of systems and integrations - with such as we have, some incidents are inevitable, despite the quality of testing. Moreover, both within a separate system and in terms of their integration. And you need to monitor the state of the entire platform comprehensively, and not any separate part of it.
Ideally, monitoring the health of the entire platform should be automated. And we came to monitoring as an inevitable part of this process. Initially, it was built only for the front-line part, while network specialists, software and hardware administrators had their own monitoring systems by layers. All these people followed the monitoring only at their own level; no one had a comprehensive understanding either.
For example, if a virtual machine crashed, in most cases only the administrator responsible for the hardware and the virtual machine knows about it. In such cases, the front team saw the very fact of the application crash, but they did not have data on the virtual machine crash. And the administrator can know who the customer is, and roughly imagine what is running on this virtual machine right now, provided that this is some kind of large project. He probably doesn't know about the little ones. In any case, the administrator needs to go to the owner, ask what was on this machine, what needs to be restored and what to change. And if something very serious broke down, they started running around in circles - because no one saw the system as a whole.
Ultimately, these disparate stories affect the entire front-end, users, and our core business function, online sales. Since we are not part of a team, but are engaged in the operation of all e-commerce applications as part of an online store, we took on the task of creating a comprehensive monitoring system for the e-commerce platform.
System structure and stack
We started by identifying several layers of monitoring for our systems, in the context of which we need to collect metrics. And all this had to be combined, which we did at the first stage. Now, at this stage, we are finalizing the highest quality collection of metrics for all our layers in order to build a correlation and understand how systems affect each other.
The lack of comprehensive monitoring at the initial stages of launching applications (since we began to build it when most of the systems were in operation) led to the fact that we had a significant technical debt to set up monitoring of the entire platform. We could not afford to focus on setting up the monitoring of a single IS and to work out monitoring for it in detail, since the rest of the systems would have been left without monitoring for some time. To solve this problem, we have identified a list of the most necessary metrics for assessing the state of the information system by layers and began to implement it.
Therefore, they decided to eat the elephant in parts.
Our system consists of:
- hardware;
- operating system;
- software;
- UI parts in the monitoring application;
- business metrics;
- integration applications;
- information security;
- networks;
- traffic balancer.
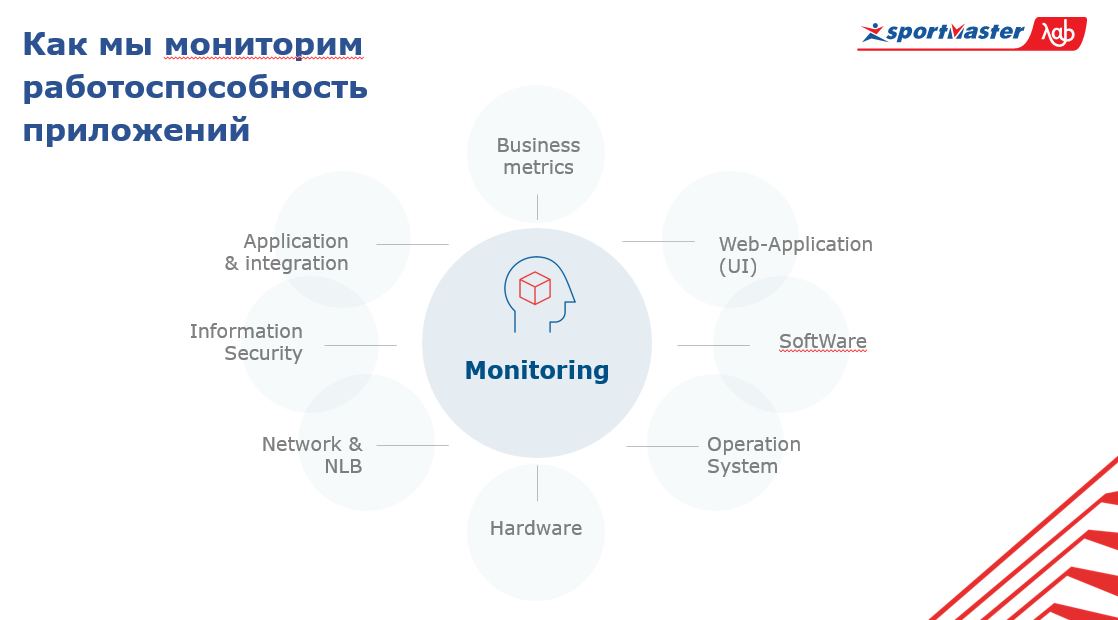
At the center of this system is monitoring itself. In order to generally understand the state of the entire system, you need to know what is happening with the applications on all these layers and in the context of the entire set of applications.
So, about the stack.

We use open source software. At the center we have Zabbix, which we use primarily as an alert system. Everyone knows that it is ideal for monitoring infrastructure. What does this mean? These are the low-level metrics that every company has that has its own data center (and Sportmaster has its own data centers) - server temperature, memory status, raid, network device metrics.
We have integrated Zabbix with Telegram messenger and Microsoft Teams, which are actively used in teams. Zabbix covers the layer of the actual network, hardware and partially software, but it is not a panacea. We enrich this data from some other services. For example, in terms of the hardware level, we connect directly via the API to our virtualization system and collect data.
What else. In addition to Zabbix, we use Prometheus, which allows monitoring metrics in a dynamic environment application. That is, we can receive application metrics via the HTTP endpoint and not worry about which metrics to load into it and which not. Based on this data, you can work out analytical queries.
Data sources for other layers, for example, business metrics, are divided into three components.
Firstly, these are external business systems, Google Analytics, we collect metrics from logs. From them we get data on active users, conversions and everything else related to the business. Secondly, it is a UI monitoring system. It should be described in more detail.
Once upon a time, we started with manual testing, and it has evolved into functional and integration autotests. We made monitoring out of it, leaving only the main functionality, and tied to markers that are as stable as possible and do not often change over time.
The new team structure implies that all application activity is locked into product teams, so we stopped doing pure testing. Instead, we made UI monitoring from tests, written in Java, Selenium and Jenkins (used as a system for launching and generating reports).
We had a lot of tests, but in the end we decided to go to the main road, the top-level metric. And if we have a lot of specific tests, it will be difficult to keep the data up to date. Each subsequent release will significantly break the entire system, and we will only be fixing it. Therefore, we tied to very fundamental things that rarely change, and only monitor them.
Finally, thirdly, the data source is a centralized logging system. For logs, we use Elastic Stack, and then we can drag this data into our monitoring system for business metrics. In addition to all this, our own Monitoring API service, written in Python, works, which polls any services via the API and takes data from them to Zabbix.
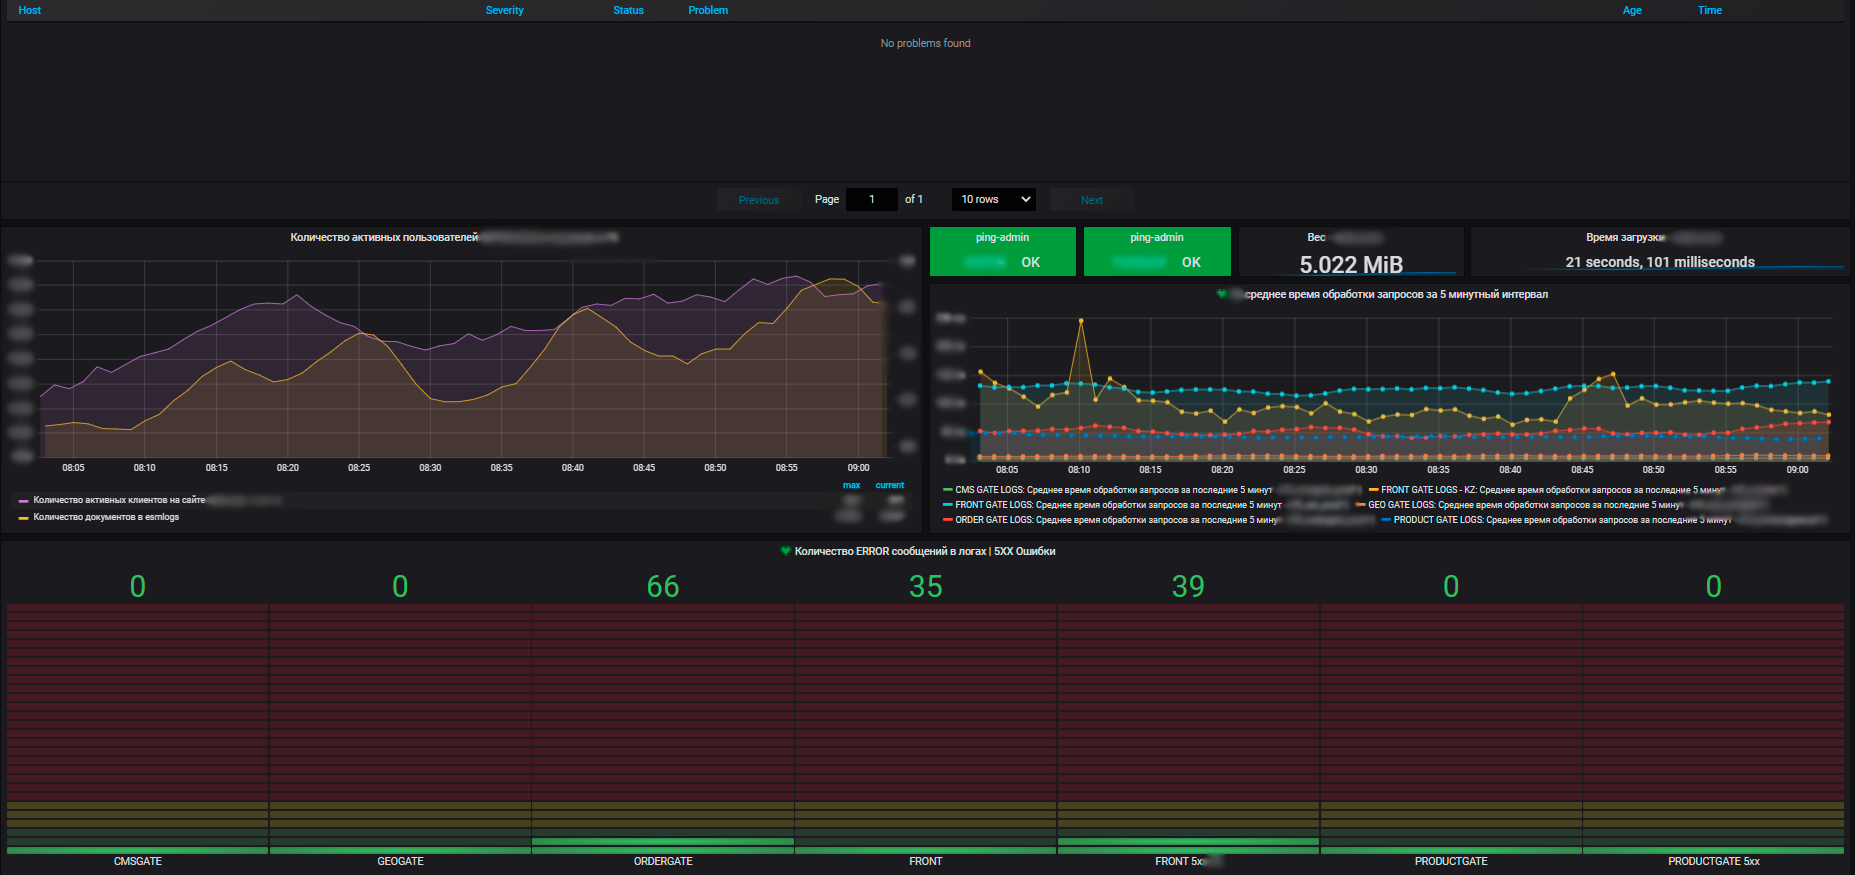
Another irreplaceable attribute of monitoring is visualization. We build it on the basis of Grafana. Among other visualization systems, it stands out in that it is possible to visualize metrics from different data sources on the dashboard. We can collect the top-level metrics of the online store, for example, the number of orders placed in the last hour from the DBMS, the performance metrics of the operating system that this online store is running on from Zabbix, and the metrics of the instances of this application from Prometheus. And all this will be on one dashboard. Visual and accessible.
Let me note about security - we are now finalizing the system, which we will subsequently integrate with the global monitoring system. In my opinion, the main problems faced by e-commerce in the field of information security are associated with bots, parsers and brute-force. This should be monitored because they can all critically affect both the performance of our applications and the reputation from a business point of view. And we successfully cover these tasks with the chosen stack.
Another important point is that the application layer is collected by Prometheus. He himself is also integrated with Zabbix. And we also have sitespeed, a service that allows us to accordingly look at parameters such as the speed of loading our page, bottlenecks, page rendering, loading scripts, etc., it is also integrated via the API. So the metrics are collected in Zabbix, respectively, we also alert from there. All alerts so far go to the main methods of sending (for now, these are email and telegram, they have recently connected MS Teams). There are plans to pump the alert to such a state that smart bots work as a service and provide monitoring information to all interested product teams.
For us, not only metrics of individual information systems are important, but also general metrics across the entire infrastructure that applications use: clusters of physical servers running virtual machines, traffic balancers, Network Load Balancers, the network itself, utilization of communication channels. Plus metrics for our own data centers (we have several of them and the infrastructure is quite significant).
The advantages of our monitoring system are that with its help we see the state of health of all systems, we can assess their impact on each other and on common resources. And ultimately, it allows for resource planning, which is also our responsibility. We manage server resources - a pool within the framework of e-commerce, introduce and decommission new equipment, buy new equipment, conduct an audit of resource utilization, and so on. Every year the teams plan new projects, develop their systems, and it is important for us to provide them with resources.
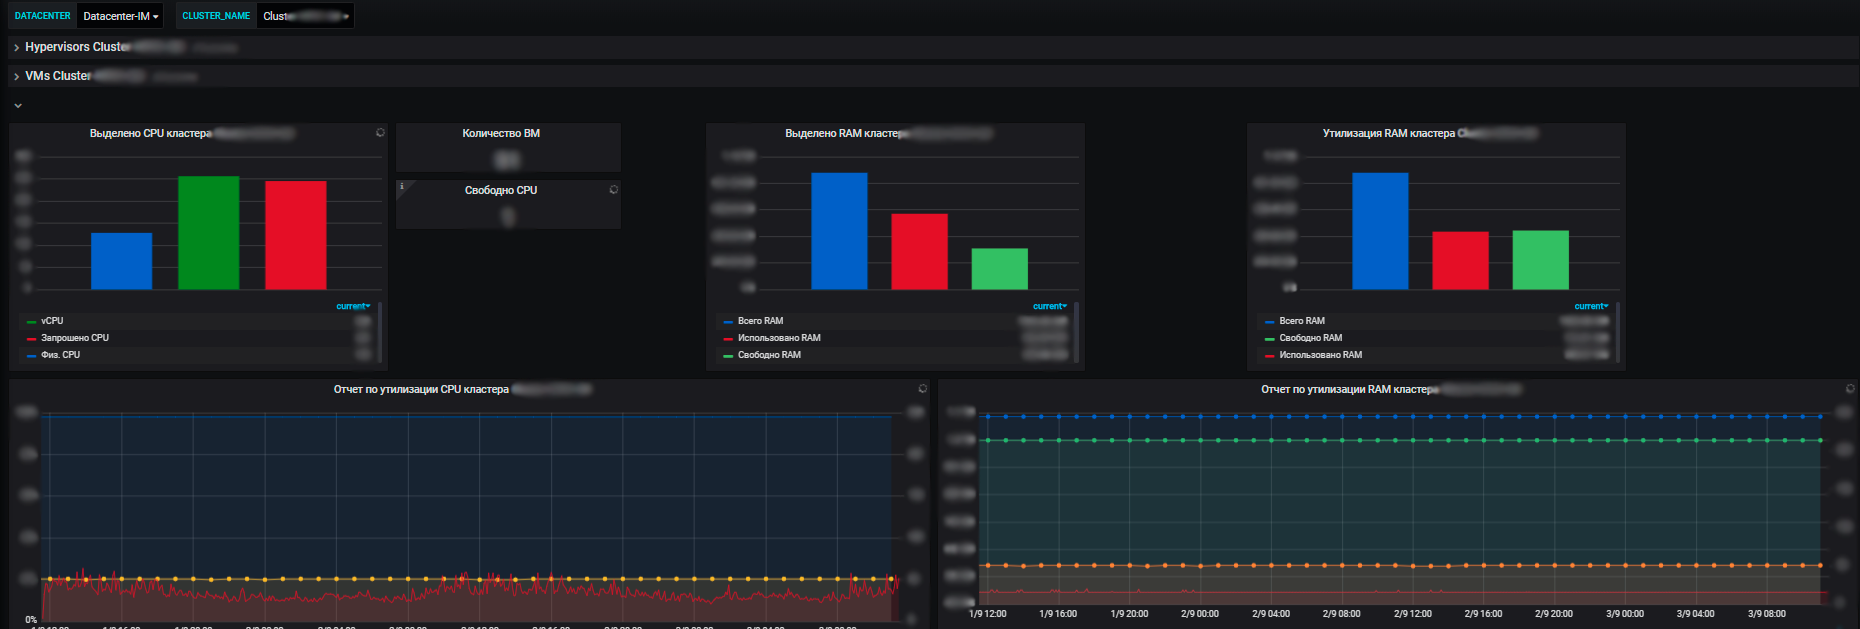
And with the help of metrics, we see the trend of resource consumption by our information systems. And already on their basis we can plan something. At the virtualization level, we collect data and see information on the available amount of resources in the context of data centers. And already inside the data center, both utilization and actual distribution, resource consumption are visible. Moreover, both with standalone servers and virtual machines and clusters of physical servers, on which all these virtual machines are vigorously spinning.
Perspectives
Now we have the core of the system as a whole ready, but there are still enough points left to work on. At least this is a layer of information security, but it is also important to get to the network, develop alerts and resolve the issue with correlation. We have a lot of layers and systems, there are many more metrics on each layer. It turns out matryoshka to the degree of matryoshka.
Our task is ultimately to make the right alerts. For example, if there was a problem with the hardware, again, with a virtual machine, and there was an important application, and the service was not backed up in any way. We find out that the virtual machine has died. Then they will alert business metrics: users have disappeared somewhere, there is no conversion, the UI in the interface is not available, software and services have also died.
In this situation, we will receive spam from alerts, and this no longer fits into the format of a correct monitoring system. The question of correlation arises. Therefore, ideally, our monitoring system should say: "Guys, your physical machine has died, and along with it this application and such metrics", with the help of one alert instead of furiously bombarding us with hundreds of alerts. She must report the main thing - the reason, which contributes to the promptness of the elimination of the problem due to its localization.
Our notification and alert handling system is built around a 24/7 hotline service. All alerts that are considered a must-have for us and are included in the checklist are sent there. Each alert must have a description: what happened, what it actually means, what it affects. And also a link to the dashboard and instructions on what to do in this case.
That's all for the requirements for the construction of the alert. Further, the situation can develop in two directions - either there is a problem and it needs to be solved, or there was a failure in the monitoring system. But in any case, you need to go and figure it out.
On average, about a hundred alerts are falling to us per day now, this is taking into account the fact that the correlation of alerts has not yet been configured properly. And if we need to carry out technical work, and we forcibly turn off something, their number grows significantly.
In addition to monitoring the systems that we operate and collecting metrics that are considered important on our side, the monitoring system allows us to collect data for product teams. They can influence the composition of the metrics within the information systems that are monitored here.
Our colleague can come and ask to add some metric that will be useful for us and for the team. Or, for example, the team may not have enough of the basic metrics that we have, they need to track some specific one. In Grafana, we create a space for each team and issue admin rights. Also, if a team needs dashboards, but they themselves cannot / do not know how to do it, we help them.
Since we are outside the stream of the team's value creation, their releases and planning, we gradually come to the conclusion that the releases of all systems are seamless and can be rolled out daily, without coordinating with us. And it is important for us to track these releases, because they can potentially affect the operation of the application and break something, and this is critical. To manage releases, we use Bamboo, from where we get data via the API and can see which releases in which information systems came out and their status. And the most important thing is what time. We put release markers on the main critical metrics, which is visually very indicative in case of problems.
This way we can see the correlation between new releases and emerging issues. The main idea is to understand how the system works on all layers, to quickly localize the problem and fix it just as quickly. Indeed, it often happens that the most time is spent not solving the problem, but finding the cause.
And in this direction in the future we want to focus on proactivity. Ideally, I would like to know in advance about an impending problem, and not after the fact, in order to deal with its prevention, not a solution. Sometimes false alarms of the monitoring system occur, both due to human error and due to changes in the application. And we are working on this, debugging, and trying to warn users about this before any manipulations on the monitoring system, who use it with us. , or carry out these events in the technical window.
So, the system has been launched and has been working successfully since the beginning of spring ... and shows a very real profit. Of course, this is not its final version, we will introduce many more useful features. But right now, with so many integrations and applications, automation of monitoring is really indispensable.
If you also monitor large projects with a serious number of integrations - write in the comments what silver bullet you found for this.