
Hello everyone, my name is Igor Sidorenko. Monitoring is one of the main areas of my work and also my hobby. I will talk about Zabbix and how to use it to monitor the information we need about NetApp volumes, with access only via SSH. Who is interested in the topic of monitoring and Zabbix, please, under cat.
Initially, we monitored volumes by mounting them to a specific server, on which a special template hung, catching NFS mounts on the node and putting them under monitoring, by analogy with the file systems of the basic Linux template. The mount had to be registered in fstab and mounted manually - because of this, a lot was lost and forgotten.
Then a great idea came to my mind: we need to automate all this. There were several options:
There are ready-made templates that work with SNMP, but no access.Getting a list of volumes and automatic mount on a node: you need to create a folder, register fstab, mount, that's all, too much hemorrhoids.There is a great API , but since we only rent space, in our version of ONTAP it is cut down and does not provide the user with the necessary information.- Somehow use SSH access to get volumes and set them up for monitoring.
The choice fell on the SSH agent .
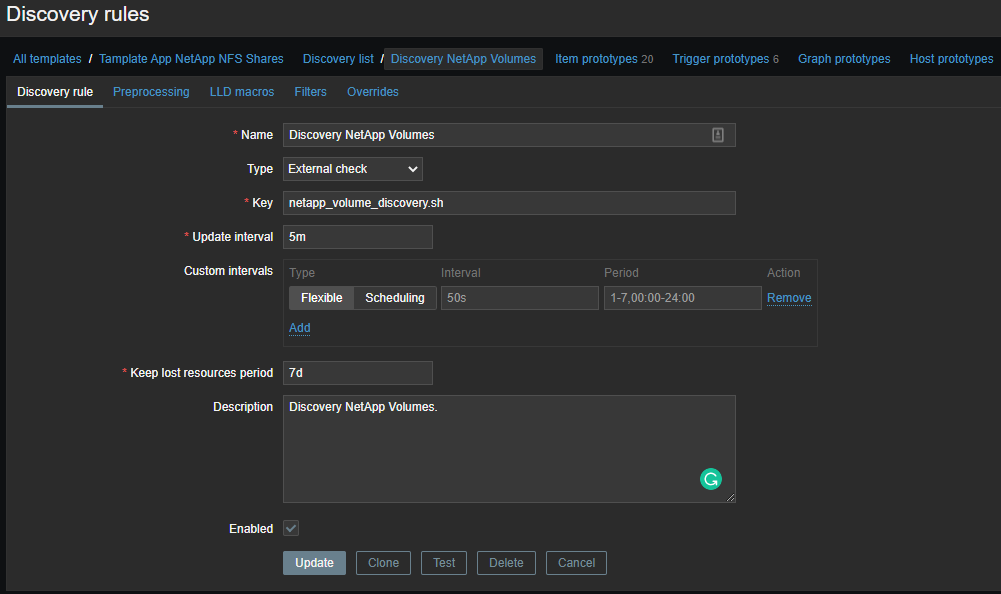
Low Level Discovery (LLD)
First, we need to create a low-level discovery (LLD) , these will be the names of our volumes. All this is necessary in order to pull out specific information on the volume we need. The raw data looks something like this (114 at the time of writing):
set -unit B; volume show -state online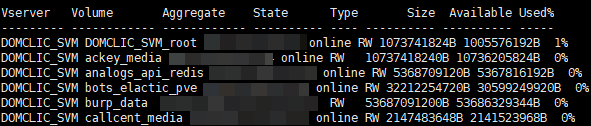
Well, how can we do without crutches: let's write a one-line bash script that will display the names of volumes in JSON format (since this is an external check , the scripts are on the Zabbix server in the directory
/usr/lib/zabbix/externalscripts):
netapp_volume_discovery.sh
#!/usr/bin/bash

SVM_NAME=""
SVM_ADDRESS=""
USERNAME=""
PASSWORD=""

for i in $(sshpass -p $PASSWORD ssh -o StrictHostKeyChecking=no $USERNAME@$SVM_ADDRESS 'set -unit B; volume show -state online' | grep $SVM_NAME | awk {'print $2'}); do echo '{"volume_name":"'$i'"}'; done | jq -s '.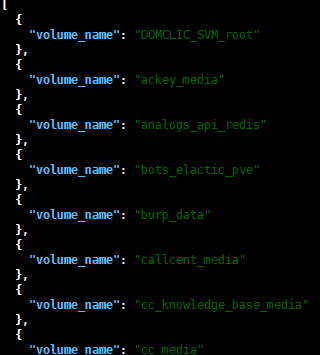
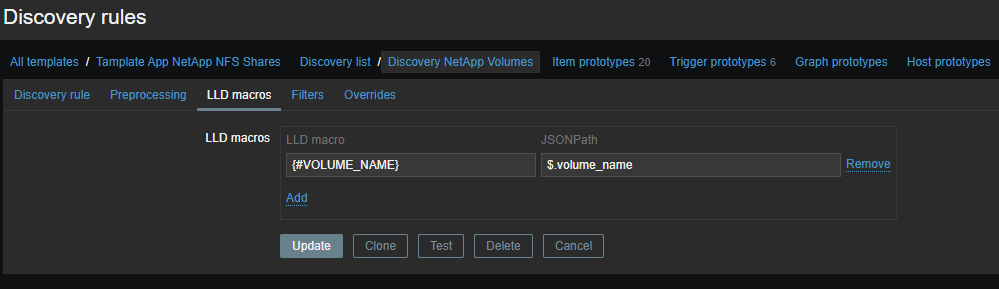
Now you need to create a template and create data items based on the received data:
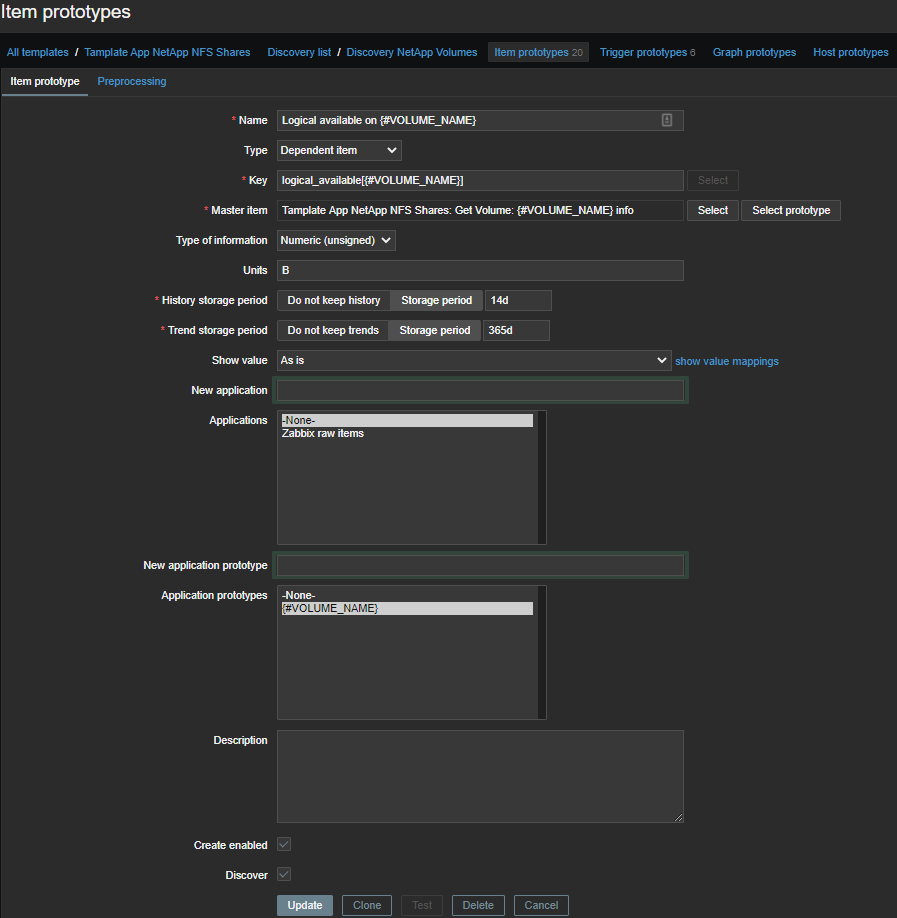
Data items
To automatically create data items, you need to prototype the items : We will use master items and a few dependent items. Thus, for each volume, one master element is created in which a set of commands over SSH is executed:
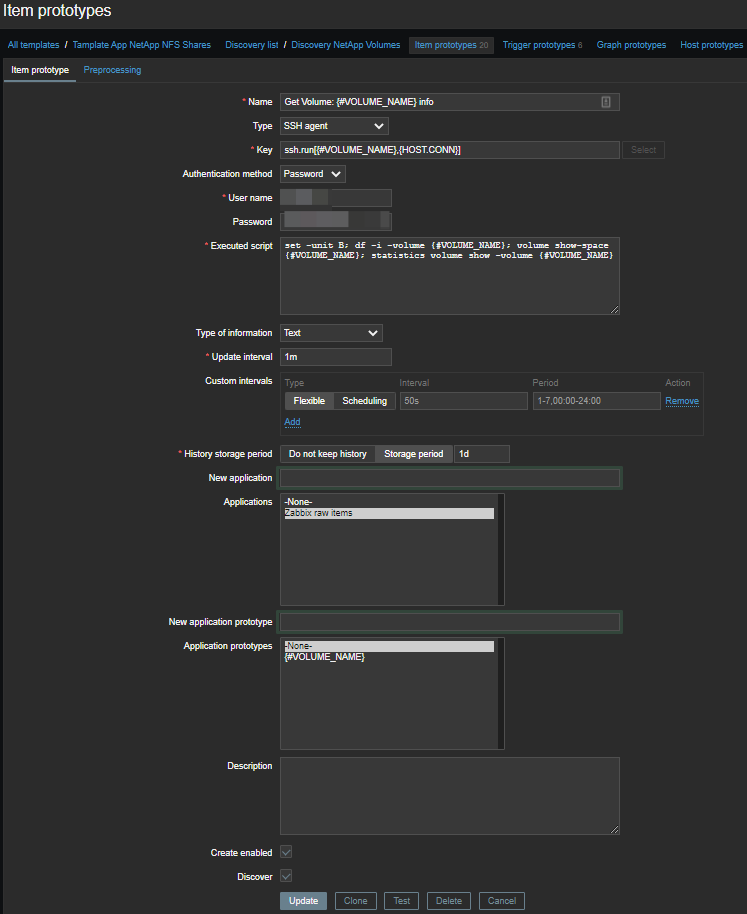
set -unit B; df -i -volume {#VOLUME_NAME}; volume show-space {#VOLUME_NAME}; statistics volume show -volume {#VOLUME_NAME}We get such a sheet:
Get Volume: ackey_media info
Last login time: 9/15/2020 12:42:45
Filesystem               iused      ifree  %iused  Mounted on

/vol/ackey_media/           96     311191      0%  /ackey_media

                      Volume Name: ackey_media
                      Volume MSID: 2159592810
                      Volume DSID: 1317
                     Vserver UUID: 46a00e5d-c22d-11e8-b6ed-00a098d48e6d
                   Aggregate Name: NGHF_FAS2720_04
                   Aggregate UUID: 7ec21b4d-b4db-4f84-85e2-130750f9f8c3
                         Hostname: FAS2720_04
                        User Data: 20480B
                User Data Percent: 0%
                    Deduplication: -
            Deduplication Percent: -
          Temporary Deduplication: -
  Temporary Deduplication Percent: -
              Filesystem Metadata: 1150976B
      Filesystem Metadata Percent: 0%
              SnapMirror Metadata: -
      SnapMirror Metadata Percent: -
             Tape Backup Metadata: -
     Tape Backup Metadata Percent: -
                   Quota Metadata: -
           Quota Metadata Percent: -
                           Inodes: 12288B
                   Inodes Percent: 0%
                   Inodes Upgrade: -
           Inodes Upgrade Percent: -
                 Snapshot Reserve: -
         Snapshot Reserve Percent: -
        Snapshot Reserve Unusable: -
Snapshot Reserve Unusable Percent: -
                   Snapshot Spill: -
           Snapshot Spill Percent: -
             Performance Metadata: 28672B
     Performance Metadata Percent: 0%
                       Total Used: 1212416B
               Total Used Percent: 0%
         Total Physical Used Size: 1212416B
         Physical Used Percentage: 0%
                Logical Used Size: 1212416B
             Logical Used Percent: 0%
                Logical Available: 10736205824B

DOMCLIC_SVM : 9/15/2020 12:42:51

                        *Total Read Write Other  Read Write Latency

     Volume     Vserver    Ops  Ops   Ops   Ops (Bps) (Bps)    (us)
----------- ----------- ------ ---- ----- ----- ----- ----- -------
ackey_media DOMCLIC_SVM      0    0     0     0     0     0       0
From this sheet, we need to select the metrics we need.
The magic of regular expressions
Initially, I wanted to use JavaScript for preprocessing , but somehow I did not master it, it did not work. Therefore, I stopped at regulars, and I use them almost everywhere.
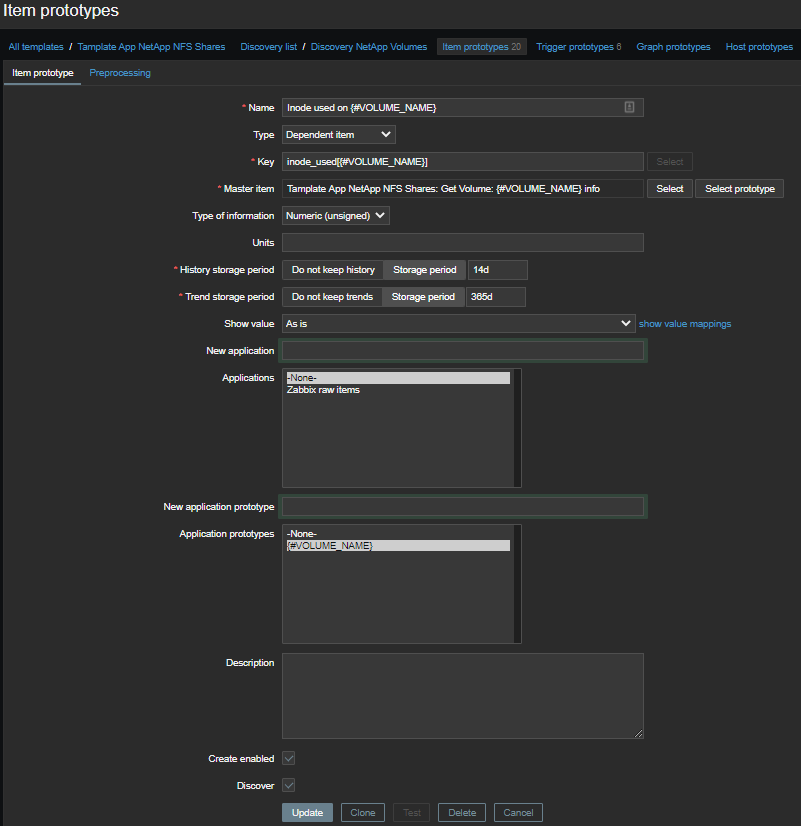
Number of inodes used
Let's select information only about inodes for each volume in two stages: First, all the information:
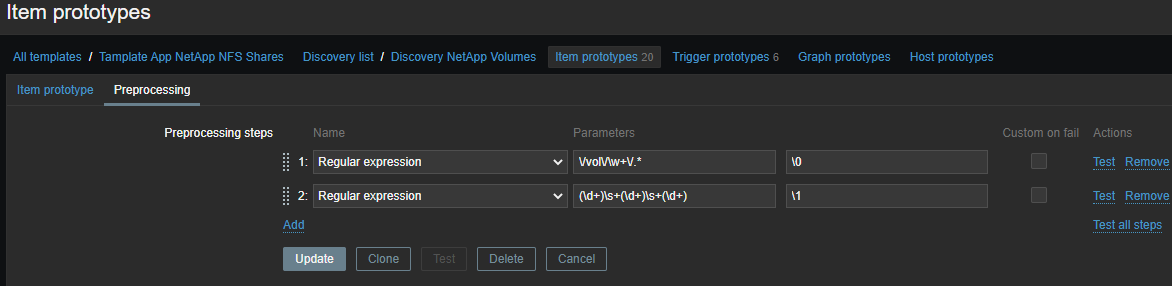
\/vol\/\w+\/.*

Then, specifically by metrics:
(\d+)\s+(\d+)\s+(\d+)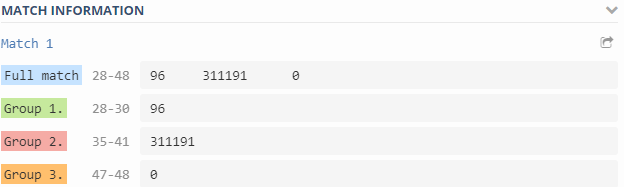
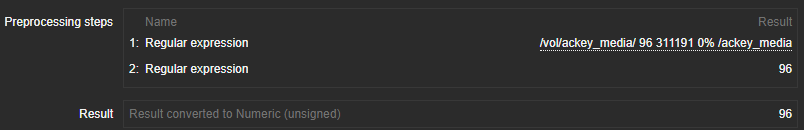
Output - Output formatting template.
\N ( N=1..9)- the escape sequence is replaced by the Nth matching group. The escape sequence \0is replaced with the matching text:
\1 - Inode used on {#VOLUME_NAME}- the number of used inodes;\2 - Inode free on {#VOLUME_NAME}- the number of free inodes;\3 - Inode used percentage on {#VOLUME_NAME}- used inodes as a percentage;Inode total on {#VOLUME_NAME}- calculated element , the number of available inodes.
last(inode_free[{#VOLUME_NAME}])+last(inode_used[{#VOLUME_NAME}])Used space
Everything is simpler here, the data and regulars are in a more pleasant format: We pull out the metric we need and take only the number:
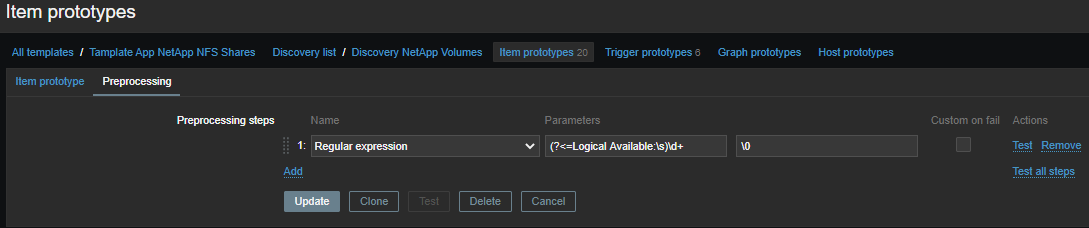
(?<=Logical Available:\s)\d+
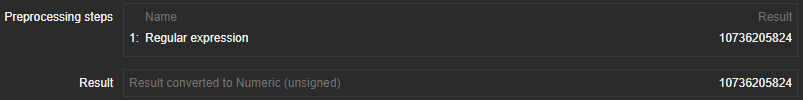
Collected metrics:
Logical available on {#VOLUME_NAME}- the amount of available logical space;Logical used percent on {#VOLUME_NAME}- used logical place in percentage;Logical used size on {#VOLUME_NAME}- the amount of used logical space;Physical used percentage on {#VOLUME_NAME}- used physical space in percentage;Total physical used size on {#VOLUME_NAME}- the amount of used physical space;Total used on {#VOLUME_NAME}- total space used;Total used percent on {#VOLUME_NAME}- total places used in percentage;Logical size on {#VOLUME_NAME}- calculated element , the amount of available logical space.
last(logical_available[{#VOLUME_NAME}])+last(total_used[{#VOLUME_NAME}])Volume performance
After reading the documentation and poking around with different commands, I found out that we can get metrics on the performance of our volumes. A small piece is responsible for this:
statistics volume show -volume {#VOLUME_NAME}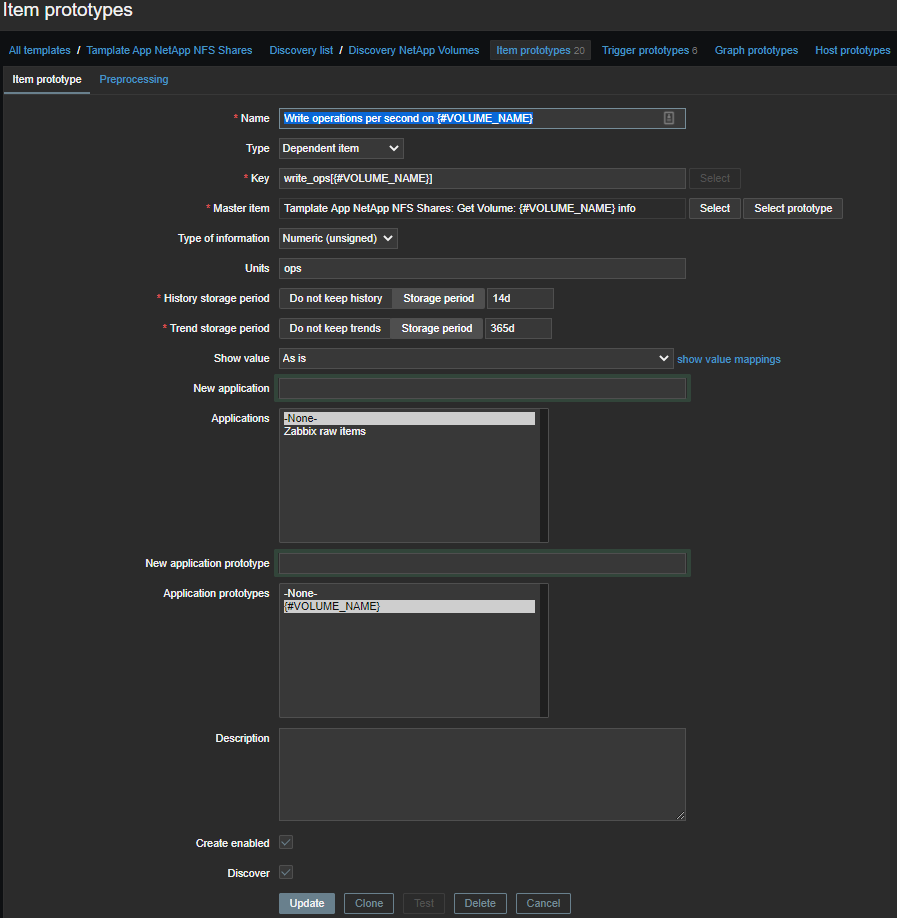
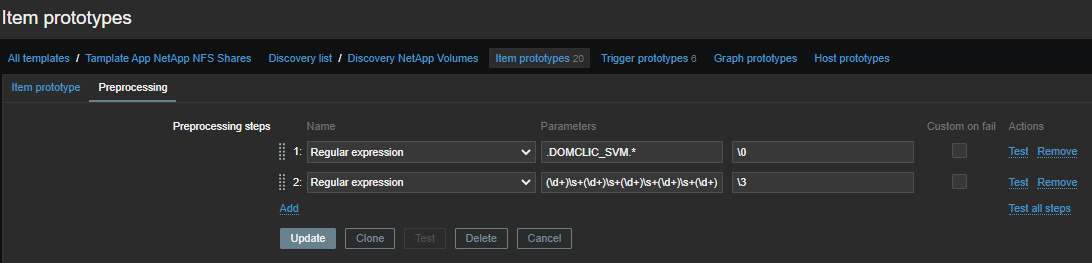
We select performance metrics from the common sheet with the first regularity:
.DOMCLIC_SVM.*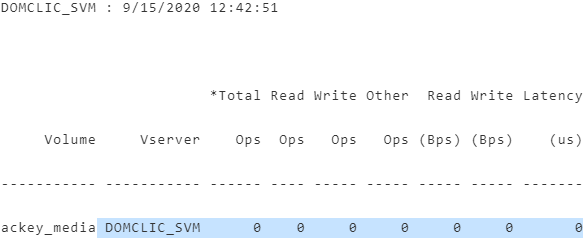

Second, we group the numbers:
(\d+)\s+(\d+)\s+(\d+)\s+(\d+)\s+(\d+)\s+(\d+)\s+(\d+)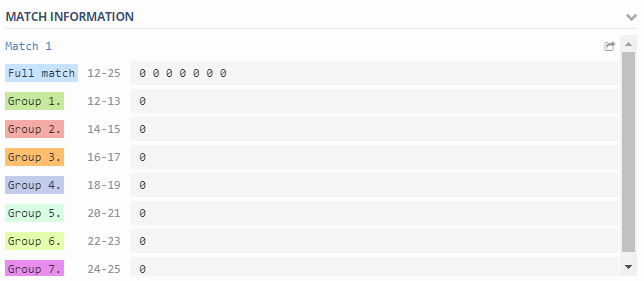
Where:
\1 - Total number of operations per second on {#VOLUME_NAME}- the total number of operations per second;\2 - Read operations per second on {#VOLUME_NAME}- read operations per second;\3 - Write operations per second on {#VOLUME_NAME}- write operations per second;\4 - Other operations per second on {#VOLUME_NAME}- other operations per second (I don't know what it is, but for some reason I shoot);\5 - Read throughput in bytes per second on {#VOLUME_NAME}- reading speed in bytes per second;\6 - Write throughput in bytes per second on {#VOLUME_NAME}- writing speed in bytes per second;\7 - Average latency for an operation in microseconds on {#VOLUME_NAME}- average latency of operations in microseconds.
Alerting
The set of triggers is standard, place and inodes:
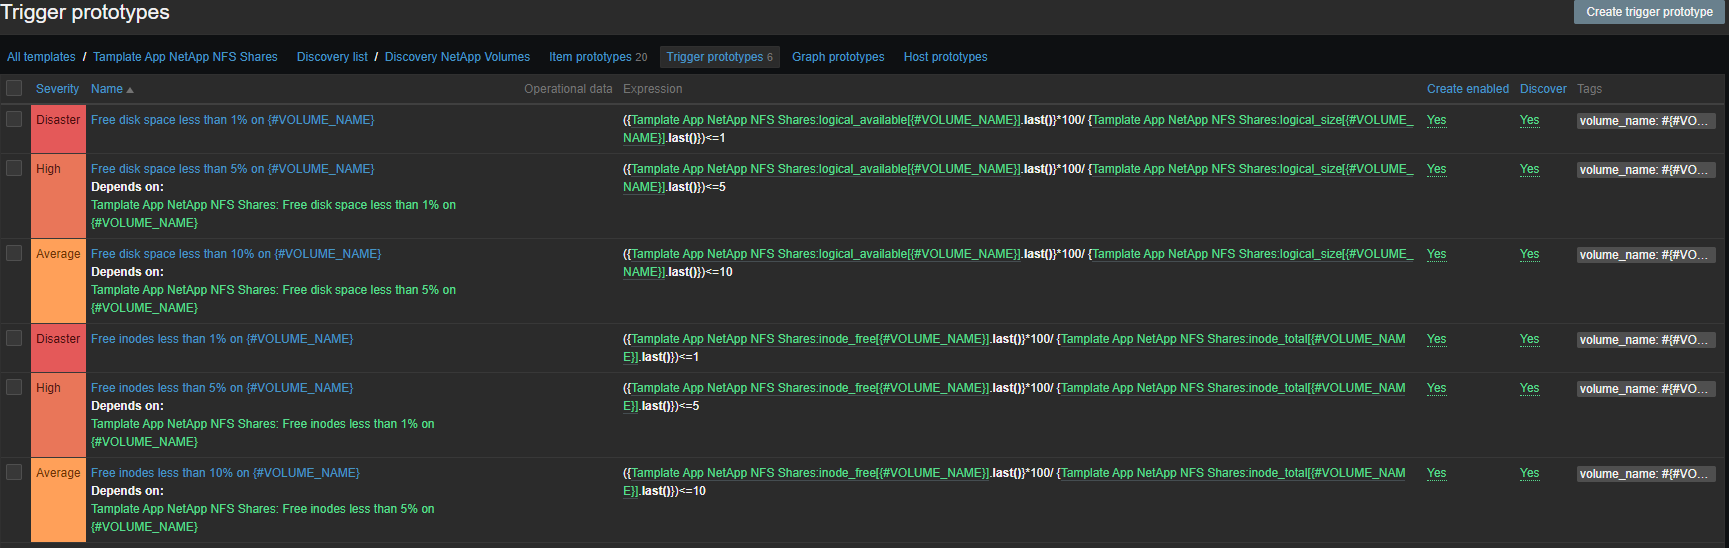
- Free disk space less than 1% on {#VOLUME_NAME}
- Free disk space less than 5% on {#VOLUME_NAME}
- Free disk space less than 10% on {#VOLUME_NAME}
- Free inodes less than 1% on {#VOLUME_NAME}
- Free inodes less than 5% on {#VOLUME_NAME}
- Free inodes less than 10% on {#VOLUME_NAME}
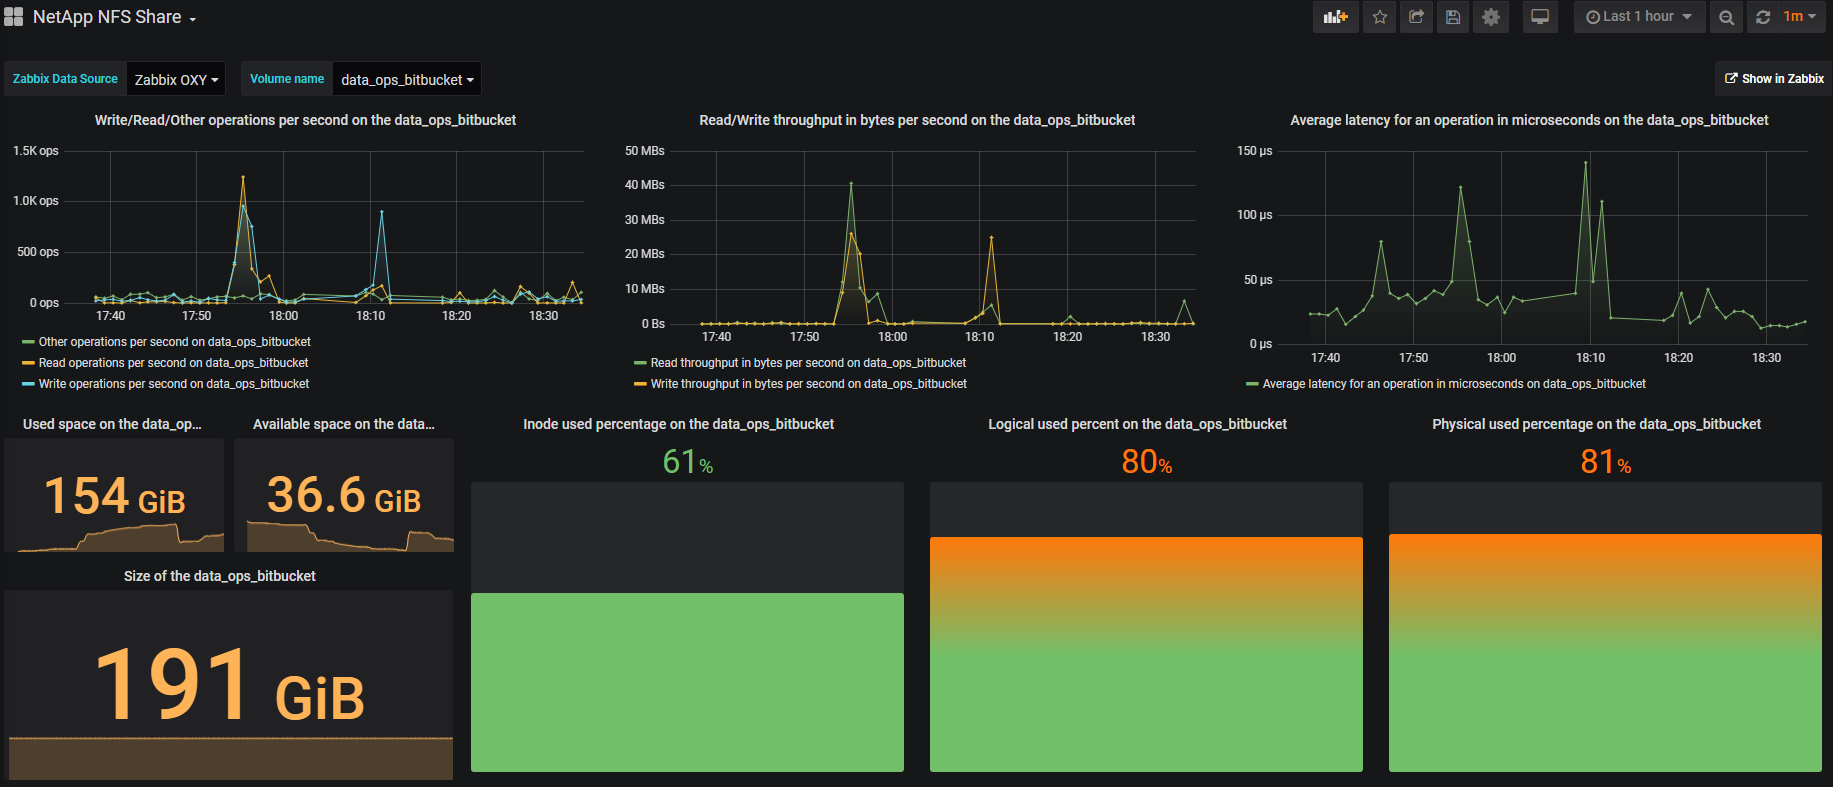
Visualization
Visualization is mainly done on Grafana , it is beautiful and convenient. For example, one volume looks something like this: In the upper right corner there is a Show in Zabbix button , with which you can fall into Zabbix and see all the metrics for the selected volume.
Outcome
- Automatic setting of volumes for monitoring.
- Automatic removal of volumes from monitoring, if the volume is removed from NetApp.
- We got rid of binding to one server and manually mounting volumes.
- Added performance metrics for each volume. Now we are less likely to pull the datacenter support for the sake of charts from NetApp.
Soon they promise to update ONTAP and bring in an extended API, the template will move to an HTTP agent .
Template, script and dashboard
github.com/domclick/netapp-volume-monitoring
useful links
docs.netapp.com/ontap-9/index.jsp
www.zabbix.com/documentation/current