Foreword
All the examples that will be presented in the article can be found in this notebook , the main material will be hidden under the spoilers due to the fact that there is a lot of code and gifs. To reproduce some of the examples that will be presented in any case, you will need this repository due to the fact that it contains some intermediate utilities.
How to animate
Under Jupyter there is a set of widgets ( ipywidgets ), which are various kinds of management tools, interacting with the IPython.display module to provide interactive visualization. The following code represents all of the key widget interaction that can be used to animate interactively on the contents of a list:
from ipywidgets import interact, interactive, fixed, interact_manual
import ipywidgets as widgets
from IPython.display import display


def step_slice(lst, step):
    return lst[step]


def animate_list(lst, play=False, interval=200):
    slider = widgets.IntSlider(min=0, max=len(lst) - 1, step=1, value=0)
    if play:
        play_widjet = widgets.Play(interval=interval)
        widgets.jslink((play_widjet, 'value'), (slider, 'value'))
        display(play_widjet)
        # slider = widgets.Box([play_widject, slider])
    return interact(step_slice,
                    lst=fixed(lst),
                    step=slider)
Here's what you get if you feed the animate_list function a list of integers:
a = [10, 9, 8, 7, 6, 5, 4, 3, 2, 1]
animate_list(a, play=True, interval=200);
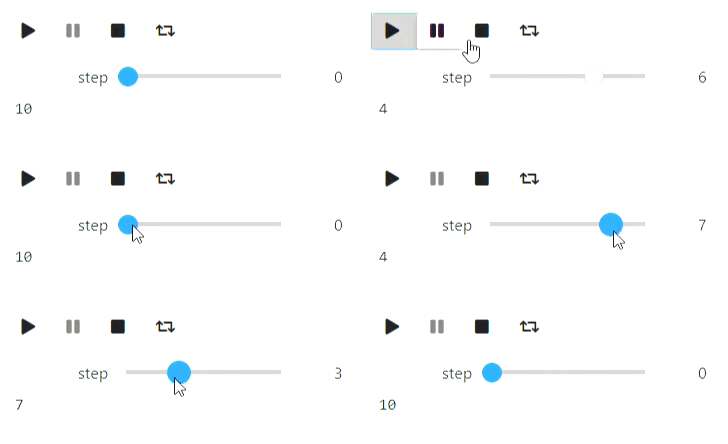
To demonstrate how an algorithm works using animate_list, you need to generate intermediate states of the algorithm and save their visual representation in the desired format.
Text animations
Basic algorithms for working with sequences / arrays are enough textual representation. I unfortunately had problems with basic strings that refused to handle line feeds, as a result I used IPython.display.Code. Let's start with the classic quicksort.
The code
from IPython.display import Code
import random

def qsort_state(array, left, right, x, p, q):
    extended_array = list(map(str, array[:left])) + ['['] + list(map(str, array[left: right])) + [']'] + list(map(str, array[right:]))
    offset_x = sum(list(map(len, extended_array[:left]))) + left + 2
    zero_line = ''.join([' ' for i in range(offset_x)]) + f'x = {x}'
    first_line = ' '.join(extended_array)
    offset_p = sum(list(map(len, extended_array[:p + 1]))) + p + 1 + len(extended_array[p + 1]) // 2
    offset_q = sum(list(map(len, extended_array[:q + 1]))) + q + 1 + len(extended_array[q + 1]) // 2
    second_line = ''.join([' ' if i != offset_p and i != offset_q else '↑' for i in range(len(first_line))])

    return Code(zero_line + '\n' + first_line + '\n' + second_line)

def qsort(array, left, right, states):
    if right - left <= 1:
        return
    x = array[random.randint(left, right - 1)]
    p = left
    q = right - 1
    states.append(qsort_state(array, left, right, x, p, q))
    while p <= q:
        while array[p] < x:
            p += 1
            states.append(qsort_state(array, left, right, x, p, q))
        while array[q] > x:
            q -= 1
            states.append(qsort_state(array, left, right, x, p, q))
        if p <= q:
            array[p], array[q] = (array[q], array[p])
            states.append(qsort_state(array, left, right, x, p, q))
            p += 1
            q -= 1
            if p <= q:
                states.append(qsort_state(array, left, right, x, p, q))
    qsort(array, left, q + 1, states)
    qsort(array, p, right, states)
a = [234, 1, 42, 3, 15, 3, 10, 9, 2]
states = []
qsort(a, 0, len(a), states)
animate_list(states, play=True);
Result
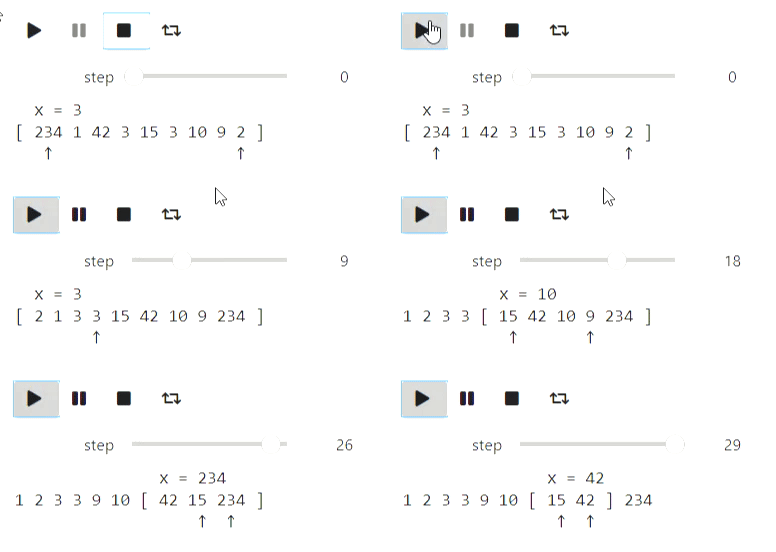

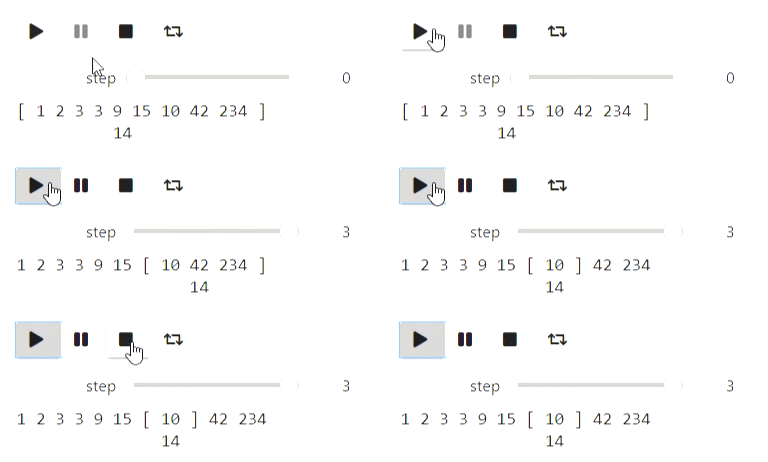
Binary search can be visualized in a similar way.
The code
def bs_state(array, left, right, x):
    extended_array = list(map(str, array[:left])) + ['['] + list(map(str, array[left: right])) + [']'] + list(map(str, array[right:]))
    mid = (left + right) // 2
    offset_x = sum(list(map(len, extended_array[:mid + 1]))) + mid + 1
    return Code(' '.join(extended_array) + '\n' + ''.join([' ' for i in range(offset_x)]) + str(x))

#       ,
#
states = []
left = 0
right = len(a)
x = 14
while right - left > 1:
    states.append(bs_state(a, left, right, x))
    mid = (left + right) // 2
    if a[mid] <= x:
        left = mid
    else:
        right = mid
states.append(bs_state(a, left, right, x))

animate_list(states, play=True, interval=400);
Result

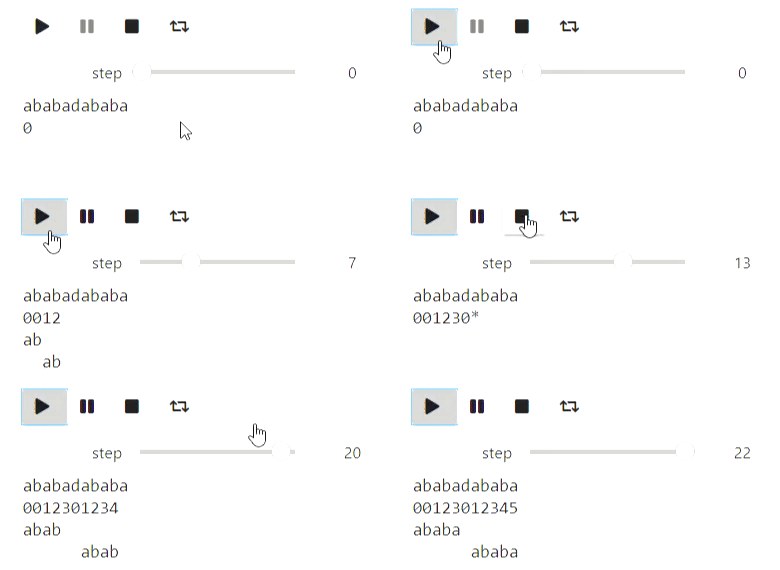
Here's an example for strings: the process of building a prefix function:
The code
def prefix_function_state(s, p, k, intermidiate=False):
    third_string = ''.join([s[i] if i < k else ' ' for i in range(len(p))])
    fourth_string = ''.join([s[i] if i >= len(p) - k else ' ' for i in range(len(p))])
    return Code(s + '\n' + ''.join(list(map(str, (p + ['*'] if intermidiate else p )))) \
                  + '\n' + third_string + '\n' + fourth_string)

def prefix_function(s, states):
    p = [0]
    k = 0
    states.append(prefix_function_state(s, p, k))
    for letter in s[1:]:
        states.append(prefix_function_state(s, p, k, True))
        while k > 0 and s[k] != letter:
            k = p[k - 1]
            states.append(prefix_function_state(s, p, k, True))
        if s[k] == letter:
            k += 1
        p.append(k)
        states.append(prefix_function_state(s, p, k))
    return p

states = []
p = prefix_function('ababadababa', states)
animate_list(states, play=True);
Result

Visualization using Matplotlib
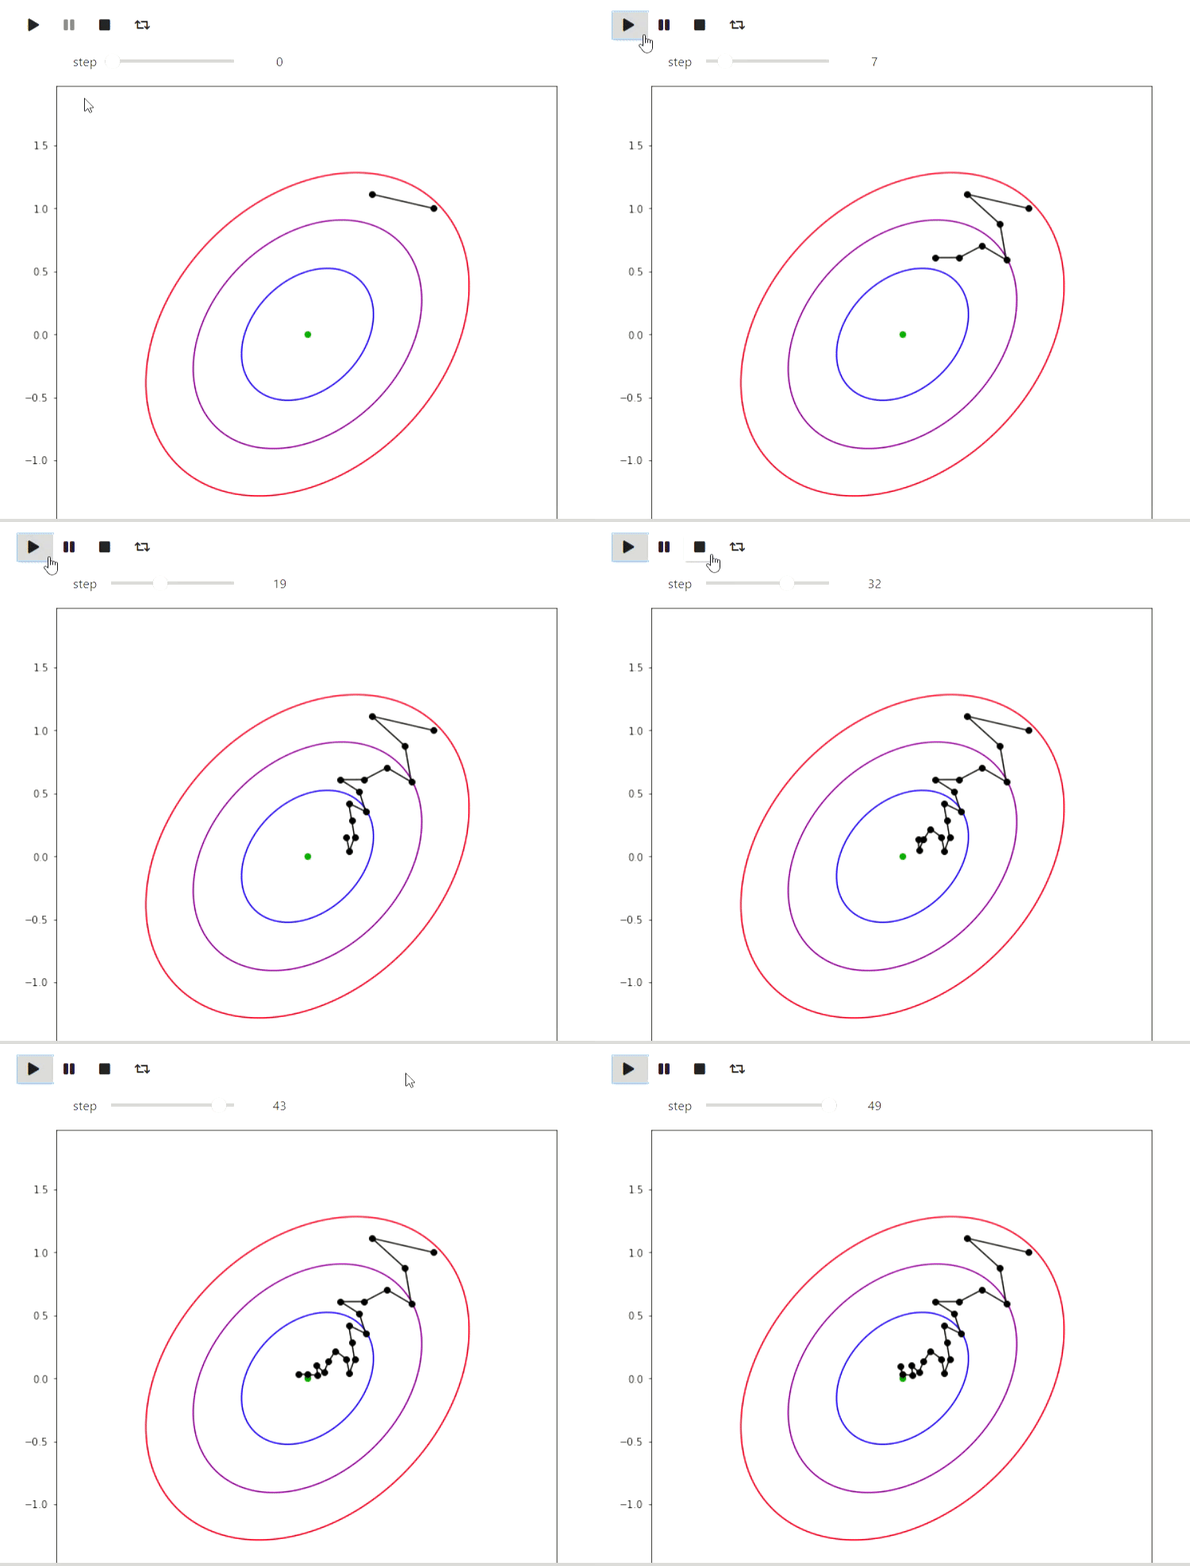
Matplotlib is a Python library for drawing various graphs. Here are some examples of how you can use it to visualize algorithms. Let's start with an example of iterative algorithms for finding the minimum of a function, the simplest of which is the random local search method, which makes a local change in the current approximation and goes into it if the value of the function value at the new point turns out to be better:
The code
import numpy as np
import matplotlib.pyplot as plt

# ,  ,    (0, 0)
def f(x, y):
    return 1.3 * (x - y) ** 2 + 0.7 * (x + y) ** 2

#
def plot_trajectory(func, traj, limit_point=None):
    fig = plt.figure(figsize=(7, 7))
    ax = fig.add_axes([0, 0, 1, 1])

    if limit_point:
        ax.plot([limit_point[0]], [limit_point[1]], 'o', color='green')
    #Level contours
    delta = 0.025
    x = np.arange(-2, 2, delta)
    y = np.arange(-2, 2, delta)
    X, Y = np.meshgrid(x, y)
    Z = np.zeros_like(X)
    for i in range(X.shape[0]):
        for j in range(X.shape[1]):
            Z[i][j] = func(X[i][j], Y[i][j])
    CS = ax.contour(X, Y, Z, [0.5, 1.5, 3], colors=['blue', 'purple', 'red'])
    ax.plot([u[0] for u in traj], [u[1] for u in traj], color='black')
    ax.plot([u[0] for u in traj], [u[1] for u in traj], 'o', color='black')

    plt.close(fig)
    return fig

x, y = (1.0, 1.0)
num_iters = 50
trajectory = [(x, y)]
plots = []
#
for i in range(num_iters):
    angle = 2 * np.pi * np.random.rand(1)
    dx, dy = (np.cos(angle) / 2 / (i + 1) ** 0.5, np.sin(angle) / 2 / (i + 1) ** 0.5)
    trajectory.append((x + dx, y + dy))
    plots.append(plot_trajectory(f, trajectory, limit_point=(0, 0)))
    if f(x, y) > f(x + dx, y + dy):
        x = x + dx
        y = y + dy
    else:
        trajectory = trajectory[:-1]

animate_list(plots, play=True, interval=300);
Result

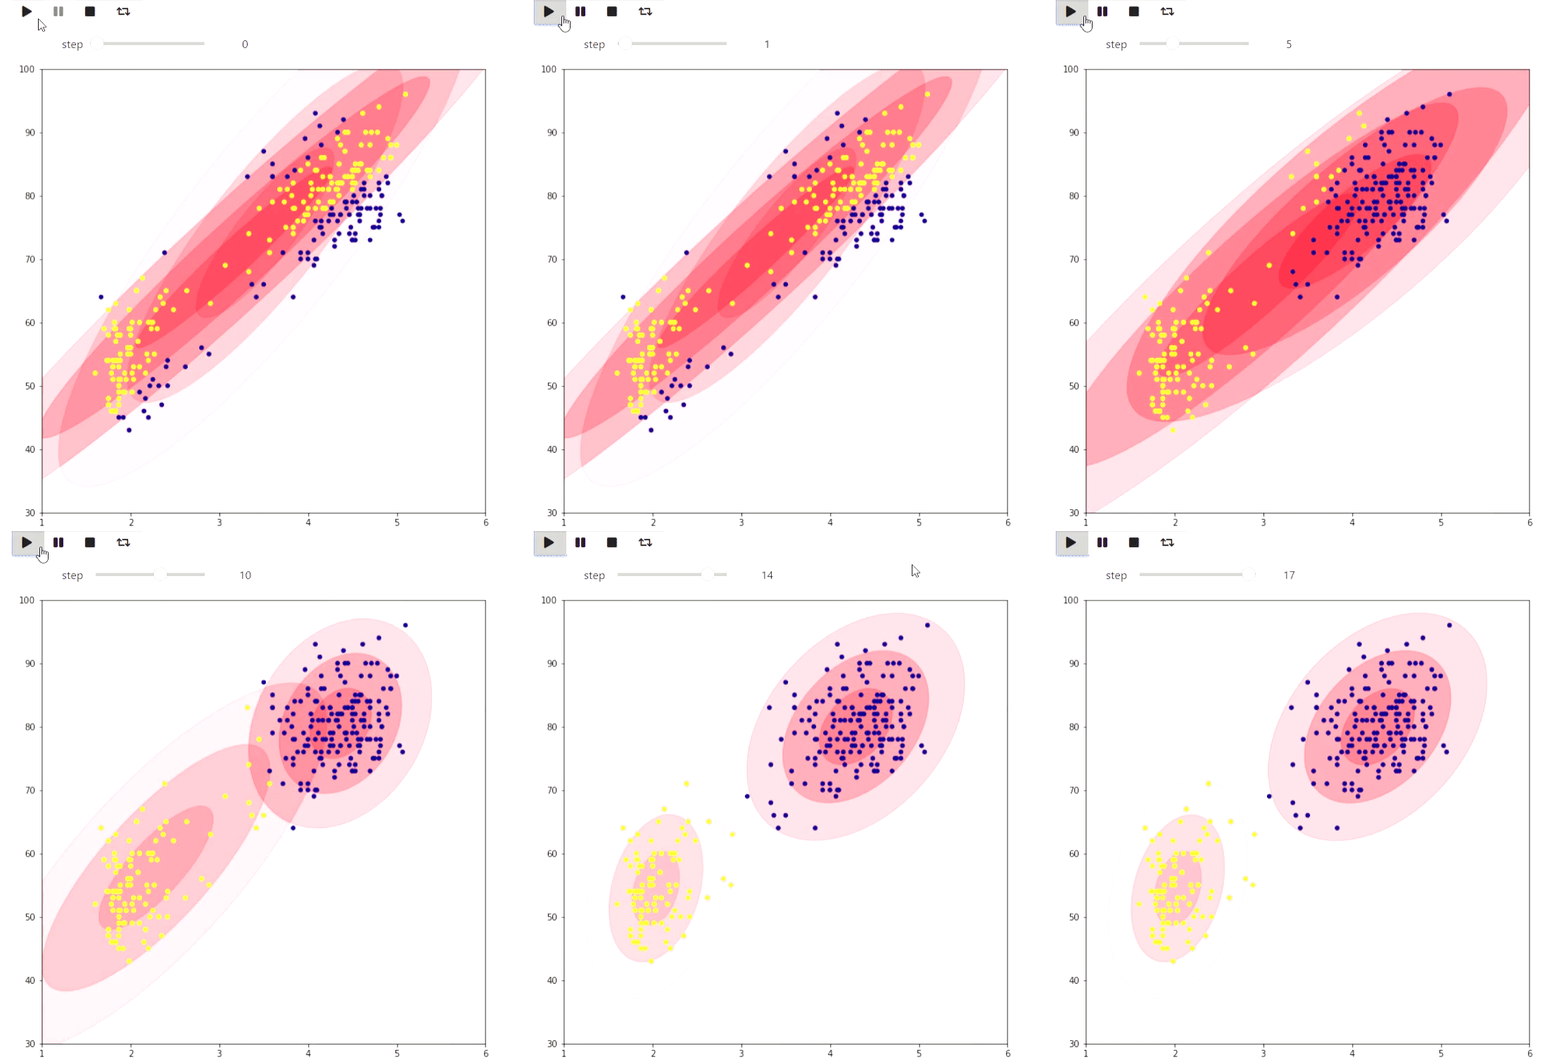
And here is an example of the EM algorithm for data from the eruptions of an Old Faithful geyser, the same example is given on Wikipedia :
The code
#
# http://www.stat.cmu.edu/~larry/all-of-statistics/=data/faithful.dat
data = []
with open('data/faithful.csv') as f:
    for line in f:
        _, x, y = line.split(',')
        try:
            data.append((float(x), float(y)))
        except ValueError:
            pass

colors = ['red', 'blue', 'yellow', 'green']

#    https://jakevdp.github.io/PythonDataScienceHandbook/05.12-gaussian-mixtures.html
from matplotlib.patches import Ellipse

def draw_ellipse(position, covariance, ax=None, **kwargs):
    """Draw an ellipse with a given position and covariance"""
    ax = ax or plt.gca()

    # Convert covariance to principal axes
    if covariance.shape == (2, 2):
        U, s, Vt = np.linalg.svd(covariance)
        angle = np.degrees(np.arctan2(U[1, 0], U[0, 0]))
        width, height = 2 * np.sqrt(s)
    else:
        angle = 0
        width, height = 2 * np.sqrt(covariance)

    # Draw the Ellipse
    for nsig in range(1, 4):
        ax.add_patch(Ellipse(position, nsig * width, nsig * height,
                             angle, color='red', **kwargs))

def plot_gmm(gmm, X, label=True, ax=None):
    ax = ax or plt.gca()
    if label:
        labels = gmm.predict(X)
        ax.scatter(X[:, 0], X[:, 1], c=labels, s=20, cmap='plasma', zorder=2)
    else:
        ax.scatter(X[:, 0], X[:, 1], s=20, zorder=2)

    w_factor = 0.2 / gmm.weights_.max()
    for pos, covar, w in zip(gmm.means_, gmm.covariances_, gmm.weights_):
        draw_ellipse(pos, covar, alpha=w * w_factor)

def step_figure(gmm, X, label=True):
    fig = plt.figure(figsize=(7, 7))
    ax = fig.add_axes([0, 0, 1, 1])
    ax.set_ylim(30, 100)
    ax.set_xlim(1, 6)
    plot_gmm(gmm, X, label=True, ax=ax)
    plt.close(fig)
    return fig

from sklearn.mixture import GaussianMixture

x = np.array(data)
# max_iters=1  warm_start=True  gmm.fit
#
gmm = GaussianMixture(2, warm_start=True, init_params='random', max_iter=1)
# GMM    ,
import warnings
warnings.simplefilter('ignore')
#
gmm.fit(x[:10,:])
steps = [step_figure(gmm, x)]
for i in range(17):
    gmm.fit(x)
    steps.append(step_figure(gmm, x))

animate_list(steps, play=True, interval=400);
Result

The following example is more of a toy, but also shows what can be done in matplotlib: visualizing the tiling of a checkered figure on a plane with the maximum number of dominoes by finding the maximum matching:
The code
#   matplotlib   ,
from animation_utils.matplotlib import draw_filling

def check_valid(i, j, n, m, tiling):
    return 0 <= i and i < n and 0 <= j and j < m and tiling[i][j] != '#'

def find_augmenting_path(x, y, n, m, visited, matched, tiling):
    if not check_valid(x, y, n, m, tiling):
        return False
    if (x, y) in visited:
        return False
    visited.add((x, y))

    for dx, dy in [(-1, 0), (1, 0), (0, -1), (0, 1)]:
        if not check_valid(x + dx, y + dy, n, m, tiling):
            continue
        if (x + dx, y + dy) not in matched or find_augmenting_path(*matched[(x + dx , y + dy)], n, m, visited, matched, tiling):
            matched[(x + dx, y + dy)] = (x, y)
            return True
    return False

def convert_match(matched, tiling, n, m):
    result = [[-1 if tiling[i][j] == '#' else -2 for j in range(m)] for i in range(n)]
    num = 0
    for x, y in matched:
        _x, _y = matched[(x, y)]
        result[x][y] = num
        result[_x][_y] = num
        num += 1
    return result

def match_with_flow(tiling):
    result_slices = []
    n = len(tiling)
    m = len(tiling[0])

    matched = dict()
    #
    rows = list(range(n))
    columns = list(range(m))
    random.shuffle(rows)
    random.shuffle(columns)
    result_slices.append(convert_match(matched, tiling, n, m))

    for i in rows:
        for j in columns:
            if (i + j) % 2 == 1:
                continue
            visited = set()
            if find_augmenting_path(i, j, n, m, visited, matched, tiling):
                result_slices.append(convert_match(matched, tiling, n, m))

    return result_slices

tiling_custom=[
    '...####',
    '....###',
    '......#',
    '#.#....',
    '#......',
    '##.....',
    '###...#',
]
sequencial_match = match_with_flow(tiling_custom)
animate_list(list(map(draw_filling, sequencial_match)), play=True);
Result
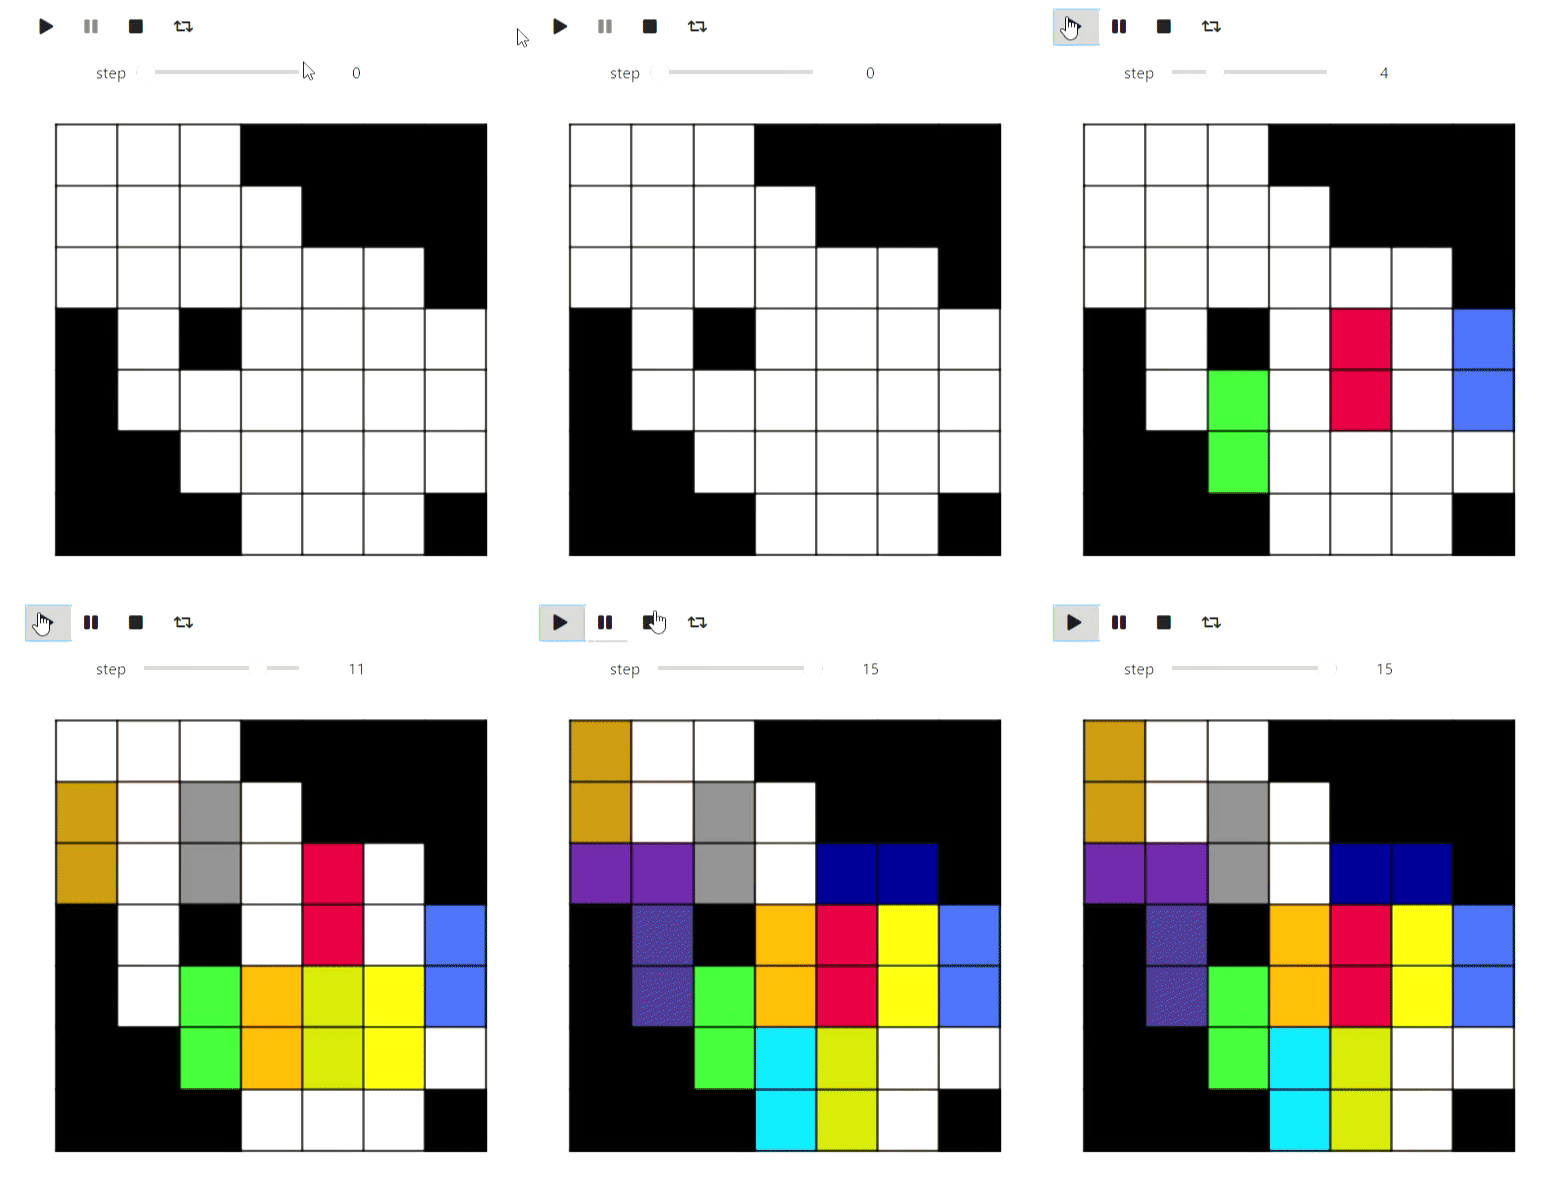

Well, along the way, a demonstration of the algorithm for coloring a planar graph in 5 colors, so that the partition looks better visually:
The code
def color_5(filling):
    result = [[i for i in row] for row in filling]
    #
    domino_tiles = [[] for i in range(max(map(max, filling)) + 1)]
    domino_neighbours = [set() for i in range(max(map(max, filling)) + 1)]
    degree = [0 for i in range(max(map(max, filling)) + 1)]

    n = len(filling)
    m = len(filling[0])

    for i, row in enumerate(filling):
        for j, num in enumerate(row):
            if num >= 0:
                domino_tiles[num].append((i, j))

    for i, tiles in enumerate(domino_tiles):
        for x, y in tiles:
            for dx, dy in [(-1, 0), (1, 0), (0, -1), (0, 1), (-1, -1), (-1, 1), (1, -1), (1, 1)]:
                a, b = x + dx, y + dy
                if 0 <= a and a < n and 0 <= b and b < m and filling[a][b] >= 0 and filling[a][b] != i \
                        and filling[a][b] not in domino_neighbours[i]:
                    domino_neighbours[i].add(filling[a][b])
                    degree[i] += 1

    #       ,      5
    # .     ,   ,
    #           ,
    active_degrees = [set() for i in range(max(degree) + 1)]
    for i, deg in enumerate(degree):
        active_degrees[deg].add(i)

    reversed_order = []

    for step in range(len(domino_tiles)):
        min_degree = min([i for i, dominoes in enumerate(active_degrees) if len(dominoes) > 0])
        domino = active_degrees[min_degree].pop()

        reversed_order.append(domino)
        for other in domino_neighbours[domino]:
            if other in active_degrees[degree[other]]:
                active_degrees[degree[other]].remove(other)
                degree[other] -= 1
                active_degrees[degree[other]].add(other)

    #             ,
    #     5 ,      ,
    #    .
    colors = [-1 for domino in domino_tiles]
    slices = [draw_filling(result)]
    for domino in reversed(reversed_order):
        used_colors = [colors[other] for other in domino_neighbours[domino] if colors[other] != -1]

        domino_color = len(used_colors)
        for i, color in enumerate(sorted(set(used_colors))):
            if i != color:
                domino_color = i
                break

        if domino_color < 5:
            colors[domino] = domino_color
            for x, y in domino_tiles[domino]:
                result[x][y] = domino_color

            slices.append(draw_filling(result))
            continue

        #      ,
        c = 0
        other = [other for other in domino_neighbours[domino] if colors[other] == c]
        visited = set([other])
        q = Queue()
        q.put(other)
        domino_was_reached = False
        while not q.empty():
            cur = q.get()
            for other in domino_neighbours[cur]:
                if other == domino:
                    domino_was_reached = True
                    break
                if color[other] == c or color[other] == c + 1 and other not in visited:
                    visited.add(other)
                    q.put(other)

        if not domino_was_reached:
            for other in visited:
                color[other] = color[other] ^ 1
                for x, y in domino_tiles[other]:
                    result[x][y] = color[other]
            color[domino] = c
            for x, y in domino_tiles[domino]:
                result[x][y] = c

            slices.append(draw_filling(result))
            continue

        #     2  3.
        c = 2
        other = [other for other in domino_neighbours[domino] if colors[other] == c]
        visited = set([other])
        q = Queue()
        q.put(other)
        domino_was_reached = False
        while not q.empty():
            cur = q.get()
            for other in domino_neighbours[cur]:
                if other == domino:
                    domino_was_reached = True
                    break
                if color[other] == c or color[other] == c + 1 and other not in visited:
                    visited.add(other)
                    q.put(other)
        for other in visited:
            color[other] = color[other] ^ 1
            for x, y in domino_tiles[other]:
                result[x][y] = color[other]
        color[domino] = c
        for x, y in domino_tiles[domino]:
            result[x][y] = c
        slices.append(draw_filling(result))

    return result, slices

filling_colored, slices =color_5(sequencial_match[-1])
animate_list(slices, play=True);
Result
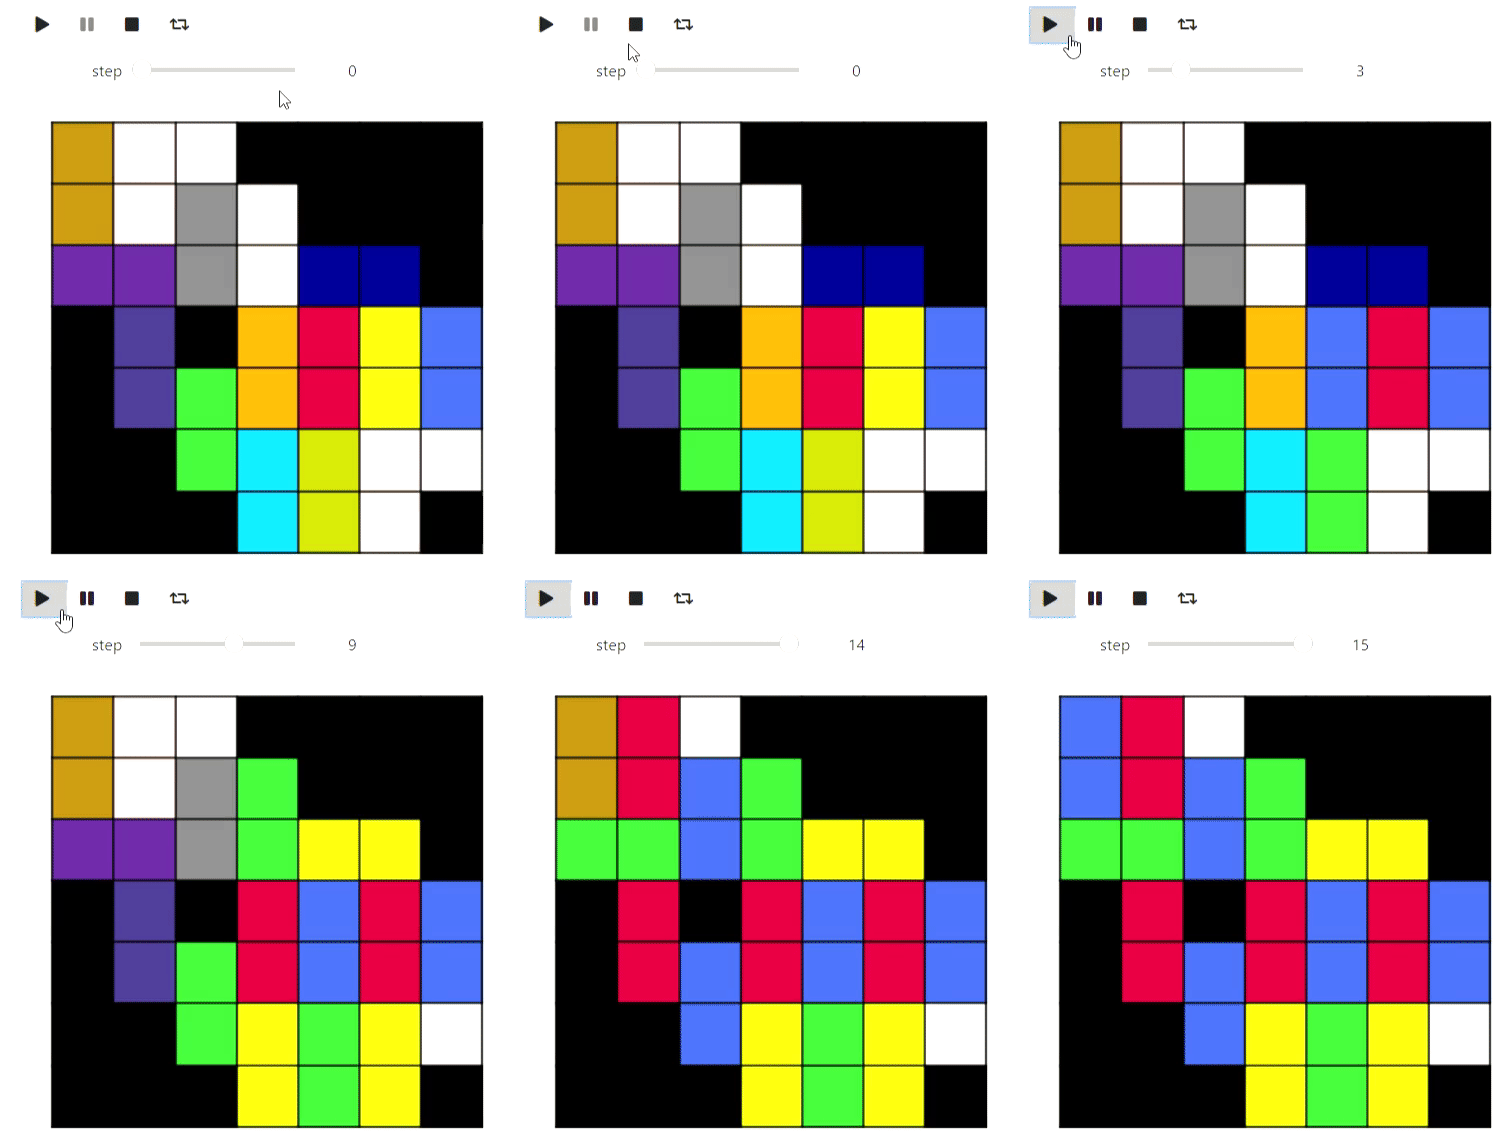

The last example with matplotlib from computational geometry is the Graham-Andrew algorithm for plotting a convex hull on a plane:
The code
def convex_hull_state(points, lower_path, upper_path):
    fig = plt.figure(figsize=(6, 6))
    ax = fig.add_axes([0, 0, 1, 1])

    ax.get_xaxis().set_visible(False)
    ax.get_yaxis().set_visible(False)

    for name, spine in ax.spines.items():
        spine.set_visible(False)
        spine.set_visible(False)

    ax.scatter([x for x, y in points], [y for x, y in points])
    ax.plot([x for x, _ in lower_path], [y for _, y in lower_path], color='red')
    ax.plot([x for x, _ in upper_path], [y for _, y in upper_path], color='blue')

    plt.close(fig)
    return fig

def vector_prod(point_a, point_b):
    return point_a[0] *  point_b[1] - point_a[1] * point_b[0]

def convex_hull(poitns):
    sorted_points = sorted(points, key=lambda x: x[1])
    sorted_points = sorted(sorted_points, key=lambda x: x[0])
    states = []

    upper_path = [sorted_points[0]]
    lower_path = [sorted_points[0]]
    states.append(convex_hull_state(points, lower_path, upper_path))

    for point in sorted_points[1:]:
        while len(upper_path) > 1 and vector_prod(point - upper_path[-1], upper_path[-1] - upper_path[-2]) > 0:
            upper_path = upper_path[:-1]
            upper_path.append(point)
            states.append(convex_hull_state(poitns, lower_path, upper_path))
            upper_path = upper_path[:-1]
        upper_path.append(point)
        states.append(convex_hull_state(points, lower_path, upper_path))

    for point in sorted_points[1:]:
        while len(lower_path) > 1 and vector_prod(point - lower_path[-1], lower_path[-1] - lower_path[-2]) < 0:
            lower_path = lower_path[:-1]
            lower_path.append(point)
            states.append(convex_hull_state(poitns, lower_path, upper_path))
            lower_path = lower_path[:-1]
        lower_path.append(point)
        states.append(convex_hull_state(poitns, lower_path, upper_path))

    return states

points = [np.random.rand(2) for i in range(20)]
states = convex_hull(points)
animate_list(states, play=True, interval=300);
Result
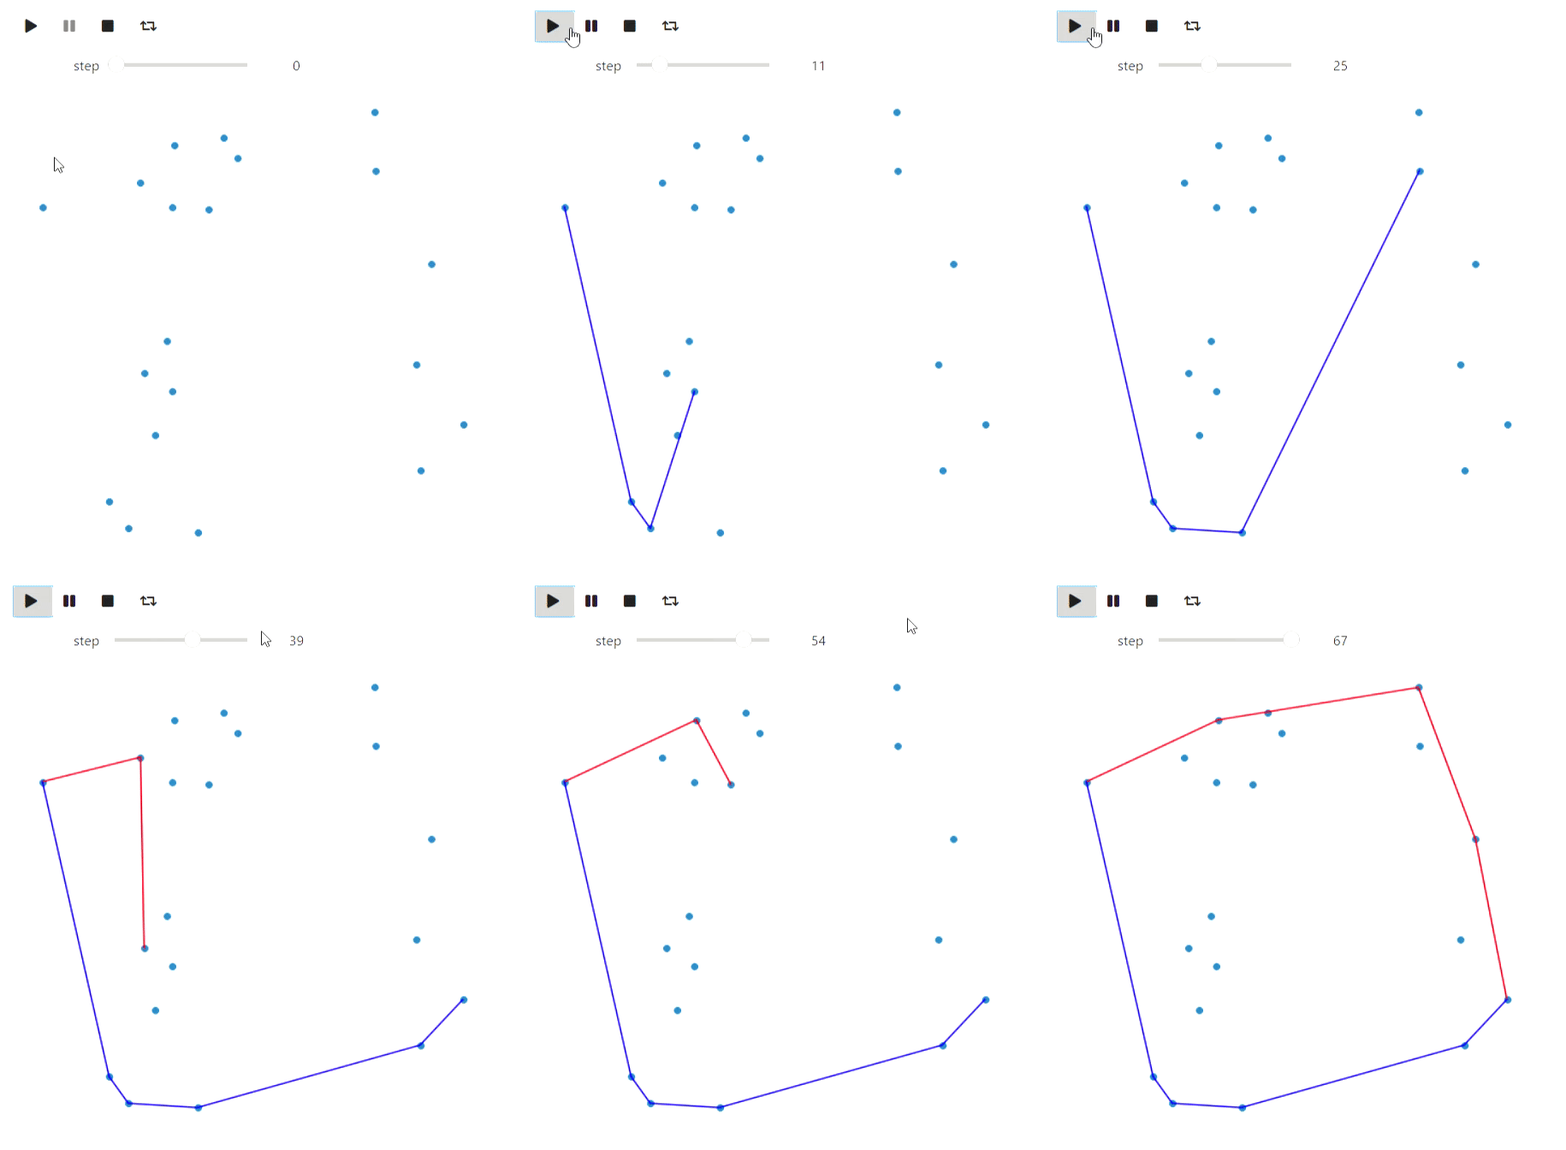

The last thing I would like to note in the context of matplotlib is an alternative way to create animations through matplotlib.animation.FuncAnimation. This method has its advantages: it can be converted to html using IPython.display.HTML, the result will be more reliable than on widgets (my widgets are periodically slowed down), it will not require a Jupyter working core, but in this case the animation is normal video and controls are limited to the player.
Graphviz
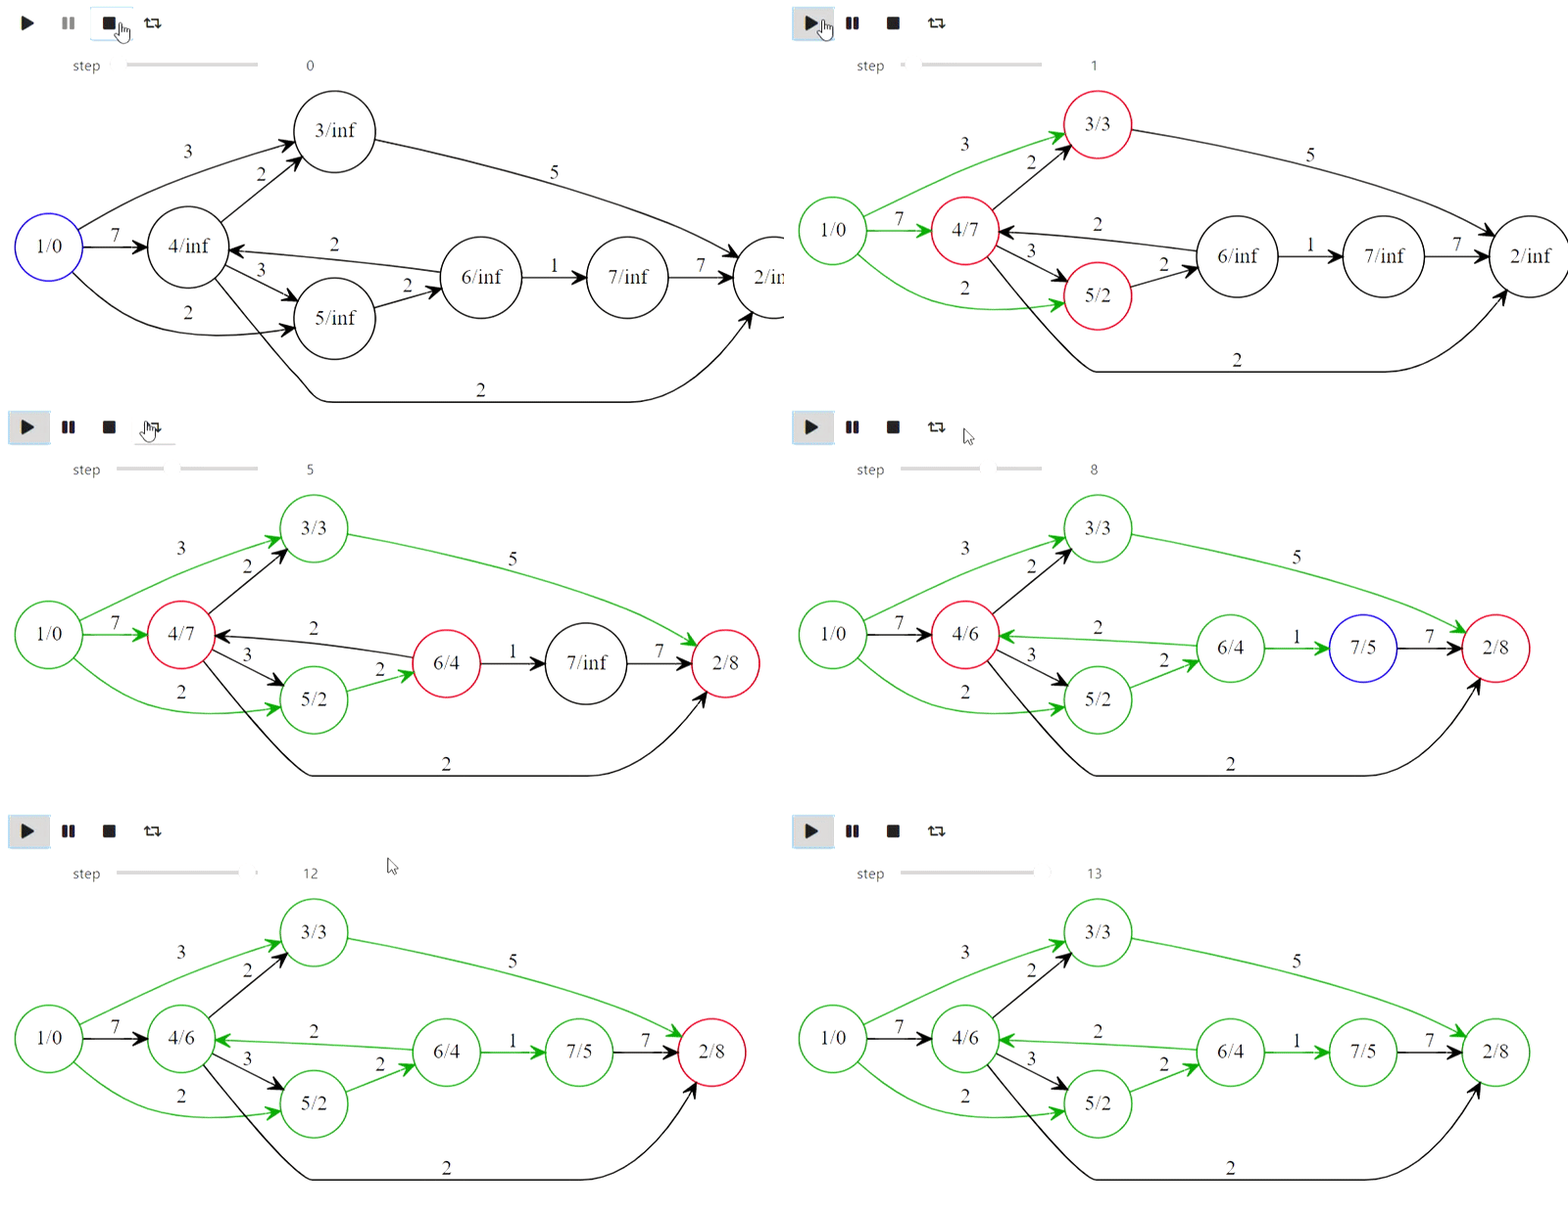
Graphviz can be used to draw graphs. Please note that in order to reproduce examples using it, you will need to install graphviz not only in python, but also on the system . Let's start with a depth-first traversal:
The code
#
from graph_utils.graph import Graph, Arc, Node

def enter_node(node):
    node.SetColor('blue')

def enter_arc(node, arc):
    node.SetColor('green')
    arc.attributes['style'] = 'dashed'
    arc.attributes['color'] = 'green'

def return_from_arc(node, arc):
    arc.attributes['style'] = 'solid'
    arc.attributes['color'] = 'red'
    node.SetColor('blue')

def ignore_arc(arc):
    arc.attributes['color'] = 'blue'

def leave_node(node):
    node.SetColor('red')

def dfs(graph, node_id, visited, outlist, path):
    visited.add(node_id)
    path.append(node_id)
    enter_node(graph.nodes[node_id])
    outlist.append(graph.Visualize())
    for arc in graph.nodes[node_id].arcs:
        if arc.end not in visited:
            enter_arc(graph.nodes[node_id], arc)
            dfs(graph, arc.end, visited, outlist, path)
            return_from_arc(graph.nodes[node_id], arc)
            path.append(node_id)
        else:
            ignore_arc(arc)
        outlist.append(graph.Visualize())
    leave_node(graph.nodes[node_id])

arcs = [
    Arc(1, 3, 3),
    Arc(1, 4, 7),
    Arc(4, 3, 2),
    Arc(4, 5, 3),
    Arc(1, 5, 2),
    Arc(6, 4, 2),
    Arc(5, 6, 2),
    Arc(6, 7, 1),
    Arc(7, 2, 7),
    Arc(4, 2, 2),
    Arc(3, 2, 5)
]

#     ,      `dot`,
#      graphviz
# https://graphviz.org/download/
graph = Graph(arcs)
visited = set()
dfs_outlist = []
path = []
dfs_outlist.append(graph.Visualize())
dfs(graph, 1, visited, dfs_outlist, path)
dfs_outlist.append(graph.Visualize())
animate_list(dfs_outlist, play=True, interval=400);
Result
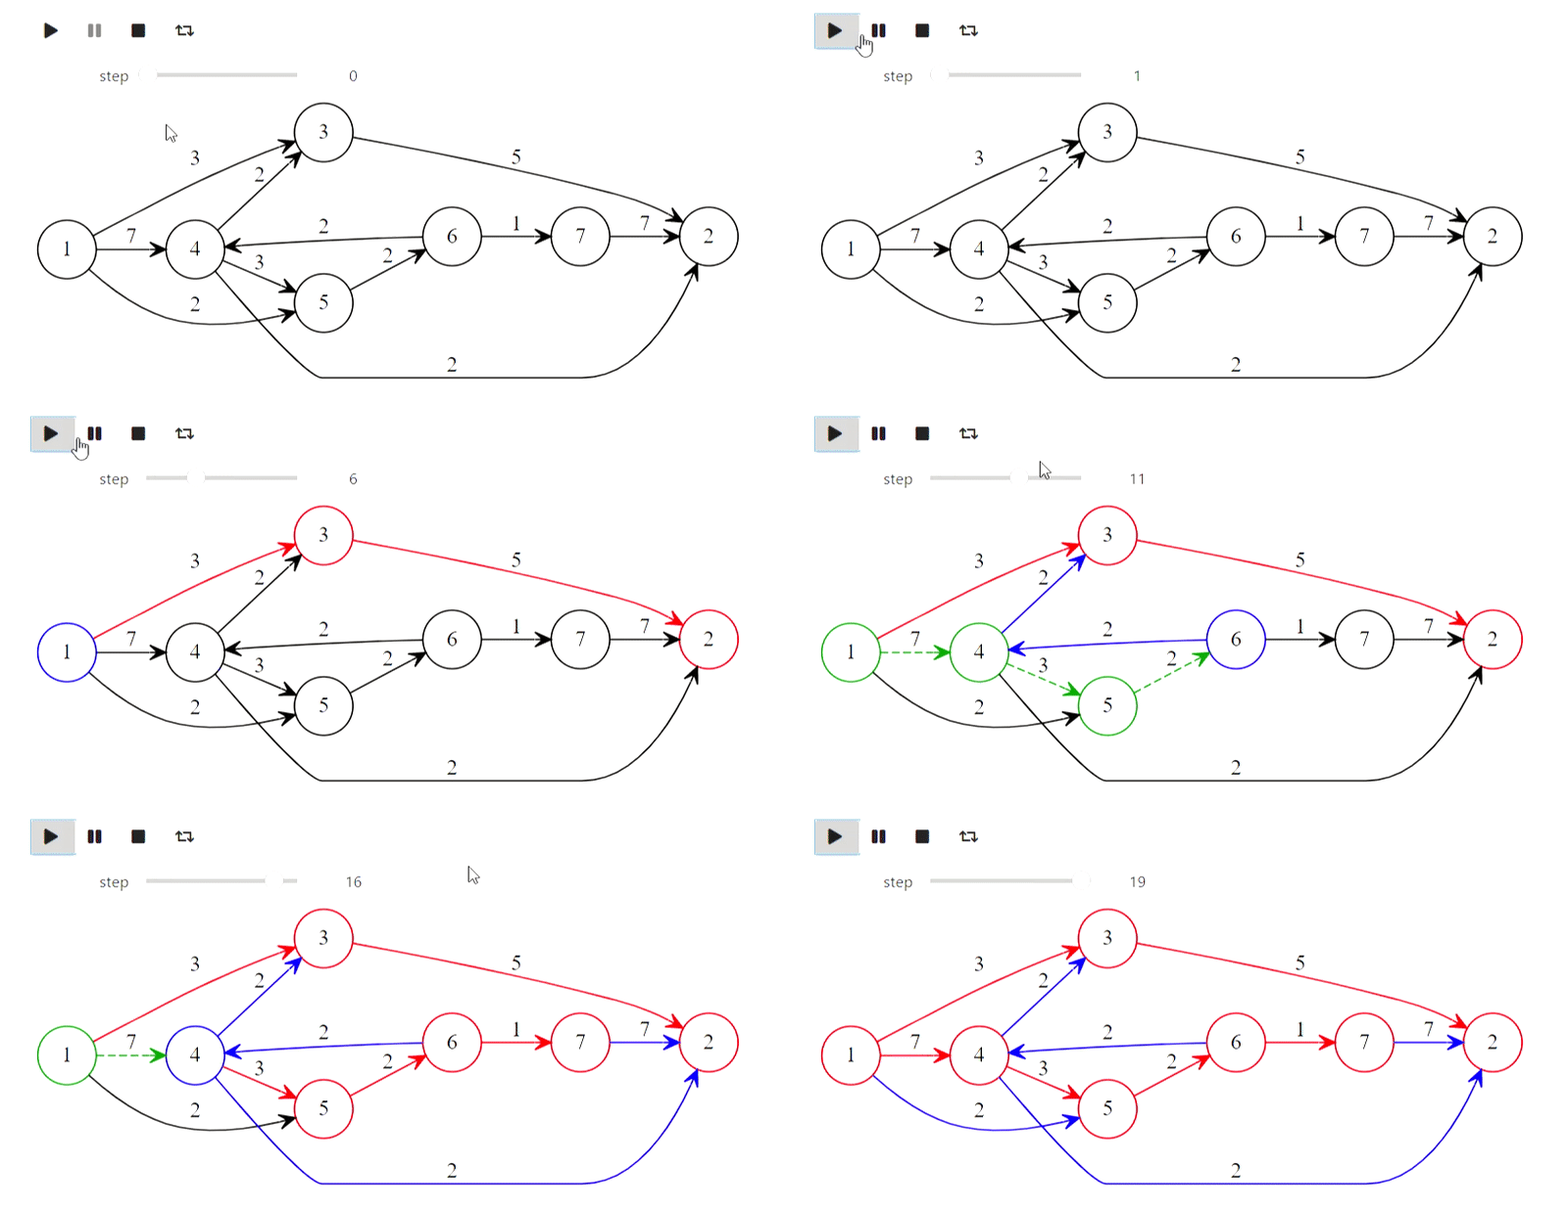

Well, here is Dijkstra's algorithm from the title
The code
def mark_labelled(node):
    node.SetColor('red')

def mark_scanned(node):
    node.SetColor('green')

def process_node(node):
    node.SetColor('blue')

def set_previous(arc):
    arc.SetColor('green')

def unset_previous(arc):
    arc.SetColor('black')

def scan_arc(graph, arc, l, p, mark):
    if l[arc.end] > l[arc.beginning] + arc.weight:
        l[arc.end] = l[arc.beginning] + arc.weight
        if p[arc.end] is not None:
            unset_previous(p[arc.end])
        #  arc,   arc.beginning,
        p[arc.end] = arc
        set_previous(p[arc.end])
        mark[arc.end] = True
        mark_labelled(graph.nodes[arc.end])

def scan_node(graph, node_id, l, p, mark):
    for arc in graph.nodes[node_id].arcs:
        scan_arc(graph, arc, l, p, mark)
    mark[node_id] = False
    mark_scanned(graph.nodes[node_id])


#      ,
#  ,
# http://forskning.diku.dk/PATH05/GoldbergSlides.pdf
def base_scanning_method(graph, s, choice_function):
    l    = {key: float('Inf') for key in graph.nodes.keys()}
    p    = {key: None for key in graph.nodes.keys()}
    mark = {key: False for key in graph.nodes.keys()}

    l[s] = 0
    mark[s] = True
    mark_labelled(graph.nodes[s])

    out_lst = []

    while True:
        node_id = choice_function(l, mark)
        if node_id is None:
            break
        process_node(graph.nodes[node_id])
        out_lst.append(graph.Visualize(l))
        scan_node(graph, node_id, l, p, mark)
        out_lst.append(graph.Visualize(l))
    return l, p, out_lst

#
def least_distance_choice(l, mark):
    labelled = [node_id for node_id, value in mark.items() if value == True]
    if len(labelled) == 0:
        return None
    return min(labelled, key=lambda x: l[x])

graph = Graph(arcs)
l, p, bfs_shortest_path_lst = \
    base_scanning_method(graph, 1, least_distance_choice)
animate_list(bfs_shortest_path_lst, play=True, interval=400);
Result


And this is how the prefix tree for the words 'mother', 'mother', 'monkey', 'soap', 'milk' is constructed:
The code
class TrieNode:
    def __init__(self, parent, word=None):
        #     ,
        #
        self.parent = parent
        #  ,
        self.word = word
        self.children = {}
        self.suff_link = None

def init_trie():
    trie = [TrieNode(-1)]
    return trie

def to_graph(trie):
    arcs = []
    for i, node in enumerate(trie):
        for c, nextstate in node.children.items():
            arcs.append(Arc(i, nextstate, c))
        if node.suff_link is not None and node.suff_link != 0:
            arcs.append(Arc(i,
                            node.suff_link,
                            attributes={"constraint" : "False", "style" : "dashed"}))

    return Graph(arcs)

def add_word(trie, word, steps):
    _num = 0
    for ch in word:
        if not ch in trie[_num].children:
            _n = len(trie)
            trie[_num].children[ch] = _n
            trie.append(TrieNode((_num, ch)))
        _num = trie[_num].children[ch]
        graph = to_graph(trie)
        graph.nodes[_num].SetColor('red')
        steps.append(graph.Visualize())
    trie[_num].word = word

def make_trie(words):
    steps = []
    trie = init_trie()
    steps.append(to_graph(trie).Visualize())
    for word in words:
        add_word(trie, word, steps)
        steps.append(to_graph(trie).Visualize())
    return trie, steps

words = [
    '',
    '',
    '',
    '',
    ''
]
trie, steps = make_trie(words)
animate_list(steps, play=True, interval=500);
Result
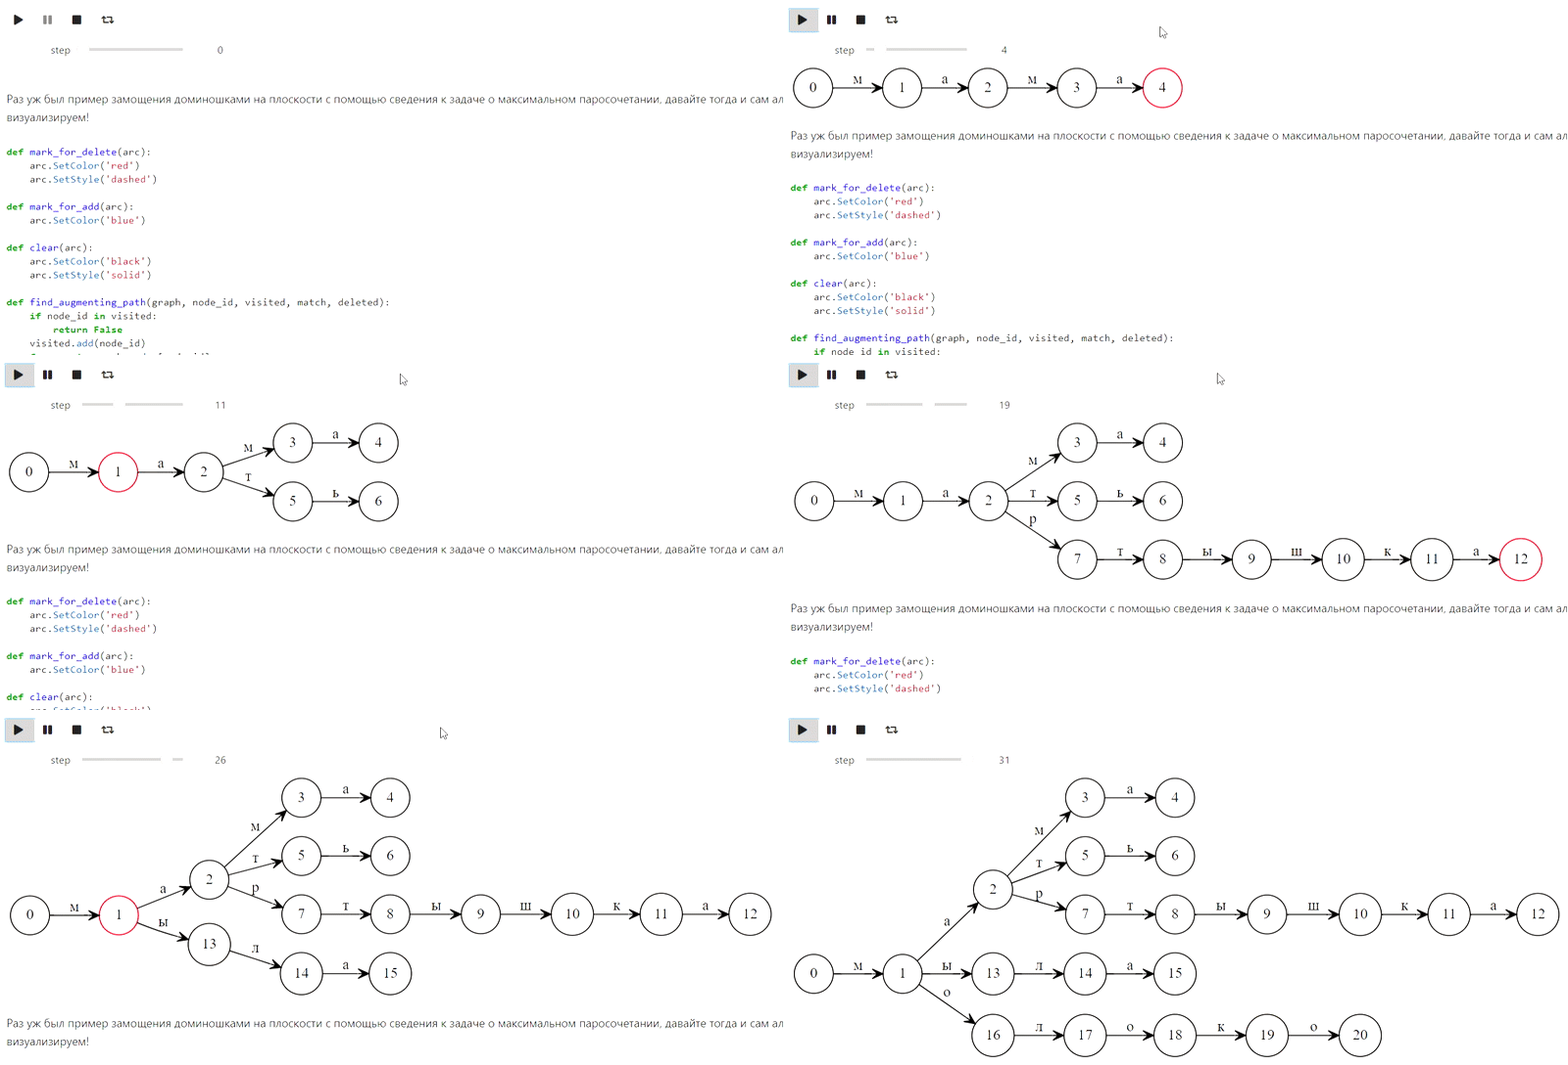

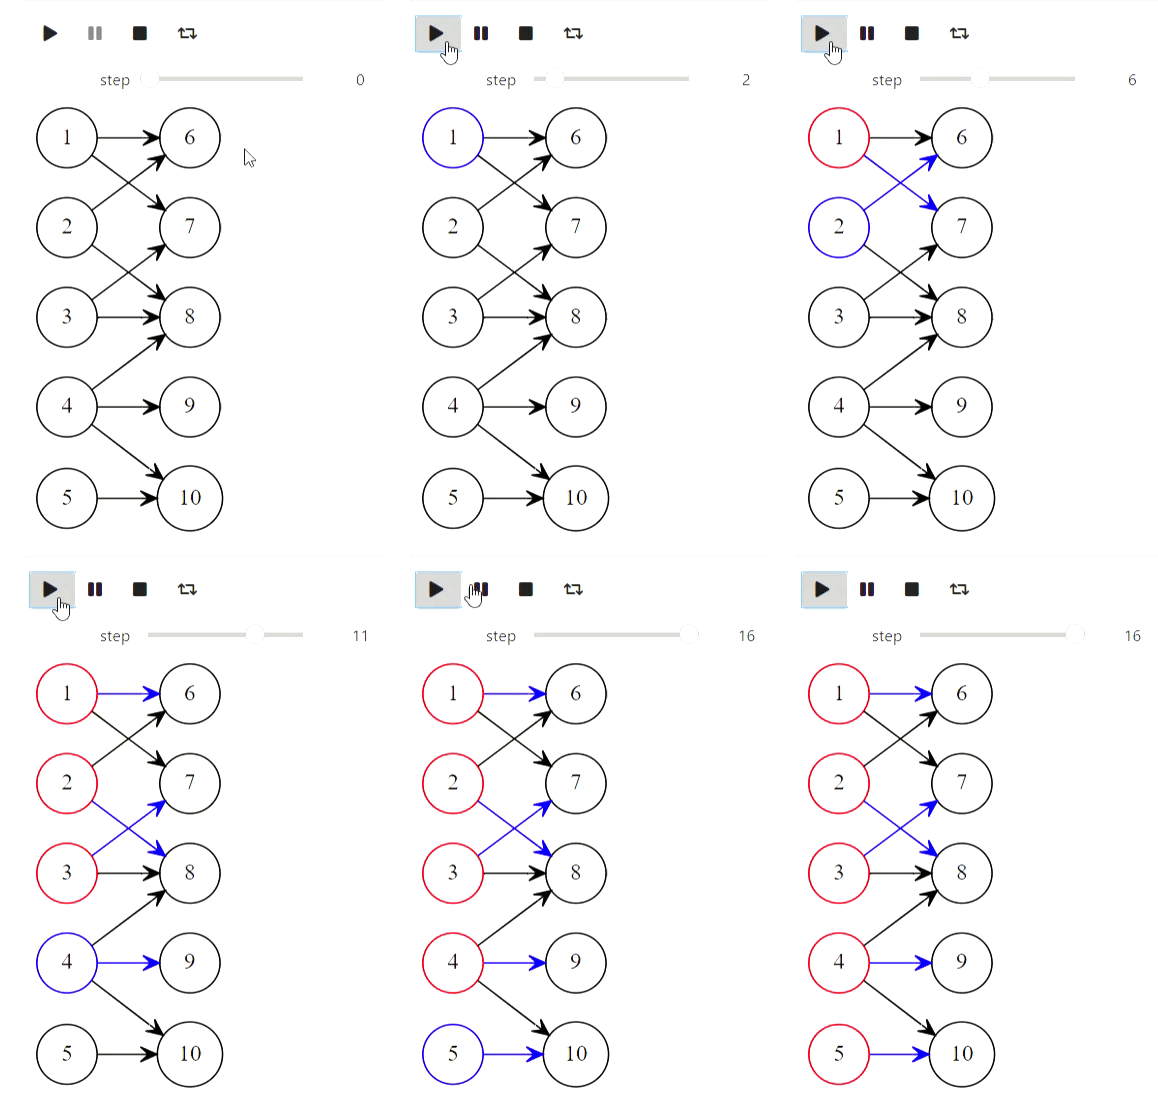
And finally, Kuhn's algorithm for finding the maximum matching:
The code
def mark_for_delete(arc):
    arc.SetColor('red')
    arc.SetStyle('dashed')

def mark_for_add(arc):
    arc.SetColor('blue')

def clear(arc):
    arc.SetColor('black')
    arc.SetStyle('solid')

def find_augmenting_path(graph, node_id, visited, match, deleted):
    if node_id in visited:
        return False
    visited.add(node_id)
    for arc in graph.nodes[node_id].arcs:
        if arc.end not in match or find_augmenting_path(graph, match[arc.end].beginning, visited, match, deleted):
            if arc.end in match:
                mark_for_delete(match[arc.end])
                deleted.append(match[arc.end])
            match[arc.end] = arc
            mark_for_add(arc)
            return True
    return False

def kuhns_matching(graph, first_part):
    states = [graph.Visualize()]
    match = dict()
    for node_id in first_part:
        node = graph.nodes[node_id]
        node.SetColor('Blue')
        states.append(graph.Visualize())
        deleted = []
        if find_augmenting_path(graph, node_id, set(), match, deleted):
            states.append(graph.Visualize())
            for arc in deleted:
                clear(arc)
            states.append(graph.Visualize())
        node.SetColor('red')
    states.append(graph.Visualize())
    return states

arcs = [
    Arc(1, 6),
    Arc(1, 7),
    Arc(2, 6),
    Arc(3, 7),
    Arc(3, 8),
    Arc(4, 8),
    Arc(4, 9),
    Arc(4, 10),
    Arc(5, 10),
    Arc(2, 8)
]
first_part = [1, 2, 3, 4, 5]
graph = Graph(arcs)
states = kuhns_matching(graph, first_part)

animate_list(states, play=True, interval=400);
Result

Algorithms with Matrices
But this part refers to the failed attempt. IPython.display can parse latex, but when I tried to use it, this is what I got (there should have been a Gaussian method):
The code
from animation_utils.latex import Matrix
from IPython.display import Math

n = 5
A = np.random.rand(n, n)
L = np.identity(n)
U = np.array(A)
steps = []
steps.append(Math(str(Matrix(L)) + str(Matrix(U))))
for k in range(n):
    x = U[k,k]
    for i in range(k+1, n):
        L[i,k] = U[i,k] / x
        U[i,k:] -= L[i,k] * U[k,k:]
    steps.append(Math(str(Matrix(L)) + str(Matrix(U))))

animate_list(steps, play=True, interval=500);
Result


So far I do not know what to do with this, but perhaps knowledgeable people will prompt.