Good day, dear readers of habr, on August 12, 2020, the stages of moving under the renovation program were published (you can find it here ) and I wondered how it would look if these stages were visualized. Here it is necessary to clarify that I am in no way connected with the Moscow government, but I am the happy owner of an apartment in a building for renovation, so I was interested to see, maybe even with some accuracy guess where the renovation wave might move in my case (and maybe in yours, if you are interested in this, dear reader). Of course, an accurate forecast will not work, but at least it will be possible to see the picture from a new angle.
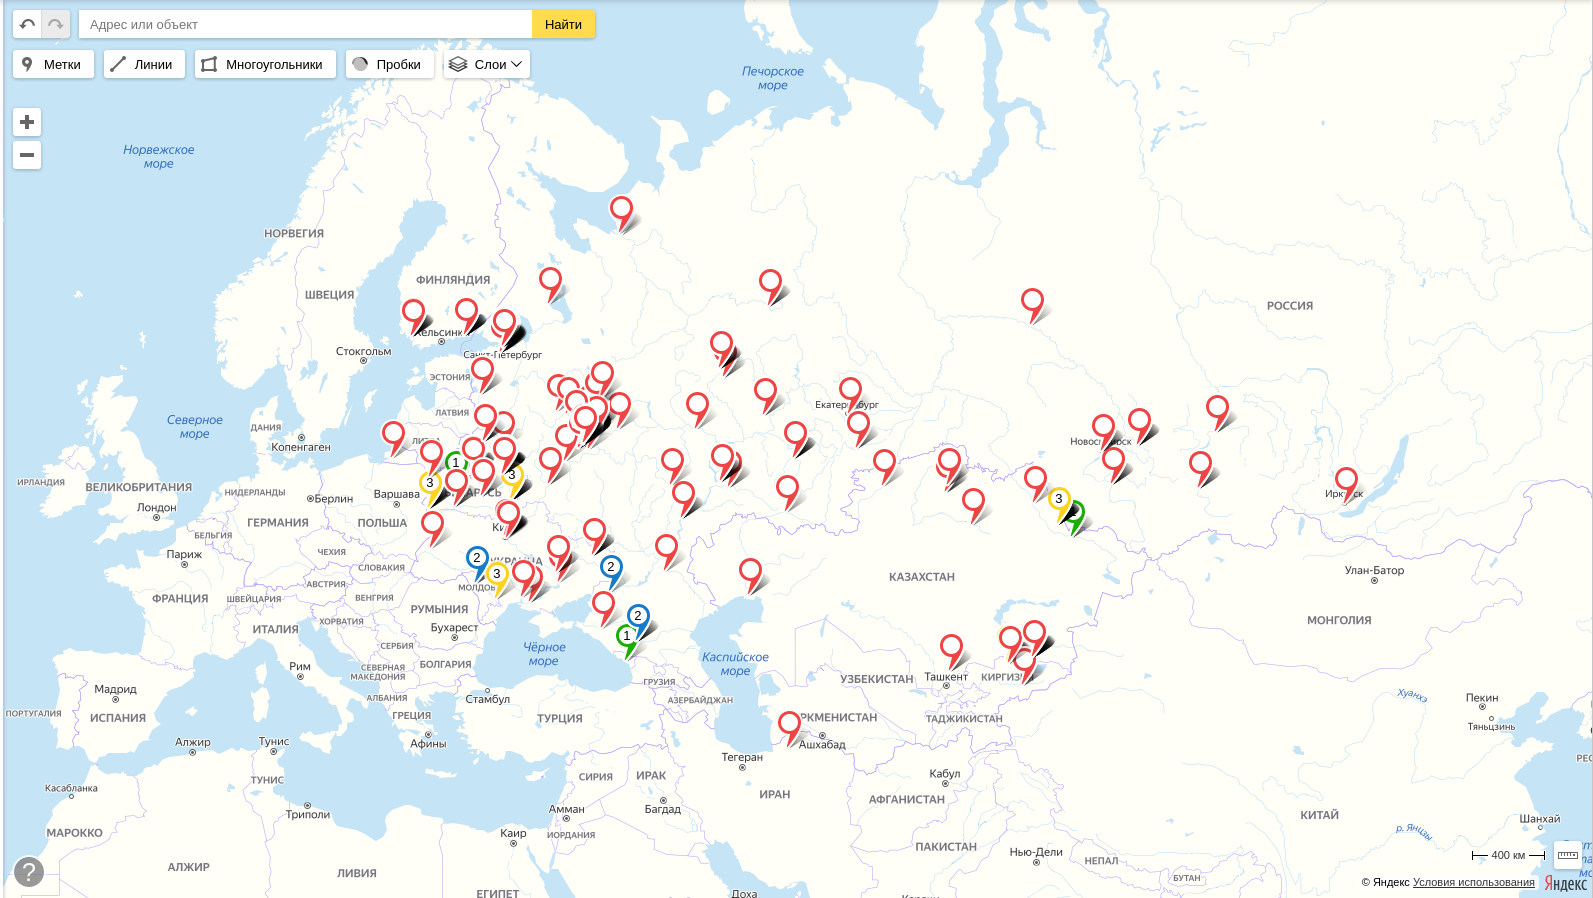
UPD August 28, 2020 We
got a complete renovation map with renovation waves and launch sites marked on it.
Introduction
2017 . 350 , , .
, . 5174 .
… ( )
12 2020 . № 45/182/-335/20 ( ) 2032 ( ):
- 2020 — 2024., 930 , 3-29
- 2025 — 2028., 1636 , 30-76
- 2029 — 2032., 1809 , 77-128
- ( 1 2021.) — 688 , 129-148
github .
- , . , .
, .. — pdf , tabula pdf .
import pandas as pd
import numpy as np
import requests
from tabula import read_pdf
import json
import os
, , .
test = read_pdf('prikaz_grafikpereseleniya.pdf', pages='3', pandas_options={'header':None})test.head()| 0 | 1 | 2 | 3 | 4 | 5 | |
|---|---|---|---|---|---|---|
| 0 | No / | NaN | unom | |||
| 1 | 1 | ., .49 c.4 | NaN | 1316 | ||
| 2 | 2 | ., .77 c.3 | NaN | 1327 | ||
| 3 | 3 | ., .2/26 | NaN | 19328 | ||
| 4 | 4 | ., .3 | NaN | 31354 |
, , , parse_pdf_table.
def parse_pdf_table(pages, pdf_file='prikaz_grafikpereseleniya.pdf'):
    df = read_pdf(pdf_file, pages=pages, pandas_options={'header':None})

    #
    df = df[~(df.iloc[:,0] == 'No /')]

    #
    df = df.iloc[:,1:4]
    df.columns = ['AO', 'district', 'address']

    return df
, , .. , pdf . ( , .. )
wave_1 = parse_pdf_table('3-29') # 2020 - 2024
wave_1['wave'] = 1wave_1.shape(930, 4)wave_2 = parse_pdf_table('30-76') # 2025 - 2028
wave_2['wave'] = 2wave_2.shape(1636, 4)wave_3 = parse_pdf_table('77-128') # 2029 - 2032
wave_3['wave'] = 3wave_3.shape(1809, 4)unknown = parse_pdf_table('129-148')
unknown['wave'] = 0unknown.shape(688, 4) (pandas), df.
df = pd.concat([wave_1, wave_2, wave_3, unknown], ignore_index=True).
df['marker-color'] = df['wave'].map({1:'#0ACF00', #
2:'#1142AA', #
3:'#FFFD00', #
0:'#FD0006'}) # .
df['iconContent'] = df['wave'].map({1:'1',
2:'2',
3:'3',
0:''}).
df['description'] = df['address']— , , , , , . ( ! :)
def add_city(x):
if x['AO'] == '':
return ', ' + x['address']
return ', ' + x['address']df['address'] = df[['AO', 'address']].apply(add_city, axis=1), , .. . , .
def geocoder(addr, key=' '):
url = 'https://geocode-maps.yandex.ru/1.x'
params = {'format':'json', 'apikey': key, 'geocode': addr}
response = requests.get(url, params=params)
try:
coordinates = response.json()["response"]["GeoObjectCollection"]["featureMember"][0]["GeoObject"]["Point"]["pos"]
lon, lat = coordinates.split(' ')
except:
lon, lat = 0, 0
return lon, lat%%time
df['longitude'], df['latitude'] = zip(*df['address'].apply(geocoder))CPU times: user 2min 11s, sys: 4.31 s, total: 2min 15s
Wall time: 15min 14s( , .. , ), - - .
len(df[df['longitude'] == 0])0.
df.to_csv('waves.csv')#df = pd.read_csv('waves.csv')GeoJSON.
def df_to_geojson(df, properties, lat='latitude', lon='longitude'):
geojson = {'type':'FeatureCollection', 'features':[]}
for _, row in df.iterrows():
feature = {'type':'Feature',
'properties':{},
'geometry':{'type':'Point',
'coordinates':[]}}
feature['geometry']['coordinates'] = [row[lon],row[lat]]
for prop in properties:
feature['properties'][prop] = row[prop]
geojson['features'].append(feature)
return geojson.. , , .
properties = ['marker-color', 'iconContent', 'description']
if not os.path.exists('data'):
os.makedirs('data')
for ao, data in df.groupby('AO'):
geojson = df_to_geojson(data, properties)
with open('data/' + ao + '.geojson', 'w') as f:
json.dump(geojson, f, indent=2) .geojson data. _.geojson .
geojson = df_to_geojson(df, properties)
with open('data/_.geojson', 'w') as f:
json.dump(geojson, f, indent=2) 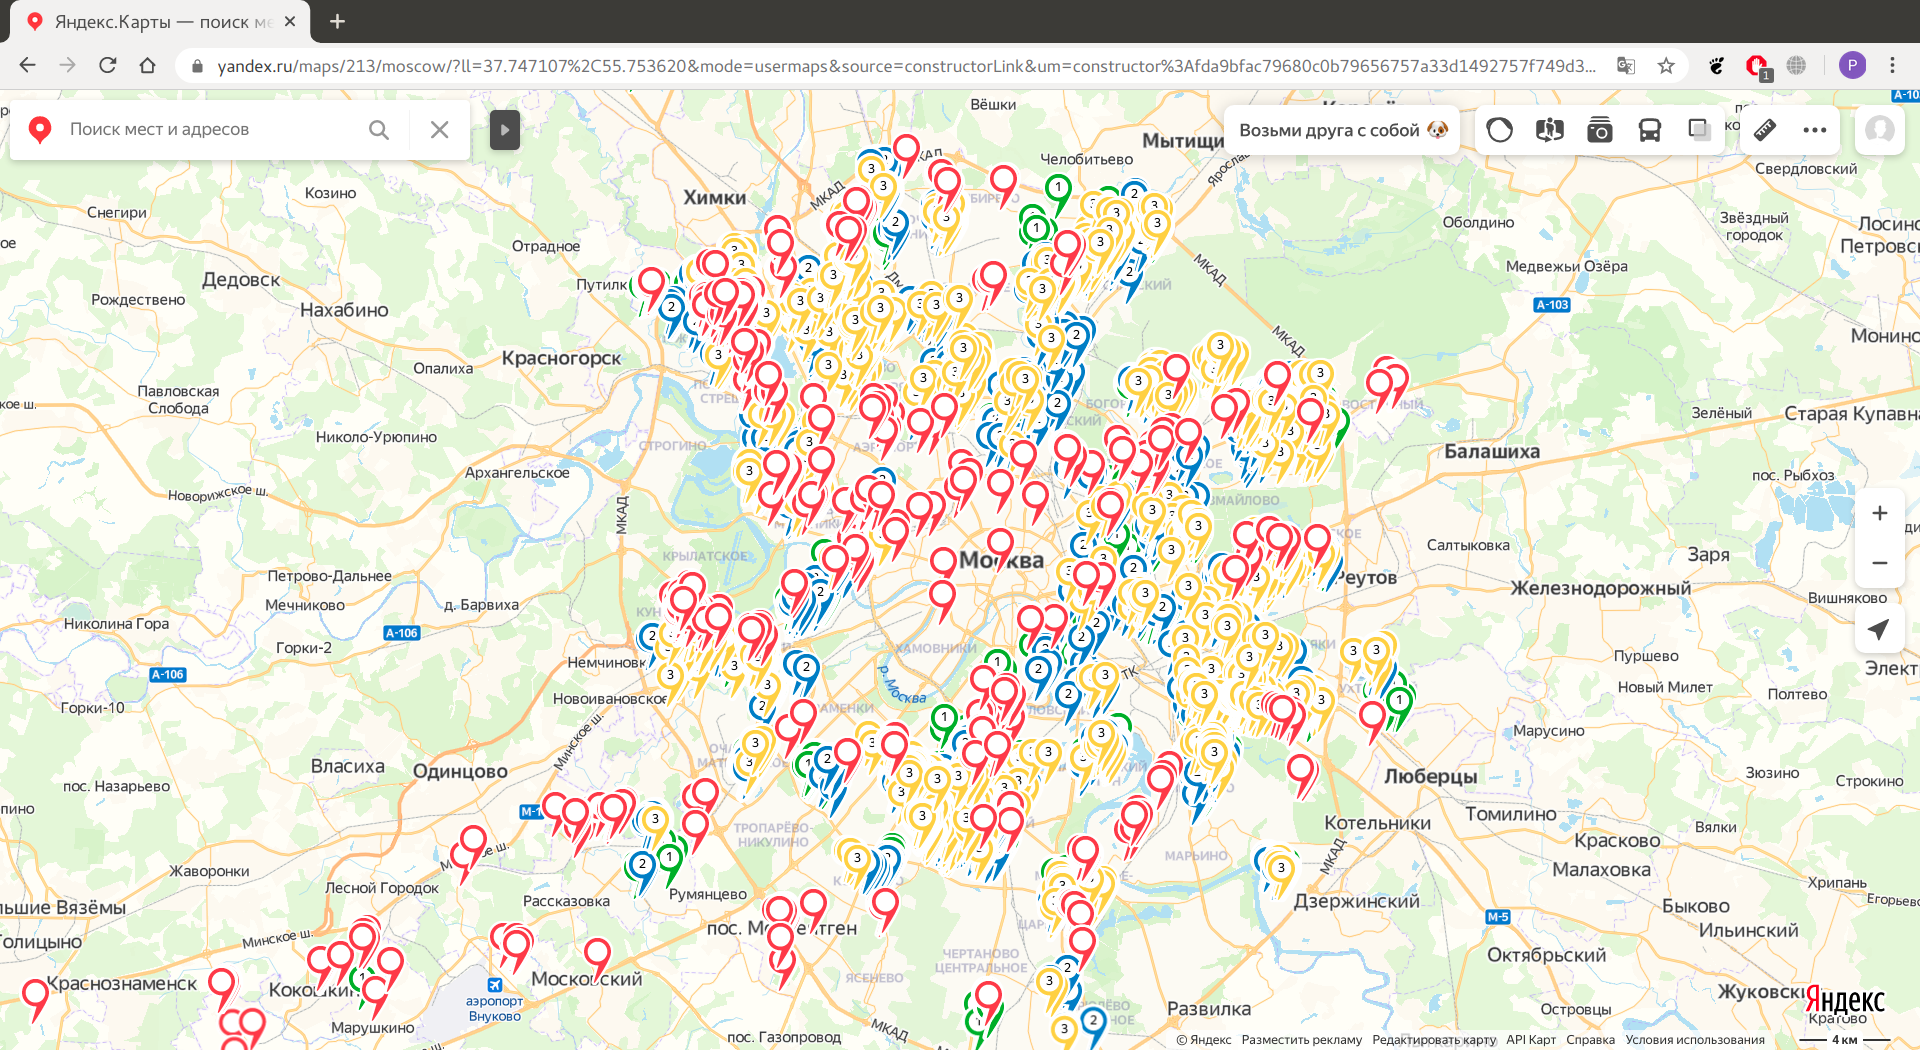
( ) .

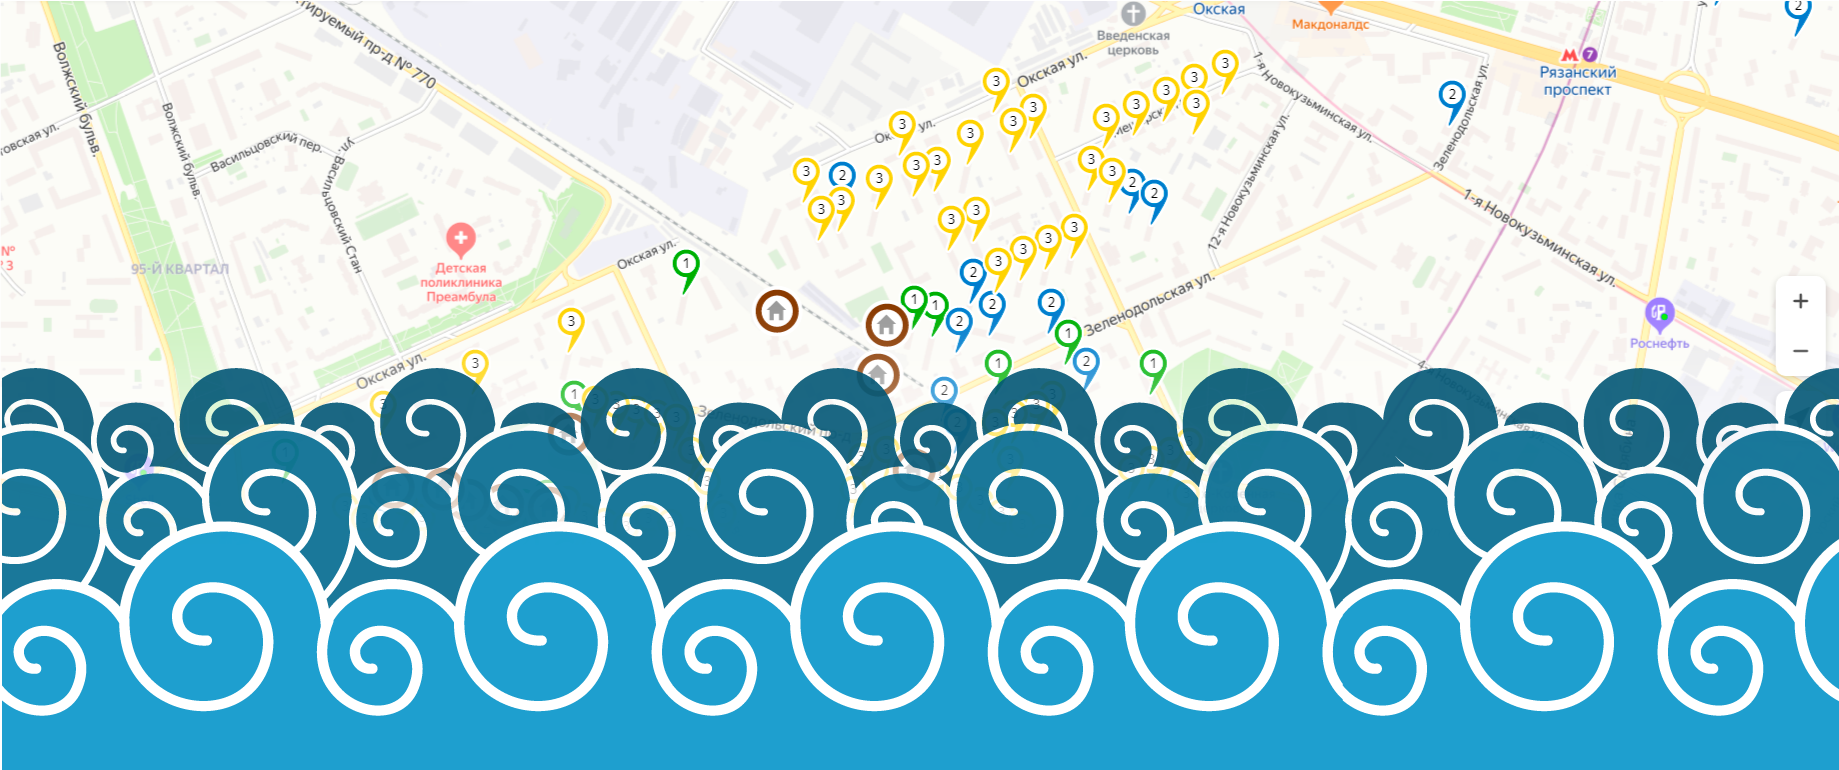
, , , , — (.), .1 - — . (. , .), .8//. ( , )
, :(
.
, . , , , , , , , . 39, , . 6, — , . 1, 2, 3, . 38.
( ), , , , .
— !

- , , / .
- , , . , PbIXTOP, .
2.0
import pandas as pd
import numpy as np
import json
from tabula import read_pdf
from tqdm.notebook import tqdm
import os
with open('renovation_address.txt') as f:
bounded_addresses = json.load(f)def parse_pdf_table(pages, pdf_file='prikaz_grafikpereseleniya.pdf'):
df = read_pdf(pdf_file, pages=pages, pandas_options={'header':None})
#
df = df[~(df.iloc[:,0] == 'No /')]
df['unom'] = df.iloc[:,-1].combine_first(df.iloc[:,-2])
#
df = df.iloc[:,[1, 2, 3, -1]]
df.columns = ['AO', 'district', 'description', 'unom']
return dfwave_1 = parse_pdf_table('3-29') # 2020 - 2024
wave_1['wave'] = 1
wave_2 = parse_pdf_table('30-76') # 2025 - 2028
wave_2['wave'] = 2
wave_3 = parse_pdf_table('77-128') # 2029 - 2032
wave_3['wave'] = 3
unknown = parse_pdf_table('129-148')
unknown['wave'] = 0df = pd.concat([wave_1, wave_2, wave_3, unknown], ignore_index=True)df['marker-color'] = df['wave'].map({1:'#0ACF00', #
2:'#1142AA', #
3:'#FFFD00', #
0:'#FD0006'}) #
df['iconContent'] = df['wave'].map({1:'1',
                                    2:'2',
                                    3:'3',
0:''})df['longitude'] = 0
df['latitude'] = 0for i in tqdm(bounded_addresses):
unom = i['unom']
coordinates = i['center']['coordinates']
df.loc[df['unom']==unom, 'longitude'] = coordinates[1]
df.loc[df['unom']==unom, 'latitude'] = coordinates[0]HBox(children=(FloatProgress(value=0.0, max=5152.0), HTML(value='')))# , ..
df.loc[(df['AO'] == '') | (df['AO'] == ''), 'AO'] = ''df[df['longitude'] == 0]| AO | district | description | unom | wave | marker-color | iconContent | longitude | latitude | |
|---|---|---|---|---|---|---|---|---|---|
| 917 | - | . (.-), .11 | 15000016 | 1 | #0ACF00 | 1 | 0.0 | 0.0 | |
| 918 | - | . (.-), .13 | 15000015 | 1 | #0ACF00 | 1 | 0.0 | 0.0 | |
| 919 | - | . (.-), .3 | 15000013 | 1 | #0ACF00 | 1 | 0.0 | 0.0 | |
| 925 | - | . (.-), .4 | 15000012 | 1 | #0ACF00 | 1 | 0.0 | 0.0 | |
| 926 | - | . (.-), .6 | 15000014 | 1 | #0ACF00 | 1 | 0.0 | 0.0 | |
| 4883 | . (. , .)... | 4405823 | 0 | #FD0006 | 0.0 | 0.0 | |||
| 4945 | . (., /), .51 | 20000002 | 0 | #FD0006 | 0.0 | 0.0 | |||
| 4946 | . (., /), .52 | 20000003 | 0 | #FD0006 | 0.0 | 0.0 | |||
| 4947 | . (., /), .53 | 20000001 | 0 | #FD0006 | 0.0 | 0.0 | |||
| 4948 | . (., /), .85 | 20000000 | 0 | #FD0006 | 0.0 | 0.0 | |||
| 4995 | (.), .1 | 20000004 | 0 | #FD0006 | 0.0 | 0.0 |
,
df.loc[917, ['longitude', 'latitude']] = 37.204805, 55.385382
df.loc[918, ['longitude', 'latitude']] = 37.205255, 55.385367
df.loc[919, ['longitude', 'latitude']] = 37.201518, 55.385265
df.loc[925, ['longitude', 'latitude']] = 37.201545, 55.384927
df.loc[926, ['longitude', 'latitude']] = 37.204151, 55.384576
df.loc[4883, ['longitude', 'latitude']] = 37.321218, 55.661308
df.loc[4945, ['longitude', 'latitude']] = 37.476896, 55.604153
df.loc[4946, ['longitude', 'latitude']] = 37.477406, 55.603895
df.loc[4947, ['longitude', 'latitude']] = 37.476546, 55.602729
df.loc[4948, ['longitude', 'latitude']] = 37.477568, 55.604659
df.loc[4995, ['longitude', 'latitude']] = 37.176806, 55.341541
with open('start_area.txt') as f:
end = json.load(f)data = {
'AO':[],
'district':[],
'longitude':[],
'latitude':[],
'description':[]
}
for i in end['response']:
data['AO'].append(i['OKRUG'])
data['district'] = i['AREA']
coordinates = i['geoData']['coordinates']
data['longitude'].append(coordinates[1])
data['latitude'].append(coordinates[0])
description = i['Address']
if 'StartOfRelocation' in i:
if i['StartOfRelocation'] is not None:
description += '\n' + i['StartOfRelocation']
data['description'].append(description)
df_start_area = pd.DataFrame(data)
df_start_area['marker-color'] = '#7D3E00' #
df_start_area['iconContent'] = '0'
df_start_area['unom'] = None
df_start_area['wave'] = -1
df = pd.concat([df, df_start_area], ignore_index=True)
def df_to_geojson(df, properties, lat='latitude', lon='longitude'):
    geojson = {'type':'FeatureCollection', 'features':[]}
    for _, row in df.iterrows():
        feature = {'type':'Feature',
                   'properties':{},
                   'geometry':{'type':'Point',
                               'coordinates':[]}}
        feature['geometry']['coordinates'] = [row[lon],row[lat]]
        for prop in properties:
            feature['properties'][prop] = row[prop]
        geojson['features'].append(feature)
return geojsonproperties = ['marker-color', 'iconContent', 'description'].
if not os.path.exists('data'):
os.makedirs('data')
for ao, data in df.groupby('AO'):
geojson = df_to_geojson(data, properties)
with open('data/' + ao + '.geojson', 'w') as f:
json.dump(geojson, f, indent=2) ( )
geojson = df_to_geojson(df, properties)

with open('data/_.geojson', 'w') as f:
json.dump(geojson, f, indent=2) , , , , , , , .
UPD 28 2020
.
PbIXTOP , .
( )
UPD 1 2020
Added up-to-date code for forming the map, hid the implementation, because most readers of the article are only interested in the map.
Thank you for attention.