In this article I want to share my experience of using open source systems Zabbix and Grafana to visualize the work of production lines. The information can be useful for those looking for a quick way to visually display or analyze the collected data in industrial automation or IoT projects. The article is not a detailed guide, but rather a monitoring system concept based on open source software for a manufacturing enterprise.
Tools
Zabbix - we have been using it for a long time to monitor the IT infrastructure of a plant. The system turned out to be so convenient and versatile that we began to enter data from production lines, sensors and controllers into it. This allowed us to collect all the metrics data in one place, to make simple graphs of resource consumption and equipment performance, but we really lacked analytics and beautiful graphs.
Grafana is a powerful analytics and data visualization tool. A large number of plugins allow you to collect data from various sources (zabbix, clickhouse, influxDB), process it on the fly (read the average value, amount, difference, etc.) and draw all kinds of graphs (from simple lines, speedometers, tables to complex diagrams ).
Draw.io is a service that allows you to draw from a simple block diagram to a floor plan in an online editor. There are many ready-made templates and drawn objects. The data can be exported in all major graphic formats or xml.
Putting it all together
There are many articles on how to install and configure Grafana and Zabbix, I will tell you about the main points of the configuration.
On the Zabbix server, a "host" is created, which will own the "items" (item) with metrics from our sensors. It is advisable to think over the names of nodes and data elements in advance and make them as structured as possible, since we will refer to them from grafana through regular expressions. This approach is convenient because you can get data from a group of elements with one request.
To configure grafana, you will need to install additional plugins:
- Zabbix by Alexander Zobnin (alexanderzobnin-zabbix-app) – zabbix
- natel-discrete-panel –
- pierosavi-imageit-panel –
- agenty-flowcharting-panel – draw.io
, Configuration\Data sources\Zabbix. api zabbix , http://zabbix.local/zabbix/api_jsonrpc.php, . , api: zabbix API version: 5.0.1
Dashboard
.
natel-discrete-panel
( = 1, =0). discrete , : , / % .

, . , . , , ( «1», «ON»)
pierosavi-imageit-panel
Imageit , . url sensor. .

agenty-flowcharting-panel
FlowCharting , . , ( , , ).
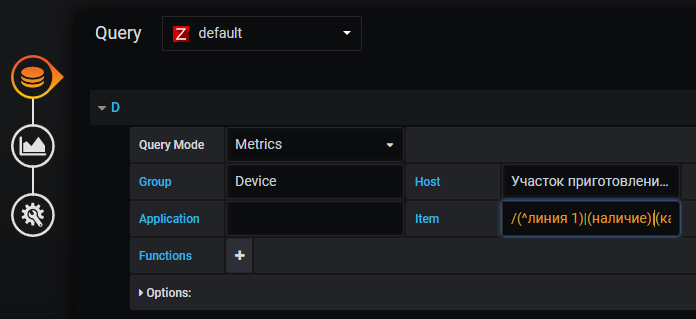
, zabbix. , . — , , . Item : «/(^ 1)|()|()/» — : , « 1» «» «»
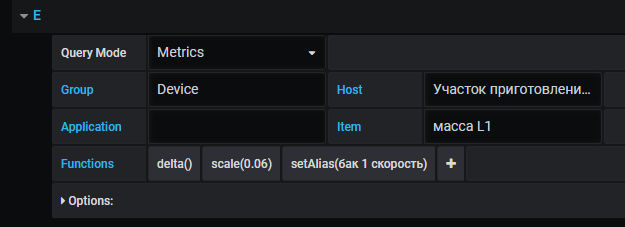
, . , (), /. : delta, , /. 0.06 /. , (setAlias) .
delta
: - ( = ). " 1 — 1 ()". : delta ( ), «+1» , «-1» «0» . 1 . - .

-
«Edit Draw», , . . , – .
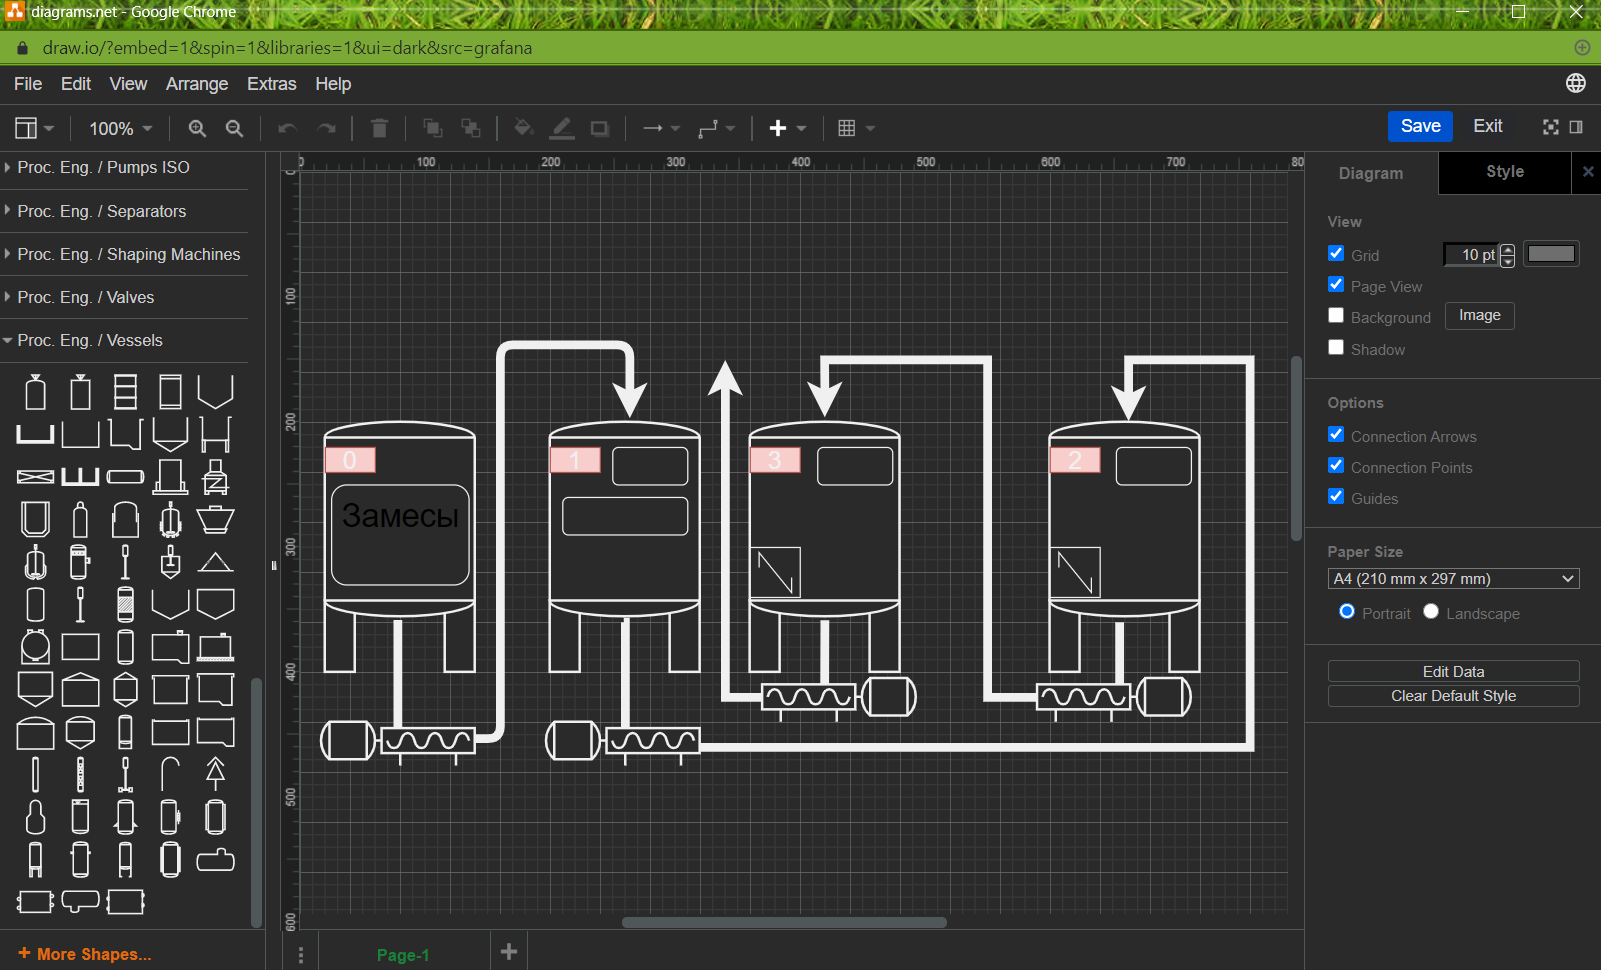
Draw.io
, .
() :
- Options — (Rule name), , (Apply to metrics). (Aggregation) , Last — , , avg — , .
- Thresholds — , , . «0» — «Ok» , «>1» Critical .
- Color/Tooltip Mappings» «Label/Text Mappings» — . , – . .

flowcharting , :
- /
- - ()
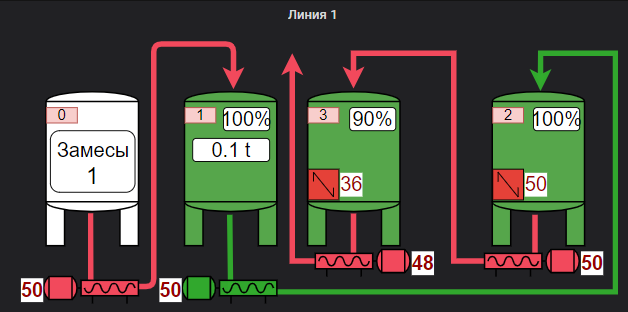
. , . , – .
I really liked the Zabbix + Grafana bundle and I recommend paying attention to it if you need to quickly process data from controllers or sensors without programming or implementing complex commercial products. Of course, this will not replace professional SCADA systems, but it will be sufficient as a tool for centralized monitoring of the entire production.