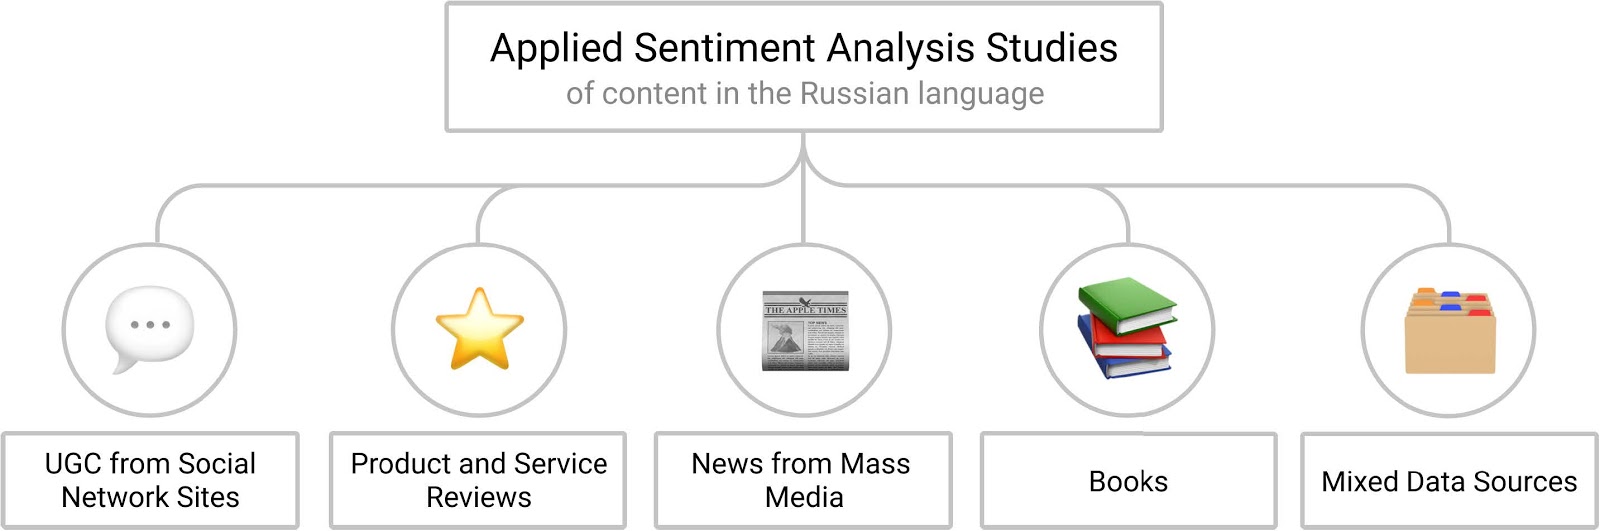
The researchers applied sentiment analysis to completely different Russian-language texts: posts from social networks, reviews, news articles and books. As a consequence, the results of their research were also completely different and extremely interesting. For example, who would have thought that texts with a positive tone make learning a foreign language more interesting, but less effective? In this series of articles, we will consider how and for what purposes the sentiment analysis approaches were applied for Russian-language texts, what results were achieved, what problems arose, and also talk a little about promising directions.
Unlike previous works, I focused on applied applications, and not on the approaches themselves and their quality of classification. In the first articlewe discussed what “sentiment analysis” is, what it is and how it has been used over the past 8 years to analyze Russian-language texts. In this part, we'll take a closer look at each of the 32 major studies I've found. In the third and final part (coming next week), we will talk about common challenges faced by researchers, as well as promising directions for the future.
NB: The article was written for a scientific journal, so there will be many links to sources.
Many studies used data from Russian social networks and aggregation platforms. Below is a brief description of the most popular Russian and foreign resources and statistics of their use.
- 90 , . Deloitte [98], , 70 % . 16—24 , .
- YouTube , 62 % . 16—24 , 58—64 %.
- Twitter [98], 5 % . 25—65 , 55—64 .
- LiveJournal , 3 % . 35—44 , .
- Medialogia — , . 500 . 100 . 52 000 900 .
- IQBuzz is a monitoring service that processes information from more than 10,000 sources in the media, from Facebook, Twitter, VKontakte, My World, Instagram, 4sq, LiveJournal, LiveInternet, Google, YouTube, RuTube and others. The system is able to automatically identify positive and negative messages, deduplicate and perform complex searches in the accumulated database.
Below I will describe the studies found, the results obtained in them and the conclusions drawn by the authors, which may not coincide with my position.
1. UGC on social media

Many social networks have turned into modern tools for social engagement [53]. User-generated data is an important and accessible source of public opinion, or at least a reflection of it, so it can complement or replace opinion polls [54]. User-generated data was examined according to three criteria:
- Attitude to different topics.
- Social mood indices.
- Features of user interaction with data expressing different moods.
1.1. Attitude to different topics
The most frequent topics in the study of Russian-language texts were the problems of interethnic relations and migration, as well as the Ukrainian crisis. Considerable attention was paid to the analysis of social tension, as well as other topics.
1.1.1 Ethnic groups and migrants
The problems of interethnic relations and migration, as well as related topics, have been deeply investigated using well-developed sociological methods. However, the rapid development of the internet and natural language processing has allowed research on a relatively new approach. Social media allows individuals and groups to participate openly in conflict. On the Internet, judgments about migration and ethnicity issues can spread much faster and reach a much wider audience than before the Internet age [54]. More academic research has shown that negative online content contributes to offline ethnic conflict [99] and hate crimes [100]. In this way,With the development of Internet technologies, the importance of analyzing the problems of interethnic relations and migration based on online content increases.
A study by Bodrunova and colleagues focused on the attitude of the Russian-speaking online community towards migrants in public discourse [81]. The authors collected 363,579 posts from leading Russian bloggers from February 4 to May 19, 2013. Applying the strategy described in [59], [101], the researchers using Latent Dirichlet Allocation [102] have identified relevant discussions. We then manually mapped out some of the discussions and sentiment classes. Then we trained a model of binomial logistic regression (Binomial Logistic Regression [32]) for a number of text classification problems, including the classification of emotions. According to the results, all migrants were negatively perceived, and most of all those who arrived from the North Caucasus compared to immigrants from Central Asia and the Americans.There was no positive attitude towards Europeans or Americans. At the same time, Europeans, Americans and Caucasians were perceived as aggressors, not victims. Central Asians were described as aliens with negative connotations. In general, Europeans were not perceived as strangers or partners, Americans were perceived as dangerous, and Jews as completely harmless. The authors of the study argue that the post-Soviet mental division of the population does not completely coincide with the current geographical boundaries, due to which previously close groups are already perceived as separate nations with their own political agendas. One of the main drawbacks of this work is the lack of an assessment of the quality of the data description and the specification of classification metrics.Central Asians were described as aliens with negative connotations. In general, Europeans were not perceived as strangers or partners, Americans were perceived as dangerous, and Jews as completely harmless. The authors of the study argue that the post-Soviet mental division of the population does not completely coincide with the current geographical boundaries, due to which previously close groups are already perceived as separate nations with their own political agendas. One of the main drawbacks of this work is the lack of quality assessment of data description and specification of classification metrics.Central Asians were described as aliens with negative connotations. In general, Europeans were not perceived as strangers or partners, Americans were perceived as dangerous, and Jews as completely harmless. The authors of the study argue that the post-Soviet mental division of the population does not completely coincide with the current geographical boundaries, due to which previously close groups are already perceived as separate nations with their own political agendas. One of the main drawbacks of this work is the lack of quality assessment of data description and specification of classification metrics.that the post-Soviet mental division of the population does not completely coincide with the current geographical boundaries, due to which previously close groups are already perceived as separate nations with their own political agendas. One of the main drawbacks of this work is the lack of an assessment of the quality of the data description and the specification of classification metrics.that the post-Soviet mental division of the population does not completely coincide with the current geographical boundaries, due to which previously close groups are already perceived as separate nations with their own political agendas. One of the main drawbacks of this work is the lack of quality assessment of data description and specification of classification metrics.
The team led by Koltsova [82], using adapted methods from previous works ([103], [104]), estimated the total volume of discussions related to interethnic relations on the sites of Russian-language social networks. To create a primary corpus of 2,660,222 texts, the authors developed a complex list of ethnonyms and bigrams, covering 97 ethnic groups in the post-Soviet territory. Then, using manual markup, a training dataset of 7,181 texts was created, each of which was annotated by three experts on several criteria, including the presence of intergroup conflicts, positive intergroup contacts, and overall negative or positive tone. To classify emotions, the authors trained a logistic regression model on a labeled dataset [32] and achieved F 1 = 0.75 for positive sentiment and F1 = 0.68 for negative. The authors found that attention to ethnic groups varies greatly between different groups and regions. Based on this research, the team led by Koltsova improved the quality of the results obtained and increased the number of prejudices, which can be found in the following work [83]. To begin with, the authors increased the dataset for manual processing from 7,181 to 14,998 unique texts. Then the texts were marked up by at least three independent experts. Next, the authors taught a logistic regression model to divide texts into three categories (positive, neutral, and negative attitude) using the best hyperparameters taken from the previous study. This helped significantly improve the classification metrics. Average values for sentiment were: P = 0.67, R = 0.55 and F 1= 0.58.
Nagorny in his work [84] investigated the theme of the structure of ethnic discussions in Russian-language social networks. Based on a list of more than 4,000 words related to ethnic discussions, the author collected 2,659,849 texts from VKontakte and IQBuzz for the period from January 2014 to December 2016. Further, the author used ISLDA [26], a modification of the LDA algorithm developed at the HSE Internet Research Laboratory. To calculate the sentiment class, Nagorny used SentiStrength [22] with the Russian-language dictionary of emotions LINIS Crowd [26]. For each topic, the polarity index was calculated as the sum of the products of the probability of this topic in the text by the value of the corresponding emotion, divided by the total importance of the topic. After analyzing the thematic profile of ethnic discussions obtained with the help of the LDA, Nagorny identified the most negative and important topics. It revealed,that the bulk of the discussions related to Russian-Ukrainian relations in connection with the recent conflict between the countries. As a result, it was difficult to separate interethnic topics from political ones, as the conflict influenced the polarity of discussions on the Internet. The most negative discussions are related to the Uzbek nationality and Turkish-Armenian relations in the context of the Armenian Genocide. However, this study has drawbacks. First, it is not clear exactly how the data was collected. Although IQBuzz claims to track all mentions on the Internet, it is impossible to verify this without full access to VK messages. Second, the classification metrics were not measured on large sets of texts, so it is difficult to test the quality of the classified emotions.As a result, it was difficult to separate interethnic topics from political ones, as the conflict influenced the polarity of discussions on the Internet. The most negative discussions are related to Uzbek nationality and Turkish-Armenian relations in the context of the Armenian genocide. However, this study has drawbacks. First, it is not clear exactly how the data was collected. Although IQBuzz claims to track all mentions on the Internet, it is impossible to verify this without full access to VK messages. Second, the classification metrics were not measured on large sets of texts, so it is difficult to test the quality of the classified emotions.As a result, it was difficult to separate interethnic topics from political ones, as the conflict influenced the polarity of discussions on the Internet. The most negative discussions are related to the Uzbek nationality and Turkish-Armenian relations in the context of the Armenian Genocide. However, this study has drawbacks. First, it is not clear exactly how the data was collected. Although IQBuzz claims to track all mentions on the Internet, it is impossible to verify this without full access to VK messages. Second, the classification metrics were not measured on large sets of texts, so it is difficult to test the quality of the classified emotions.The most negative discussions are related to the Uzbek nationality and Turkish-Armenian relations in the context of the Armenian Genocide. However, this study has drawbacks. First, it is not clear exactly how the data was collected. Although IQBuzz claims to track all mentions on the Internet, it is impossible to verify this without full access to VK messages. Second, the classification metrics were not measured on large sets of texts, so it is difficult to test the quality of the classified emotions.The most negative discussions are related to Uzbek nationality and Turkish-Armenian relations in the context of the Armenian genocide. However, this study has drawbacks. First, it is not clear exactly how the data was collected. Although IQBuzz claims to track all mentions on the Internet, it is impossible to verify this without full access to VK messages. Second, the classification metrics were not measured on large sets of texts, so it is difficult to test the quality of the classified emotions.therefore, it is difficult to test the quality of classified emotions.therefore, it is difficult to test the quality of classified emotions.
Researchers Borodkina and Sibirev from St. Petersburg University examined discussions on Russian-language Twitter related to the problems of international migration, as well as to various problems associated with migration [55]. The authors used 13,200 posts published between November 2017 and February 2018. This data was collected on the topic "migration" and related keywords. Then the authors, using the Ohai coefficient, measured the similarity of tags and, using the Pareto principle, removed insignificant, weak links from the network graph. For sentiment analysis, a classifier was trained based on a support vector model [33]. And to determine the connections between characteristics (for example, emotions, characteristics of the content), appropriate analysis methods were used. It turned out that among Russians living in different countries, there is a very similar attitude towards migrants.A significant proportion of users express a negative attitude towards migrants of other nationalities. Main topics discussed: risks to culture and security associated with terrorism and illegal migration, human rights in general, violation of the rights of immigrants in Russia in the social and economic spheres. This study has several small drawbacks. The sentiment analysis approach is described briefly, without the details of the preprocessing stage, model hyperparameters and the final quality of classification using the trained model. In addition, Twitter's core API provides only partial access to all posts, so the representativeness of the analyzed data is questionable.related to terrorism and illegal migration, human rights in general, violation of the rights of immigrants in Russia in the social and economic spheres. This study has several small drawbacks. The sentiment analysis approach is described briefly, without the details of the preprocessing stage, model hyperparameters and the final quality of classification using the trained model. In addition, Twitter's core API provides only partial access to all posts, so the representativeness of the analyzed data is questionable.related to terrorism and illegal migration, human rights in general, violation of the rights of immigrants in Russia in the social and economic spheres. This study has several small drawbacks. The sentiment analysis approach is described briefly, without the details of the preprocessing stage, model hyperparameters, and the final quality of the trained model classification. In addition, Twitter's core API provides only partial access to all posts, so the representativeness of the analyzed data is questionable.model hyperparameters and the final quality of the classification using the trained model. In addition, Twitter's core API provides only partial access to all posts, so the representativeness of the analyzed data is questionable.model hyperparameters and the final quality of the classification using the trained model. In addition, Twitter's core API provides only partial access to all posts, so the representativeness of the analyzed data is questionable.
Thus, in the context of the study of migration and interethnic relations, researchers have mostly studied user-generated data from social networks, using a combination of thematic modeling and sentiment analysis. The concept of ethnicity is well researched in the academic literature, but from the point of view of computational linguistics, the definition of nationality in user-generated texts is reduced to the task of identifying ethnic markers used by the authors of these texts [54]. Therefore, to identify relevant texts, researchers often create lists of markers of ethnic status and look for texts containing such markers. However, extracting representative data is difficult because not all platforms give full access to all of their information.Sentiments are then usually analyzed at the document or aspect level. Because negative language may contain personally identifiable information, as well as offensive or hate speech, such content may be censored in accordance with social media guidelines and legal requirements. The Criminal Code of the Russian Federation has a regulatory framework that regulates public calls for radical action, which should affect the volume of strong negative statements in both online and offline discussions. All these features need to be explicitly described in the section on restrictions.such data may be censored in accordance with social media rules and legal requirements. The Criminal Code of the Russian Federation has a regulatory framework that regulates public calls for radical action, which should affect the volume of strong negative statements in both online and offline discussions. All these features need to be explicitly described in the section on restrictions.such data may be censored in accordance with social media rules and legal requirements. The Criminal Code of the Russian Federation has a regulatory framework that regulates public calls for radical action, which should affect the volume of strong negative statements in both online and offline discussions. All these features need to be explicitly described in the section on restrictions.
1.1.2. Ukrainian crisis
Relations between Russia and Ukraine became tense after the revolution in 2014, the subsequent entry of Crimea into the Russian Federation and the armed conflict in the Donetsk and Luhansk regions. As many social media platforms have evolved into modern tools of social engagement [53], a number of studies in computational linguistics have been conducted, the authors of which have tried to explore the possibility of using online discourse to analyze the expressed opinions and characteristics of discourse participants. According to the 2001 census of Ukraine, 67.5% of its residents consider Ukrainian as their native language, and 29.6% - Russian. Therefore, in addition to, or instead of, Ukrainian, researchers usually analyzed Russian-language texts.
A group of researchers led by Duvanova studied the impact of the Ukrainian armed conflict on online social ties between all Ukrainian regions [85]. The authors used VKontakte as a source, as it is the most popular social network in Ukraine. First, based on keywords, they identified a list of relevant communities - 14,777. Then, based on this list, 19,430,445 publications and 62,193,711 comments were collected using the software for monitoring social networks presented in the work of Semyonov and Vejyalainen [105], as well as Semyonov and coauthors [106]. To classify texts into positive and negative, the authors applied a rule-based approach with a dictionary of 8,863 positive and 24,299 negative words in Russian and Ukrainian. It turned out that discussions in Ukraine became more polarized due to military actions, for example,in the eastern regions of the country, the number of negative and positive statements increased. However, in other parts of Ukraine, hostilities did not have a noticeable effect on the intensity of expression of emotions. Thus, the hostilities generated a strong emotional reaction in the country, but there was no inevitable increase in social cohesion in internal communications between the regions. However, the authors did not provide details on the preprocessing and training of the model, and the classification metrics.but there was no inevitable increase in social cohesion in internal communications between regions. However, the authors did not provide details on the preprocessing and training of the model, and the classification metrics.but there was no inevitable increase in social cohesion in internal communications between regions. However, the authors did not provide details on the preprocessing and training of the model, and the classification metrics.
The work of the team led by Volkova [86] studied the expressions on VKontakte of public opinion during the Russian-Ukrainian crisis. Based on the list of keywords, the authors collected from VKontakte a set of 5,970,247 publications that appeared in the period from September 2014 to March 2015. For the purposeful prediction of opinions, the researchers used the POLYARNIK classification system [107] based on morphological and syntactic rules, emotional vocabulary and supervised learning models [108]. To classify emotions, the authors compiled a set of independent Twitter discussions related to the crisis. With the help of the approaches described in [109] and [110], the authors have implemented automatic marking of texts according to six basic Ekman emotions [111].They then manually rechecked the automatic annotation with native Russian and Ukrainian speakers. The result was a set of 5,717 Twitter posts expressing anger, pleasure, fear, sadness, disgust, and surprise, as well as 3,947 non-emotive posts. The final classification of emotions expressed in the texts was carried out in two stages. At first, the texts were classified as emotional and non-emotional. Then, using the logistic regression model [32], emotional texts were divided into six classes based on stylistics, vocabulary, and binary unigrams. Weighted Fwas carried out in two stages. At first, the texts were classified as emotional and non-emotional. Then, using the logistic regression model [32], emotional texts were divided into six classes based on stylistics, vocabulary, and binary unigrams. Weighted Fwas carried out in two stages. At first, the texts were classified as emotional and non-emotional. Then, using a logistic regression model [32], emotional texts were divided into six classes based on stylistics, vocabulary and binary unigrams. Weighted F1-measure of the emotional classification model reached 58%. According to the results obtained, the share of positive opinions regarding Euromaidan was higher in Ukraine than in Russia. For comparison, the share of positive statements about Putin and Crimea was higher in Russia than in Ukraine. In addition, some of the results contradict common media misconceptions. For example, in Russia there were publications whose authors spoke positively in favor of the United States and against Putin, while in Ukraine there were publications expressing support for Putin, not Euromaidan. The main drawback of the study is that the authors used POLYARNIK to analyze sentiment without assessing the quality of the classification of texts on the chosen topic. Moreover, the authors applied a model trained on Twitter messages to recognize emotions in messages from VKontakte,which have different linguistic characteristics, at least the average length of the text. Also, many questions arise about the quality of annotation by a single assessor, since it is impossible to measure the metrics of an inter-expert agreement.
Taking the Russian-Ukrainian conflict of 2014 as a basis, Rumshisky and co-authors analyzed the dynamics of the reflection of the political conflict in social networks [87]. Unlike the study by Volkova [86], the researchers did not rely on noisy data about the authors' location when creating the corpus for analysis. Instead, they focused on the self-identification of user groups associated with the crisis. After analyzing the VKontakte data, the researchers manually selected 51 anti-Maid groups with 1,942,918 unique users, and 47 promoted groups with 2,445,661 users. Then we selected all the publications on the walls of these groups, added publications from the walls of active users and those who liked these publications. Only those publications were added to the collectionin which at least one keyword from a predefined list was encountered. To predict the sentiment of Russian-language texts, the researchers used an improved version of the SentiMental library, which is a dictionary-based sentiment analysis system. The research results confirmed that the increase in the intensity of the conflict is accompanied by negative statements. The analysis examined the relationship between the dominant sentiment and the random walk controversy measure. As the number of disputes increases, so does the standard deviation of the overall sentiment expressed by opposing groups, as well as the measure of the random wandering of the discussion. The main drawback of the study is that its authors did not provide any details about preprocessing and training.To predict the sentiment of Russian-language texts, the researchers used an improved version of the SentiMental library, which is a dictionary-based sentiment analysis system. The research results confirmed that the increase in the intensity of the conflict is accompanied by negative statements. The analysis examined the relationship between the dominant sentiment and the random walk controversy measure. As the number of disputes increases, so does the standard deviation of the overall sentiment expressed by opposing groups, as well as the measure of the random wandering of the discussion. The main drawback of the study is that its authors did not provide any details about preprocessing and training.To predict the sentiment of Russian-language texts, the researchers used an improved version of the SentiMental library, which is a dictionary-based sentiment analysis system. The research results confirmed that the increase in the intensity of the conflict is accompanied by negative statements. The analysis examined the relationship between the dominant sentiment and the random walk controversy measure. As the number of disputes increases, so does the standard deviation of the overall sentiment expressed by opposing groups, as well as the measure of the random wandering of the discussion. The main drawback of the study is that its authors did not provide any details about preprocessing and training.
Zaeziev suggested studying the process of political mobilization by analyzing the content of social networks [88]. The Ukrainian revolution of 2013-2014 was taken as a basis. The author focused on the first stage of the protests, from February 21, 2013 to February 22, 2014. He analyzed publications in the most popular social networks in Ukraine: VKontakte and Facebook. Zaeziev identified a set of relevant keywords based on the general recommendations of Godbowl [112], and then collected more than 124,000 messages using IQBuzz. Using the IQBuzz sentiment recognition algorithms, the researcher classified the texts into categories: negative, neutral, positive, and mixed. Assuming that supporters of Euromaidan would express a positive attitude towards this event, the authors removed all non-positive messages from the collection.Then we filtered the collection by a predefined list of keywords, leaving 4255 posts. Analysis of these data revealed that on the very first night of protests, social networks were used primarily as a tool for political mobilization, and later as a tool for media coverage. The main drawback of the study is that it does not describe sentiment classification metrics, so it is difficult to verify the accuracy of the results.
Researcher Tokarev from the Moscow State Institute of International Relations studied the discourse among the main Ukrainian bloggers regarding the territory and population of Donbass in the period from 2009 to 2018 [56]. The author analyzed the semantics, frequency and emotionality of discussions in the Ukrainian segment of Facebook. The research consisted of several stages. First, opinion leaders were identified and their publications were downloaded from January 1, 2009 to February 15, 2018. Then, based on predetermined keywords from the discourse, the authors identified publications dedicated to Donbass. At the next stage, a dictionary of emotions was created, which was later used to differentiate discussions according to the degree of their emotionality. With the help of volunteers, a vocabulary of 566 marker words for the territory and population was collected.Each word was presented in Russian and Ukrainian. A team of 69 assessors then annotated the vocabulary into five grades: positive, neutral-positive, neutral, neutral-negative, and negative. Finally, the degree of expression of emotions and the dynamics of discussions were assessed. A corpus of 1,069,687 publications of 376 major bloggers in seven languages was analyzed. It turned out that the beginning of discussions about the territory and population of Donbass began at the turn of 2013-2014. Prior to that, the frequency of mentioning this area was almost zero. A significant negative attitude towards the population was expressed, and there was practically no negative discussion of the territory. A neutral tone prevailed. The number of positive and negative discussions of the territory was much less compared to the discussions of the population.This allows us to conclude that there is a high degree of uncertainty among the main bloggers regarding the territory, as well as the low probability of the discourse going from neutral to positive tone. The drawbacks of this study are the same as those of Zaeziev's work [88]; there is no description of the classification metrics.
Thus, during the study of the Ukrainian crisis, researchers used information not only about the sentiment, but also about the location of the authors of the publications in order to study the territorial binding of users. To determine the relevant texts, a list of conflict marker words was collected and texts containing these markers were searched. When analyzing ethnic groups or problems associated with migration, it is difficult to extract representative data and exhaustively describe the accompanying restrictions.
1.1.3. Social tension
The processes observed in modern Russian society create the need to place social conflicts in a specific framework [113]. Given the widespread use of social media with benefits and risks for civil society, [114] the analysis of online content should be given due and appropriate attention, including to identify social tensions. You can measure online social tensions using indices and metrics, and then use this information to track outbursts of tension, which is a form of anticipatory governance [115].
The team led by Donchenko analyzed the comments on VKontakte on socially sensitive topics for the period from January to June 2017 [89]. Researchers compiled a list of popular topics related to social tension issues, and collected relevant user publications through the VKontakte API. Then the texts were pre-processed: the stemming of words (stemming) was selected, punctuation was removed, and standard abbreviations and slang words were replaced with the corresponding normal words. For categorization by topic, the authors trained a support vector model (SVM) [33] with TF-IDF vectorization [116]. Social hot topics: unemployment, corruption and rising prices for consumer goods. Also, using the SVM model, the polarity of the tonality was classified. It turned out that protest moods are usually concentrated in the centers of densely populated regions.One of the main drawbacks of the work is the lack of an assessment of the quality of data annotation and the absence of a specification of sentiment classification metrics. Koltsova and Nagorny found out what topics are classified as social problems by analyzing the comments of readers of regional Russian media [57]. The authors collected a set of 33,887 news stories and 258,107 comments from the Omsk media sites (Gorod55, BK55, NGS Omsk and Omsk-Inform) for the period from September 2013 to September 2014. To determine the topics to which news texts belong, the authors used Gensim- implementation [117] of the latent Dirichlet allocation algorithm [102] with a metric developed by Arun, Suresh, Madhavan and Murthy [118]. To classify the sentiment of comments, the authors used SentiStrength [22] with the PolSentiLex vocabulary. Koltsova and Nagorny found that such topics,how entertainment, culture, sports and holidays most often evoke positive emotions, and most negative emotions are associated with crime and disasters. Researchers computed an index of importance and polarity for each topic. A fundamental problem with the use of SentiStrength in this study is that the authors did not describe the metrics for classifying the data for the selected topic, so it is difficult to verify the accuracy of the results.
Thus, the authors used two approaches to identify acute social topics. In the first case, the data is filtered based on a list of keywords, and in the second, unsupervised clustering of all data is applied, followed by the identification of acute social topics. When using data from social networks, the authors faced the same difficulties in extracting representative data. However, this is not relevant when analyzing data from news sites, because they usually do not have restrictions on access to published information. Since the discourse on sensitive topics can be accompanied by harsh statements, the latter can be censored in accordance with user agreements and legislation.
1.1.4. Other topics
A number of studies have focused on topics from other fields. Researcher Ruleva studied the reaction in Russian-speaking Twitter and YouTube users to a meteor explosion over Chelyabinsk in February 2013 [58]. Over the past 100 years, it has been the largest celestial body to have entered the Earth's atmosphere. As expected, the event sparked emotional debate in traditional media and online platforms. The researcher collected 495 Twitter posts from February 15-20, 2013 using the hashtag “meteorite”, as well as an unspecified number of YouTube videos. Emphasis was placed on a comparative analysis of the content from both sites in the context of the differences between primary and secondary spoken genres [119]. However, the texts also gave a certain interpretation of feelings and emotions.
Ruleva found that YouTube content provides more useful data for sentiment research than Twitter. The author relied on genre analysis and a mixture of linguistic and semiotic analysis. That is, she analyzed the text itself and how it is presented. The author believes that YouTube and Twitter users often belong to different social groups, and therefore may have different patterns of expression of emotions. Although the study as a whole is indirectly related to the emotional aspects of the text, Ruleva was one of the first to investigate the differences between different types of Russian-language information. However, there is no detailed description of the sentiment comparison method and data collection procedure in YouTube. To search for data on Twitter, basic filtering was applied, which ignored a huge part of messages,which lacked the hashtag "meteorite". Moreover, without using the Historical API, the Twitter search tool only gives partial access to all publicly available messages.
Kirilenko and Stepchenkova conducted a comparative study of the Russian-language and English-language discourse on Twitter about the 2014 Olympic Games in Sochi [90]. Over 400,000 messages were collected via the Twitter API over a six-month period spanning the Olympic Games [120] and then subjected to cluster and sentiment analysis for the competition. The authors evaluated the approaches of Deeply Moving [121], Pattern, and SentiStrength [22] on a hand-labeled set of 600 English and 3000 Russian Twitter posts. Despite the increase in the expression of positive attitude towards the Olympics during the game, this improvement was significant only for the messages of the Russians. However, the authors did not provide classification metrics for the evaluated models, nor did they describe the preprocessing step.
The team led by Spicer studied the wave of mass protests in connection with the elections to the Duma and to the presidency of the Russian Federation in the period 2011-2012 [91]. The researchers analyzed relevant Russian-language Twitter posts from March 17, 2011 to March 12, 2012, collected through the Twitter Streaming API. The data were selected according to a list of keywords. 690,297 Russian-language messages related to politics were collected. To identify supporters and opponents of Putin, the authors used a combination of a keyword list and SentiStrength [22], and then classified the top 1,000 users by their average sentiment score and party affiliation. By comparing the manual annotations of 100 users on both sides with automatic classification, the researchers found that about 70% of the participants were classified correctly.Finally, the authors applied a qualitative research method [122] and manually coded the key extracted n-grams. One of the main findings is that the discourse on Twitter was initially strongly supported by the opposition, and later the mobilization of the opposition significantly decreased and support for Putin increased. However, this study has several disadvantages. First, the representativeness of the sample data is not clear, because the Twitter Streaming API provides only partial access to all publications. Second, the classification metrics were not measured on the target text collection, so it is difficult to verify the quality of the sentiment classification.and later, opposition mobilization declined significantly and support for Putin increased. However, this study has several disadvantages. First, the representativeness of the sample data is not clear, because the Twitter Streaming API provides only partial access to all publications. Second, the classification metrics were not measured on the target text collection, so it is difficult to check the quality of the sentiment classification.and later, opposition mobilization declined significantly and support for Putin increased. However, this study has several disadvantages. First, the representativeness of the sample data is not clear, because the Twitter Streaming API provides only partial access to all publications. Second, the classification metrics were not measured on the target text collection, so it is difficult to check the quality of the sentiment classification.
Nenko and Petrova conducted a comparative analysis of the distribution of emotions in St. Petersburg based on user comments about urban objects in Google Places and data from the open GIS system Imprecity [92]. The dataset contained 1,800 emotion markers from Imprecity and 2,450 place-referenced comments from Google Places. Two assessors marked the comments into six emotions and processed them using a naive Bayesian classifier [123]. Based on sentiment analysis and a dataset from Imprecity, the authors created a heatmap of negative and positive emotions in St. Petersburg. The general trend is the concentration of positive and negative emotions in the historical center in the south of the city, at the western end of Vasilievsky Island and in the center of Petrogradsky Island.However, the authors did not describe the preprocessing methodology and classification metrics.
Thus, when studying attitudes towards different events or places, researchers faced the same difficulties in finding representative data and exhaustively describing constraints. In addition, the main disadvantage of most studies was the lack of an assessment of the sentiment analysis model in texts on selected topics, so it is difficult to verify the quality of the classification.
1.2. Social Sentiment Index
When measuring happiness and satisfaction with life, for example, using the Subjective Well-Being (SWB) Index [124], modern psychological approaches rely on self-rating scales. These approaches have drawbacks. For example, the limited number of interviews, the high cost of interviewing respondents, and reliance on participants 'memory makes it difficult to present respondents' status in real time [125] - [127] Alternatively, researchers have tried to measure various indices of social sentiment using sentiment analysis, because a wide range of opinions is expressed in user-generated data on social media [2], [127] - [133].
In his work [93], Panchenko calculated the sentiment index in Russian-language Facebook as the average level of emotions in an array of texts. We analyzed 573 million anonymized publications and comments for the period from August 5, 2006 to November 13, 2013, provided for research by Digsolab LLC. The authors have filtered the entire set of Russian-language texts using the langid.py module [134]. The social sentiment index was calculated using a dictionary-based approach [135], [136], similar to that of Dodd [129]. The author has developed his own dictionary of emotions from 1511 terms, marked by two specialists into positive and negative classes. To assess the quality of the classification, Panchenko applied the vocabulary approach to the ROMIP 2012 dataset [15]. The author claims that on a set of film reviews he achieved the value of the macro-average F 1-point up to 0.383 and accuracy up to 0.465. To measure sentiment, the author proposed four indices: the Word Sentiment Index, the Word Emotion Index, the Text Sentiment Index and the Text Emotion Index. The first two operate with the tonality of the words, and the second two - with the tonality of the text. According to the analysis, positive content prevails over negative content. The maximum values of the indices coincide with public holidays, and the minimum values - with memorable days and national tragedies. In general, users express positive sentiments 3.8 times more than negative ones. People use fewer emotional words in posts and more in comments. The most important limitation is thatthat the author checked the quality of the classification on film reviews and applied it to general texts, so it is difficult to verify the accuracy of the result. In addition, Digsolab's internal data collection process is not described and therefore questions about representativeness are raised.
The team led by Shchekotin proposed a new method of subjective assessment of well-being, which is based on VKontakte data on user activity [68]. Taking the model of quality of life indicators developed by Gavrilova [137], the authors chose some of the indicators for monitoring in their study. Focusing on geographical and socio-economic representativeness, they selected 43 Russian regions out of 85. Then, in the selected regions, they identified the three largest cities and selected 10 VKontakte communities each, uniting residents of these cities - urban communities. Then, using a collection of data from social networks and an analytical platform of the University Consortium of Big Data Researchers, developed at Tomsk State University,the authors extracted information published by these communities for the period from January 1 to December 31, 2018. After that, they removed irrelevant data - advertising publications and texts not related to the research topic (vacancies, sports, cultural events). The filtering of irrelevant data was carried out in two stages: manual analysis of 60,000 messages and automatic cleaning, in which the algorithm was trained on manually cleaned messages. After that, about 1,700,000 publications remained. During the purge, publications were manually annotated on 19 topics and three sentiment classes (positive, negative, and neutral). In the course of preprocessing, rare words and symbols not related to the Russian and Latin alphabets were removed, and all other words were reduced to their bases (stemming). Then several machine learning algorithms were trained.The best quality of classification was shown by the gradient boosting algorithm from LightGBM [138] - up to 68% for category classification and 79% for sentiment classification. To calculate the subjective well-being index [124], [139] for each region, the authors proposed a method based on indicators of online activity. The results of the study showed that in the selected regions the topics of regional infrastructure development are most actively discussed in a positive way. The least positive activity is associated with an assessment of the general emotional state and freedom of the media. The most actively discussed in a negative way is the topic of security, that is, the assessment of the actions of the security forces and other state organizations related to ensuring security in the region.The lowest negative indicators of online activity are also characteristic of the general emotional state and freedom of the media. In addition, the authors have compiled an exhaustive list of limitations, including the representativeness of the data samples, the audience of the analyzed social networks, and the potential impact of bots.
However, when preparing the training dataset, the authors did not describe the distribution of sentiment classes. If the datasets have not been balanced, then the quality of the classification is recommended to be measured using more complex metrics, such as Precision, Model Response (Recall), and F-measure.
1.3. User behavior
Social media content can be a valuable source of information, not only about attitudes towards different topics, but also about the behavioral patterns of users when interacting with this content.
Svetlov and Platonov have identified the influence of tonality on receiving feedback from the audience [69]. The data source was 46,293 publications and 2,197,063 comments from the most popular accounts of Russian politicians on VKontakte for the period from January 2017 to April 2019. The researchers trained BiGRU [140] on the RuTweetCorp [141] and RuSentiment [142] datasets, receiving respectively macro-averaged F 1 = 0.91 and F 1= 0.77. Based on the results of sentiment analysis, the authors identified several response patterns. Posts were classified as positive if they had more views and likes from users. Posts with a large number of reposts and comments were classified as negative. However, the use of training data from one area and the application of models trained on it in another area raises many questions. RuTweetCorp is a collection of short posts from Twitter, and RuSentiment is a collection of general topics from VKontakte, with the study under discussion focused on politics. A good way out in this situation would be to manually annotate a small set of texts on the target topic and test the trained model on it.
2. Feedback on products and services

In the Internet age, product and service reviews have become a powerful tool for expressing social validation that encourages people to buy from different online stores [143]. Testimonials can be a valuable source of information not only for buyers and sellers, but also for researchers. In this chapter, literature sources are divided according to the analyzed topics: characteristics of buyers, characteristics of products and services, characteristics of merchants.
2.1. Characteristics of reviewers
A research group from St. Petersburg University analyzed the themes and tone of reviews of 989 employing companies operating in 12 knowledge-intensive Russian industries [70]. The researchers took Otrude, one of the largest Russian portals with employer reviews, as the main source of data. After filtering and removing unnecessary data, we got a set of 6145 reviews. The preprocessing took place in several stages: lemmatization using MyStem, removal of punctuation and stop words. The authors automatically classified the texts into two categories based on the rating of reviews: those who received at least three stars were considered positive, the rest were considered negative. The researchers then analyzed sentiment using latent Dirichlet placement [102] - or topic modeling - and an unspecified classification model.The team led by Sokolov found out that six main factors affect job satisfaction: the order and schedule of work, working conditions, the nature of the work, salary, career development, psychological climate, interpersonal relationships with colleagues. The last two factors - mental environment and interpersonal relationships - are most often discussed by people online when discussing job satisfaction. Therefore, the authors suggested that when a person decides to quit, he tends to put up with economic factors (for example, with the prospects for career development and salary increases), and not with socio-emotional factors (for example, with a bad nature of work, poor relationships with colleagues). The key problem of the research is the correctness of using sentiment analysis. All reviews on the Otrude website contain the author's assessment,therefore, from a formal point of view, sentiment classification is not needed to evaluate these reviews. Another drawback is that the authors did not describe their approach to the analysis and the results of sentiment classification on the test dataset.
2.2.
The team led by Seliverstov, based on data from the Autostrada portal, assessed the attitude to the state of the roads in the Northwestern Federal District of the Russian Federation [71]. For training, the authors used RuTweetCorp [141], the largest auto-annotated set of texts with little manual filtering, collected on Russian-language Twitter. For classification purposes, a regularized linear stochastic gradient descent model and a Bag of Words model with TF-IDF vectorization were taken. After training, the model demonstrated a binary classification accuracy of 72%. After analyzing the reviews for the period from March 1, 2009 to November 1, 2018, the authors found that the length of all positively assessed roads was 9874 km (75% of the total length), and the length of negatively assessed roads was 3385 km (25%).However, this study has several disadvantages. Firstly, the authors do not describe the preprocessing process, which is critical when learning on RuTweetCorp. The fact is that this set was originally designed to create a lexicon of emotions, and not for a direct classification of sentiment. The set was assembled automatically in accordance with a certain strategy [144], that is, each text is associated with some class of emotions, depending on the emoticons it contains. So even a simple rule-based approach can deliver outstanding results. For example, if the model classifies the text as positive due to the presence of a character in it (or as negative due to the absence of this character, then in binary classification we get Fwhich is critical when learning on RuTweetCorp. The fact is that this set was originally designed to create a lexicon of emotions, and not for a direct classification of sentiment. The set was assembled automatically in accordance with a certain strategy [144], that is, each text is associated with some class of emotions depending on the emoticons contained in it. So even a simple rule-based approach can deliver outstanding results. For example, if the model classifies the text as positive due to the presence of a character in it (or as negative due to the absence of this character, then in binary classification we get Fwhich is critical when learning on RuTweetCorp. The fact is that this set was originally designed to create a lexicon of emotions, and not for a direct classification of sentiment. The set was assembled automatically in accordance with a certain strategy [144], that is, each text is associated with some class of emotions depending on the emoticons contained in it. So even a simple rule-based approach can deliver outstanding results. For example, if the model classifies the text as positive due to the presence of a character in it (or as negative due to the absence of this character, then in binary classification we get Fthat is, each text is associated with some class of emotions depending on the emoticons it contains. So even a simple rule-based approach can deliver outstanding results. For example, if the model classifies the text as positive due to the presence of a character in it (or as negative due to the absence of this character, then in binary classification we get Fthat is, each text is associated with some class of emotions depending on the emoticons it contains. So even a simple rule-based approach can deliver outstanding results. For example, if the model classifies the text as positive due to the presence of a character in it (or as negative due to the absence of this character, then in binary classification we get F1 = 97.39%. To solve the problems of automatic sentiment analysis, the authors of the dataset recommend deleting emoticons during preprocessing. According to [145], in this case, using the support vector machine [33], it is possible to achieve a macro-averaged score F 1= 75.95%. So without knowledge of the preprocessing process, it is difficult to assess the correctness of the study. Second, there are many questions about the effectiveness of using data from one area for learning in another area. In this case, it would be possible to manually annotate a small dataset on the topic of interest (user views from the transport portal) and test the trained model on it. Third, RuTweetCorp consists of three classes, but the authors did not take into account the neutral class in their study. Positive and negative messages were posted on the official website of RuTweetCorp, and neutral messages were posted on a separate website. I guess this is why some studies [146] - [150] have only used positive and negative messages for binary classification. It can be assumedthat class neutral can change the overall distribution of negative and positive road reviews. Finally, most of the reviews from the Freeway have copyright ratings, so from a formal point of view, sentiment classification is not needed to rate these reviews. In this case, it would be interesting to compare scores based on ratings from reviews and sentiment classification labels.
2.3
Lee and Chen of the University of Arizona developed a machine learning framework for determining the quality of products sold based on customer feedback [72]. This framework consists of three main modules: snowball sampling using keywords and relevant users, topic classification based on maximum entropy, and sentiment analysis using deep learning. One of the distinctive features of the latter module is that it first uses Google Translate to translate Russian text into English, and only then classifies sentiment using a recursive neural tensor network with words represented as a bank of syntax trees [121]. The proposed framework was tested on a Russian-language forum dedicated to bank card fraud.As a result, the main sellers of malware and the thieves of bank card data were identified. Through more detailed analysis, the authors found that card merchants tend to have lower ratings than software merchants. The authors believe the reason is that the quality of the software is easier to determine than the quality of the stolen data. The authors mentioned that the sentiment classifier was trained from online surveys, which is appropriate for their topic of interest, but they did not describe the details of the use of the dataset and the classification quality metrics. Translation into another language can significantly change the meaning or tonality of the text, therefore, without testing on Russian-language texts, it is almost impossible to assess the quality of the analysis.that card merchants usually have a lower rating than software merchants. The authors believe the reason is that the quality of the software is easier to determine than the quality of the stolen data. The authors mentioned that the sentiment classifier was trained from online surveys, which is appropriate for their topic of interest, but they did not describe the details of the use of the dataset and the classification quality metrics. Translation into another language can significantly change the meaning or tone of the text, therefore, it is almost impossible to assess the quality of the analysis without testing on Russian-language texts.that card merchants usually have a lower rating than software merchants. The authors believe the reason is that the quality of the software is easier to determine than the quality of the stolen data. The authors mentioned that the sentiment classifier was trained from online surveys, which is appropriate for their topic of interest, but they did not describe the details of the use of the dataset and the classification quality metrics. Translation into another language can significantly change the meaning or tonality of the text, therefore, without testing on Russian-language texts, it is almost impossible to assess the quality of the analysis.however, they did not provide details on the use of the dataset and classification quality metrics. Translation into another language can significantly change the meaning or tone of the text, therefore, it is almost impossible to assess the quality of the analysis without testing on Russian-language texts.however, they did not provide details on the use of the dataset and classification quality metrics. Translation into another language can significantly change the meaning or tone of the text, therefore, it is almost impossible to assess the quality of the analysis without testing on Russian-language texts.
3.

User-generated reviews and social media content are usually subjective because authors are free to express their opinions. However, the situation is different with news analysis. News agencies try to avoid judgment and outright bias, trying to get rid of doubts and ambiguity. Their philosophy is based on objectivity, or at least broadly acceptable neutrality [73]. Therefore, journalists often refrain from using negative or positive vocabulary, but resort to other ways of expressing their opinion [74]. For example, journalists can emphasize some facts and omit others, insert statements into the complex structure of discourse, and indicate a quote that suits their point of view. The widespread interest of people in news was noticed centuries ago [151], [152].News is used as a data source for sentiment analysis in various fields. For example, to assess the sentiment of the news themselves [153], [154], to predict stock prices [155], [156], election results [157], [158], prices for goods in online stores [159] and future customer behavior [154]. With regard to Russian-language news, I have identified two categories of research: news sentiment assessment and economic and business forecasting.news sentiment assessment and economic and business forecasting.news sentiment assessment and economic and business forecasting.
3.1. News content
Belyakov devoted several articles [94], [95] to an analysis of the tone of news reports from the Russian Foreign Ministry website. The author used articles from the "News" section published from February 1 to February 28, 2015. Text units were assigned to the following categories:
- Ukrainian question;
- Cooperation between Russia and China;
- Relations between Russia and Ukraine;
- The conflict in Syria;
- Cooperation with Turkmenistan;
- Relations between Russia and Greece;
- Sanctions against Russia;
- Diplomacy Today.
The author has created a basic rule-based classifier that summarizes the polarity of emotional words in the text and predicts the final binary class. Additionally, a dictionary of 300 positive and 300 negative word stems was compiled. According to the results of the analysis, the categories “Cooperation between Russia and China”, “Cooperation with Turkmenistan”, “Relations between Russia and Greece”, and “Diplomacy Today” had a positive color. The categories “Ukrainian question”, “Relations between Russia and Ukraine” and “Sanctions against Russia” had a negative color. It is important that the study examined only the content of articles written by journalists, that is, this is an expression of the official position of the Ministry of Foreign Affairs on certain topics. In the future, you can add reader reactions and comments to news articles published on the site. In terms of sentiment analysis,the main drawback of Belyakov's research is the lack of model evaluation. Without knowing the quality metrics on test data, we cannot evaluate the performance of the model, and hence the quality of the analysis results.
A research group from the Russian Academy of Sciences studied attitudes towards technologies and innovations mentioned in the media [96]. With the help of Exactus Expert [160], the authors selected from 16 sources more than 240,000 articles on innovation and technology published from 2005 to 2015. Then, based on manually selected keywords, they categorized articles according to 11 technology trends from the List of Critical Technologies of the Russian Federation. Next, the authors selected 120 articles and manually annotated each sentiment object mentioned in the article as positive or negative. Based on a training set of 346 annotated pairs, the researchers created a vocabulary of emotions and developed a rule-based classification algorithm. It was found that, in general, the media tend to write about technology in a neutral manner, which may be due to the consistency of the style of news reports.The relatively low share of negative references to IT and biotechnology and their overall positive coverage in the articles suggests that society is not worried about the potential negative consequences of these technologies. At the same time, the share of negative reviews about military technologies is higher than in other areas. However, the authors do not describe the classification metrics in the developed algorithm. Moreover, as already mentioned, these articles were written by journalists who could express not only the public, but also the official point of view. In order to assess public attitudes towards various topics, it is necessary to further investigate people's reactions to news articles.the share of negative reviews about military technologies is higher than in other areas. However, the authors do not describe the classification metrics in the developed algorithm. Moreover, as already mentioned, these articles were written by journalists who could express not only the public, but also the official point of view. In order to assess public attitudes towards various topics, it is necessary to further investigate people's reactions to news articles.the share of negative reviews about military technologies is higher than in other areas. However, the authors do not describe the classification metrics in the developed algorithm. Moreover, as already mentioned, these articles were written by journalists who could express not only the public, but also the official point of view. In order to assess public attitudes towards various topics, it is necessary to further investigate people's reactions to news articles.
Kazun and Kazun [75] analyzed Russian media coverage of Trump's activities during and after the election. The authors used the Integrum database for network analysis and the Medialogy database for sentiment analysis. For the study, three time intervals were taken: one month before the elections, one month after, and 7 months after. Using the Medialogy approach, the texts were divided into three classes: positive, negative and neutral. It turned out that media coverage of Trump's activities before the election was more negative than positive. In some months, however, coverage of the Clinton campaign was even more positive than coverage of Trump, although in the four months before the election, Clinton-related articles were largely critical. One of the disadvantages of the study isthat the authors did not describe the quality of the data classification on the topic of interest, so it is difficult to verify the accuracy of the results.
Similar studies were devoted to the analysis of news related to politics and government. Unlike the content on social media, there was no difficulty in accessing old data, because the media usually does not prevent it. However, some news research authors have attempted to determine public opinion on specific topics that, in my opinion, warrant further elaboration. The media can, of course, be considered a reflection of public opinion, however, in some cases, publishers' policies can influence delivery, so news does not always reflect public opinion.
3.2. Economic and business forecasts
Yakovleva proposed calculating a high-frequency indicator of economic activity in Russia based on news articles in combination with an analysis of the sentiment of the texts [76]. During the study, two components were created: the first is designed to reflect the number of topics, and the second is to identify the tone of the news. The preprocessing consisted of several stages: stemming with MyStem, removing punctuation, stop words and unnecessary spaces. As a sentiment classification model, Yakovleva took a support vector algorithm [33] and trained it on manually annotated data containing 3438 positive and negative news articles. The accuracy on the test set was 64%. The author mentioned that if the model determined the tonality of the text with a probability of less than 60%, then the tonality was considered neutral and the text was excluded from the analysis. All topics,obtained with the first component were combined with the sentiment information from the second model. Based on this combined data, a regression model was developed to predict Purchasing Managers' Indexes (PMI). The test data covered the period from February 2017 to August 2018. The model showed relatively good forecasting capabilities, accurately approximating the actual index for the new period. The research results show that the model can closely track economic performance, helping to respond more quickly to the current financial situation and make quick decisions. However, this study has several disadvantages. First, it is not clear what probabilities were used,because the basic support vector machine implementation does not provide probability estimates directly. Moreover, the methodology for selecting thresholds has not been described. Secondly, Yakovleva's training data was annotated by only one specialist, which does not correspond to generally accepted practice [142], [161], [162]. Finally, the author published a graphical representation of the predicted comparison and actual PMI values, but did not mention any regression quality metrics.but did not mention any regression quality metrics.but did not mention any regression quality metrics.
4. Books

Over the past 60 years, the analysis of scientific literature has come a long way, from manual citation counting and word frequency analysis to modern methods of automatic deep text analysis [163]. One of the topical topics in this area is the analysis of the sentiment of educational materials.
4.1. Contents of books
Soloviev's research group studied the tonality of textbooks on social studies and history that are used in Russian elementary and secondary schools [77]. For this study, the Academic Corpus of the Russian Language was compiled on the basis of 14 Russian-language textbooks edited by Bogolyubov and Nikitin. Pre-processing included sentence tokenization, word tokenization, and part-of-speech markup using TreeTagger [164]. Using the Russian-language dictionary RuSentiLex [25], the authors calculated the frequency of emotional words in each document and measured their specific number per 1000 words in the document. After analyzing the corpus, the authors found out that the discourse in history textbooks for high school, as well as in social studies textbooks for middle high school, written by Nikitin, is mainly presented in a negative tone:negatively polarized words are used and negative examples are presented. And the textbooks written by Bogolyubov have a generally positive tone. However, a significant source of unreliability is the accuracy and relevance of the emotional words extracted from the corpus, since RuSentiLex was originally created for other topics. In addition, RuSentiLex provides a single context-independent representation of emotional polarity, regardless of where the word occurs in the sentence and regardless of its possible meanings. Therefore, this approach does not allow you to understand the different meanings of words based on the context of the sentence.a significant source of unreliability is the accuracy and relevance of the emotional words extracted from the corpus, since RuSentiLex was originally created for other topics. In addition, RuSentiLex provides a single context-independent representation of emotional polarity, regardless of where the word occurs in the sentence and regardless of its possible meanings. Therefore, this approach does not allow you to understand the different meanings of words based on the context of the sentence.a significant source of unreliability is the accuracy and relevance of the emotional words extracted from the corpus, since RuSentiLex was originally created for other topics. In addition, RuSentiLex provides a single context-independent representation of emotional polarity, regardless of where the word occurs in the sentence and regardless of its possible meanings. Therefore, this approach does not allow you to understand the different meanings of words based on the context of the sentence.Therefore, this approach does not allow you to understand the different meanings of words based on the context of the sentence.Therefore, this approach does not allow you to understand the different meanings of words based on the context of the sentence.
4.2. Educational process
Kolmogorova conducted an experiment on teaching Russian for Chinese students [78]. She measured the relationship between the sentiment of educational texts, the subjective assessment by foreign students of the attractiveness and effectiveness of the training course, as well as the actual success of teaching on such texts. To analyze sentiment, the author used a machine learning-based emotion classifier developed at the Laboratory for Applied Linguistics and Cognitive Research, Siberian Federal University. Sentiment analysis model classified texts into 9 classes with macro-average F 1-point 50%. Eight grades correspond to the basic emotions of L¨ovheim [165], and the last one is emotionally neutral texts. For the training set, the texts were selected in the open `` Overheard '' VKontakte group. 231 Russian native speakers marked up the texts, subjectively assessing the degree of expression of any emotion, while each text was assigned only one emotion. All texts were marked up by at least three assessors. If two or three assessors assigned the same class to the text, then this emotion was assigned to the text. Otherwise, the text was removed from the training set for this class. Kolmogorova used texts for which the leading emotions were pleasure / joy and sadness / melancholy. The experiment was carried out with the participation of 30 students from China, who were divided into three equal groups.Each group studied and examined the topic "Punctuation". One group learned from joyful texts, the second from sad ones, and the third from neutral ones. After completing the experimental study and examinations, students filled out a questionnaire in which they noted the degree of general interest in the course and its effectiveness, as well as the degree of their satisfaction with the learning process. After analyzing the questionnaires and exam results, Kolmogorova found out that the tonality of the educational text strongly affects the subjective assessment of the educational process and its objective effectiveness. On average, students made fewer mistakes on sad texts than on joyful and neutral ones, but working with them brought the least satisfaction. The greatest interest was aroused by the work with joyful texts, but at the same time the effectiveness of the training was lower.A significant source of uncertainty in this study is the method used to classify the emotional polarity of texts. The model was trained on texts from one area, and applied to texts from another without additional verification of the classification quality. The author did not describe any details regarding the classification model, nor did she provide more information on preprocessing and training.
Thus, the main difficulty in the analysis of textbooks lies in the absence of emotional vocabulary and training kits on this topic. When researchers analyzed texts at the word level using emotional vocabularies, usually one context-independent representation of emotional polarity was taken for each word, regardless of the location of the word in the sentence and regardless of its other possible meanings. Moreover, for the analysis of texts at the document level, it becomes difficult to associate texts with classes of emotions, because the texts in textbooks are long, and different emotions can be expressed throughout one text.
5. Mixed data sources

To cover a wider range of materials, some studies use texts from different sources. For example, if authors use news and social media content, they can not only gauge the polarity of coverage of certain events by news agencies and government agencies, but they can also gauge people's attitudes towards different topics discussed.
In a paper published in the Berkman Center for Internet & Society [97], Etling explored the tone of discussion of Ukrainian protests during the Euromaidan period in various Russian and English-language online and traditional media, as well as social networks. The study used the Crimson Hexagon software [166], which is based on the analysis method developed by Hopkins and King [167]. The texts were classified into four classes in terms of attitudes towards protests: positive, neutral, negative and non-related. The data source was Russian-language and English-language publications on Twitter, Facebook, blogs, forums and news sites for the period from November 21, 2013 to February 26, 2014. Due to Crimson Hexagon restrictions, texts in Ukrainian were not considered. It revealed,that Russian-language sources and users expressed more support for the protests than expected. English-language texts in the US and UK were more negative than expected based on the ideological support of Western governments. At the same time, the content of social media in the UK, USA and Ukraine was more positive compared to the traditional media in these countries. The main drawback of the study is related to the sentiment classification model. First, she trained on the minimum amount of data, that is, on about 120-140 marked-up publications. Second, the training data was annotated by only one assessor, which contradicts the best practices [142], [161], [162]. The reliability and quality of the classification has not been tested, which contradicts the basic principles of supervised machine learning models [168]. Furthermore,a complete list of analyzed sources is not provided, so it is difficult to validate the reliability of their selection. Moreover, Ukrainian texts were not considered, thereby excluding a wide range of opinions.
Kazun analyzed the intensity and tone of coverage in the media and social networks of Alexei Navalny's activities based on data for 2014-2016 [80]. With the help of Medialogia, the author received more than 145,000 news articles about Navalny from Russian newspapers, websites and the three largest federal TV channels. To analyze the sentiment, Kazun used the algorithms developed in Medialogy (classification into positive, negative or neutral classes), having previously checked them on two hundred manually marked articles. It turned out that traditional media tend to ignore Navalny except for occasional publication of documents or news stories in order to denigrate the Russian opposition in general or Navalny personally. On the whole, Navalny got more positive coverage in blogs than in other media. However, the discussions in these articles were predominantly critical.The authors also described the characteristics of each type of media, clarifying the characteristic publishing strategies and sentiment patterns. Despite the general negativity, news coverage of Navalny's activities is becoming more positive from year to year. The reasons for this trend are a decrease in the number of critical articles and an increase in the number of positive articles. As in all the discovered examples of using the medialogy sentiment analysis algorithms, the authors do not describe classification metrics for the target topic.As in all the discovered examples of using the medialogy sentiment analysis algorithms, the authors do not describe classification metrics for the target topic.As in all the discovered examples of using the medialogy sentiment analysis algorithms, the authors do not describe classification metrics for the target topic.
In his research [79] Brantley analyzed the Ukrainian revolution of 2013-2014 based on the content of Twitter, Facebook, YouTube, blogs, forums and news sites. With the help of the Crimson Hexagon platform, he has assembled a collection of 2,809,476 texts in Russian, Ukrainian and English. We considered only texts that were published from Ukraine in the period from November 21, 2013 to March 1, 2014. Two assessors, fluent in all three languages, annotated the training dataset for the BrightView algorithm, which is part of Crimson Hexagon and is a nonparametric data analysis algorithm. described in [166]. The texts were divided into three categories: positive, neutral and negative. Testing on the Crimson Hexagon showed a 92% match with manual grading.Together with the collected data, the author used information from the Tone Dataset Global Knowledge Graph and Events Dataset and Global Events Language datasets [169]. It turned out that in Ukraine there was a pronounced discrepancy between political associations and preferences associated with linguistic characteristics. This is further confirmed by past voting results, when Ukrainian-speaking speakers have traditionally expressed more support for the opposition. By comparing online and offline involvement directly, Brantley concluded that social media had a significant impact on the physical development of protests, that is, led to an increase in the number of protesters on the streets.that in Ukraine there were pronounced discrepancies between political associations and preferences associated with linguistic characteristics. This is further confirmed by past voting results, when Ukrainian-speaking speakers have traditionally expressed more support for the opposition. By comparing online and offline involvement directly, Brantley concluded that social media had a significant impact on the physical development of protests, that is, led to an increase in the number of protesters on the streets.that in Ukraine there were pronounced discrepancies between political associations and preferences associated with linguistic characteristics. This is further confirmed by past voting results, when Ukrainian-speaking speakers have traditionally expressed more support for the opposition. By comparing online and offline involvement directly, Brantley concluded that social media significantly influenced the physical development of protests, that is, led to an increase in the number of protesters on the streets.that social media significantly influenced the physical development of protests, that is, led to an increase in the number of protesters on the streets.that social networks significantly influenced the physical development of protests, that is, led to an increase in the number of protesters on the streets.
The main disadvantage of using sources of different types is that, in addition to the wide range of opinions expressed, authors face the difficulties and limitations that are typical for certain types of sources. They can be related to access to representative data, exhaustive description of limitations, lack of training data for the selected topic. In some studies, sentiment analysis and aggregation of emotion indices were performed on the basis of a wide range of texts without differentiation by type of source. For example, when aggregating emotions, authors considered social media publications and news articles to be equal. Perhaps, in such cases it is more logical to use more complex models that use weights in order to more correctly analyze texts from different types of sources.
6. Next
In a couple of days, the final part will be released, in which we will talk about the common difficulties faced by the researchers, as well as promising directions for the future. If you want to read the entire article at once and in English, go here .
7. Sources
A complete list of sources can be found here .