The dynamics of the atmosphere of our planet is so complex that even modern meteorological algorithms cannot always figure it out and give correct predictions.
But this did not frighten the French scientist Pierre-Simon, the Marquis de Laplace , who in the 18th century was able to predict one simple but important feature of the behavior of the Earth's atmosphere. Although Laplace had never seen a global weather map in his life, he developed a theory that predicted that waves with pressure drops are constantly rushing across our planet.
“Until the late 20th century, atmospheric modeling was done in pencil on paper and was pretty crude, but Laplace did it,” says David Randall), an atmospheric science scientist at Colorado State University. “It's incredible.”
Laplace's ideas sparked a century-long hunt for these waves. But the oscillations turned out to be not only huge, but also very weak. Even the best physicists have failed to detect them.
And now this quest has come to an end. In a new set of meteorological data, modern scientists have discovered what millions of barometers have missed: a “symphony” of waves that envelop the entire Earth in a patchwork quilt of weak and strong pressure zones.
Here is such an excellent confirmation of the old theory. But let's talk about everything in order.
Strings of the planet
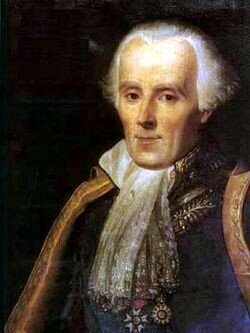
Laplace in the uniform of the Chancellor of the Senate. Fragment of a portrait by Jean-Baptiste Guerin, 1838
It all began with the fact that Laplace became interested in the influence of the moon's gravity on the Earth's atmosphere. He decided to analyze what types of waves are generated as a result of this interaction.
Laplace imagined the atmosphere as a thin layer of liquid on a smooth sphere. He came to the conclusion that gravity should press the waves to the ground, where they will move more or less in a horizontal plane - like two-dimensional (surface) waves.
"He was the first who came up with this illustration - Kevin Hamilton explains ( by Kevin Hamilton ), Professor Emeritus of the University of Hawaii at Manoa, co-author of the new study. "That was a terrific guess."
Laplace did not give these waves a special name and did not work out their movement in more detail, but modern scientists in the field of atmospheric sciences call them "normal vibrations" (or modes, normal modes).
The simplest mod raises the pressure in one hemisphere and lowers it in the other. More energetic mods create a checkerboard pattern from small areas of low and high pressure.
They move around the planet - usually from west to east or from east to west - faster than most passenger planes.

(T. Sakazaki and K. Hamilton, doi: 10.1175 / JAS-D-20–0053.1) - High pressure areas are red, low pressure areas are blue. The four graphs illustrate four different wave modes.
Although Laplace began his reasoning from the Moon, in fact, these pressure waves appear due to storms, thunderstorms and storms of the Earth itself.
Wind blows over mountain ranges, turbulence increases, and some of this energy is spent on feeding normal vibrations. “It's like a kitten playing the piano keys,” explains Randall. “By accidentally pressing it, you can tell what strings this piano has.”
So, Laplace proposed the idea of the existence of such waves, mathematicians gave physicists all the necessary tools to calculate the “strings” of the atmosphere. But did anyone hear these “notes”?
Search for sound
At about the same time that Laplace was thinking about his model, researchers and naturalists - including the German geographer Alexander von Humboldt - noticed that atmospheric pressure rises and falls every 12 hours in the tropics.
These drops coincided with the drops in heat from the sun, but theorists have failed to explain why the effect is so strong.
Scientists tried to unravel this mystery for almost a century, until in 1882 the British physicist Thomson William (Lord Kelvin) noticed that this heating was combined with one of Laplace's “free vibrations”.
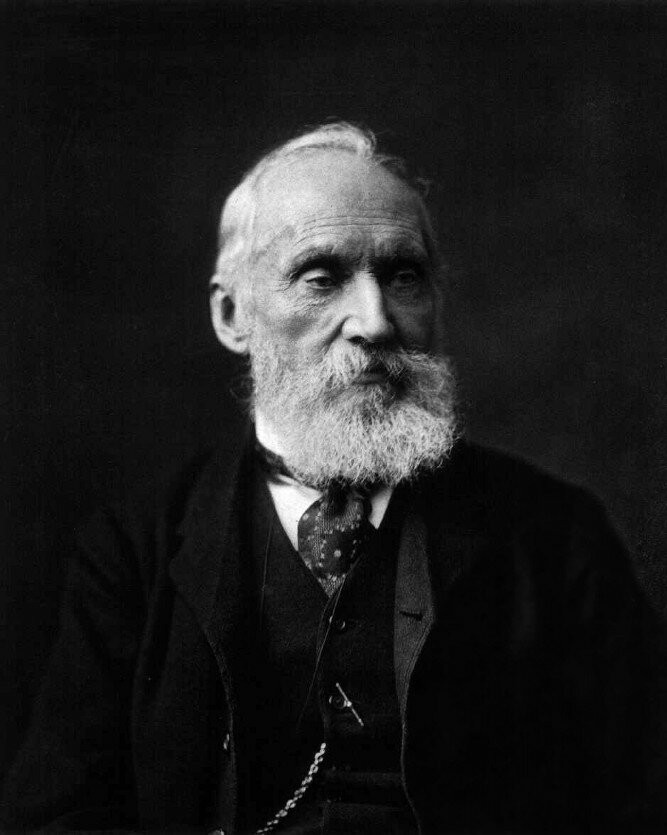
Portrait of William Thomson, Baron Kelvin, Smithsonian Libraries - Lord Kelvin
Lord Kelvin suggested that it was the Sun that gave impetus to the waves, because their frequency coincided with the frequency of one of Laplace's oscillations. His assumption turned out to be wrong - in the 1960s, scientists determined that the influence of the sun amplified another, more complex phenomenon - but Lord Kelvin's idea pushed scientists to a more thorough analysis of the mathematical component of Laplace's theory.
As a result, they figured out what frequency these normal vibrations should have.
An unexpected find
Scientists found the lowest “notes” that coincide with predictions only in the 1980s. They first appeared in the work of the Japanese meteorologist Taroh Matsuno ( DOI: 10.2151 / jmsj1965.58.4_281 ), and a little later in the work of Kevin Hamilton and Rolando Garcia ( DOI: 10.1029 / JD091iD11p11867 ).
Hamilton and Garcia's work was born out of a chance find - a perfect dataset from a weather station in colonial Indonesia that recorded atmospheric pressure every hour for 79 years, missing only a couple of readings.
The measurement diary turned out to be not only lengthy, but also incredibly accurate - the researchers measured the length of the mercury column through a microscope with an accuracy of two hundredths of a millimeter.
By comparing these measurements with other datasets, Hamilton and Garcia were able to detect traces of one of the longest normal modes.
New database
Shorter waves, however, did not yield until last year, when the European Center for Medium-Range Weather Forecasts published the ERA5 database. The database contains data from thousands of ground stations, weather balloons and satellites. The “gaps” were filled with powerful computer models.
As a result, this database reflects information that could be collected by a global network of meteorological stations located every 10 kilometers that would take readings every hour from 1979 to 2016.

Weather balloon launch. - ABC Rural: Caddie Brain
When Takatoshi Sakazaki), an assistant professor from the Japanese University of Kyoto, undertook to study the base, he was looking in it not at all Laplace waves, but temperature drops. The pressure drops were just noise for him, which needed to be eliminated.
But it soon dawned on him that these could be the same normal fluctuations. When Sakazaki matched the data with theoretical predictions, they matched almost perfectly.
Not very sure about the importance of the find, he unsubscribed to Hamilton, who was then his scientific advisor.
Prior to publishing his work in the 1980s, Hamilton spent several decades searching weather station data for the lowest atmospheric "notes." And then a letter fell into his mailbox with evidence of the existence of a complete "symphony".
Sakazaki and Hamilton have worked together to analyze the three-dimensional structure of these waves and published the results of their research in the July issue of the Journal of the Atmospheric Sciences. ( DOI: 10.1175 / JAS-D-20-0053.1 )
The work describes the behavior of dozens of waves as accurately as possible, in addition to those found in the 1980s. It turned out that some of the most energetic change their pressure from high to low 12 times in one pass over the planet.
All results were in agreement with predictions derived from Laplace's equations.
With you was the Telegram channel Science from Funscience , thank you for your attention!