Welcome to article 5 in the Check Point SandBlast Agent Management Platform Solution series. Previous articles can be found by clicking on the appropriate link: first , second , third , fourth . Today we will look at the monitoring capabilities in the Management Platform, namely, working with logs, interactive dashboards (View) and reports. We will also touch on the topic of Threat Hunting to identify current threats and anomalous events on the user's machine.
Logs
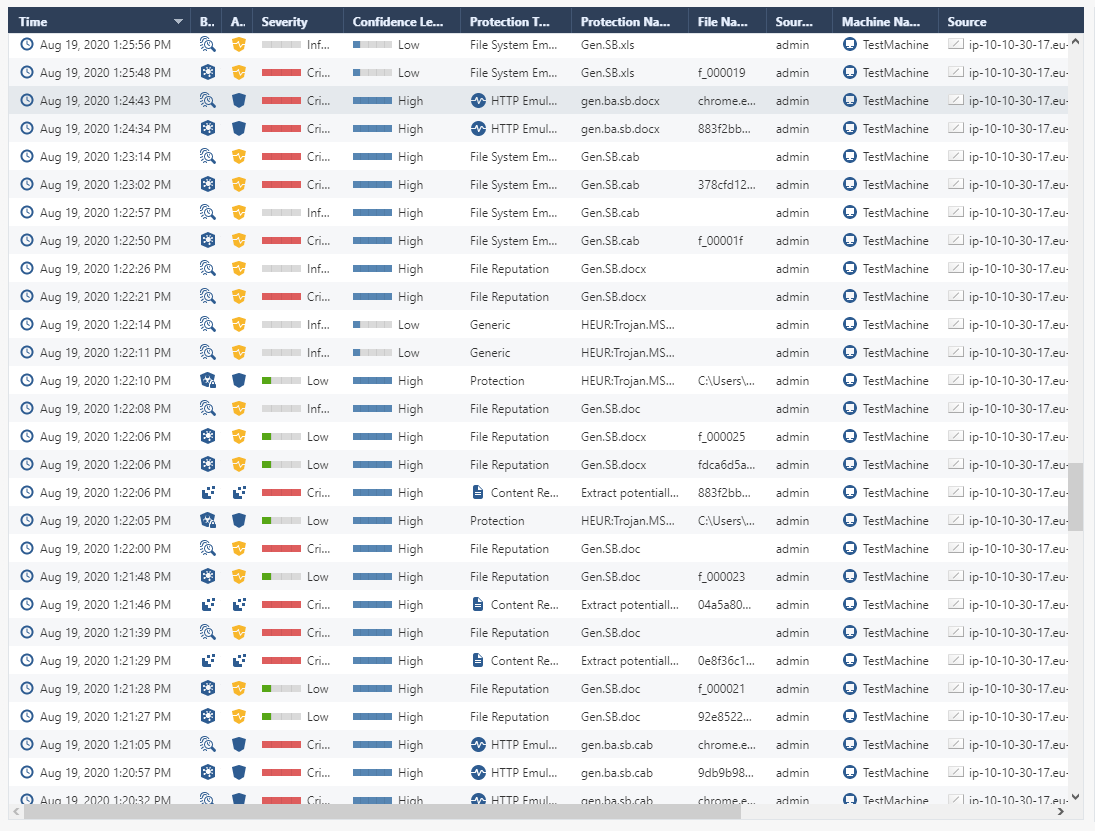
The main source of information for monitoring security events is the Logs section, which displays detailed information on each incident, and also allows you to use convenient filters to refine your search criteria. For example, when you right-click on a parameter (Blade, Action, Severity, etc.) of the log of interest, this parameter can be filtered as Filter: "Parameter" or Filter Out: "Parameter" . Also, for the Source parameter, the IP Tools option can be selected, in which you can ping to a given IP address / name, or execute an nslookup to get the source IP address by name.
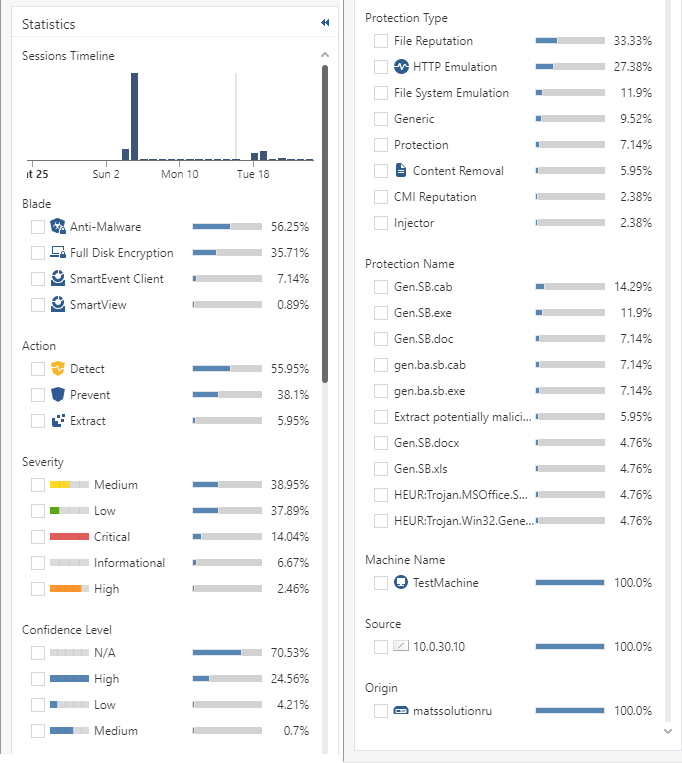
In the Logs section, for filtering events, there is a Statistics subsection, which displays statistics for all parameters: a time chart with the number of logs, as well as percentages for each of the parameters. From this subsection, you can easily filter logs without referring to the search bar and writing filtering expressions - just select the parameters of interest and a new list of logs will be displayed immediately.
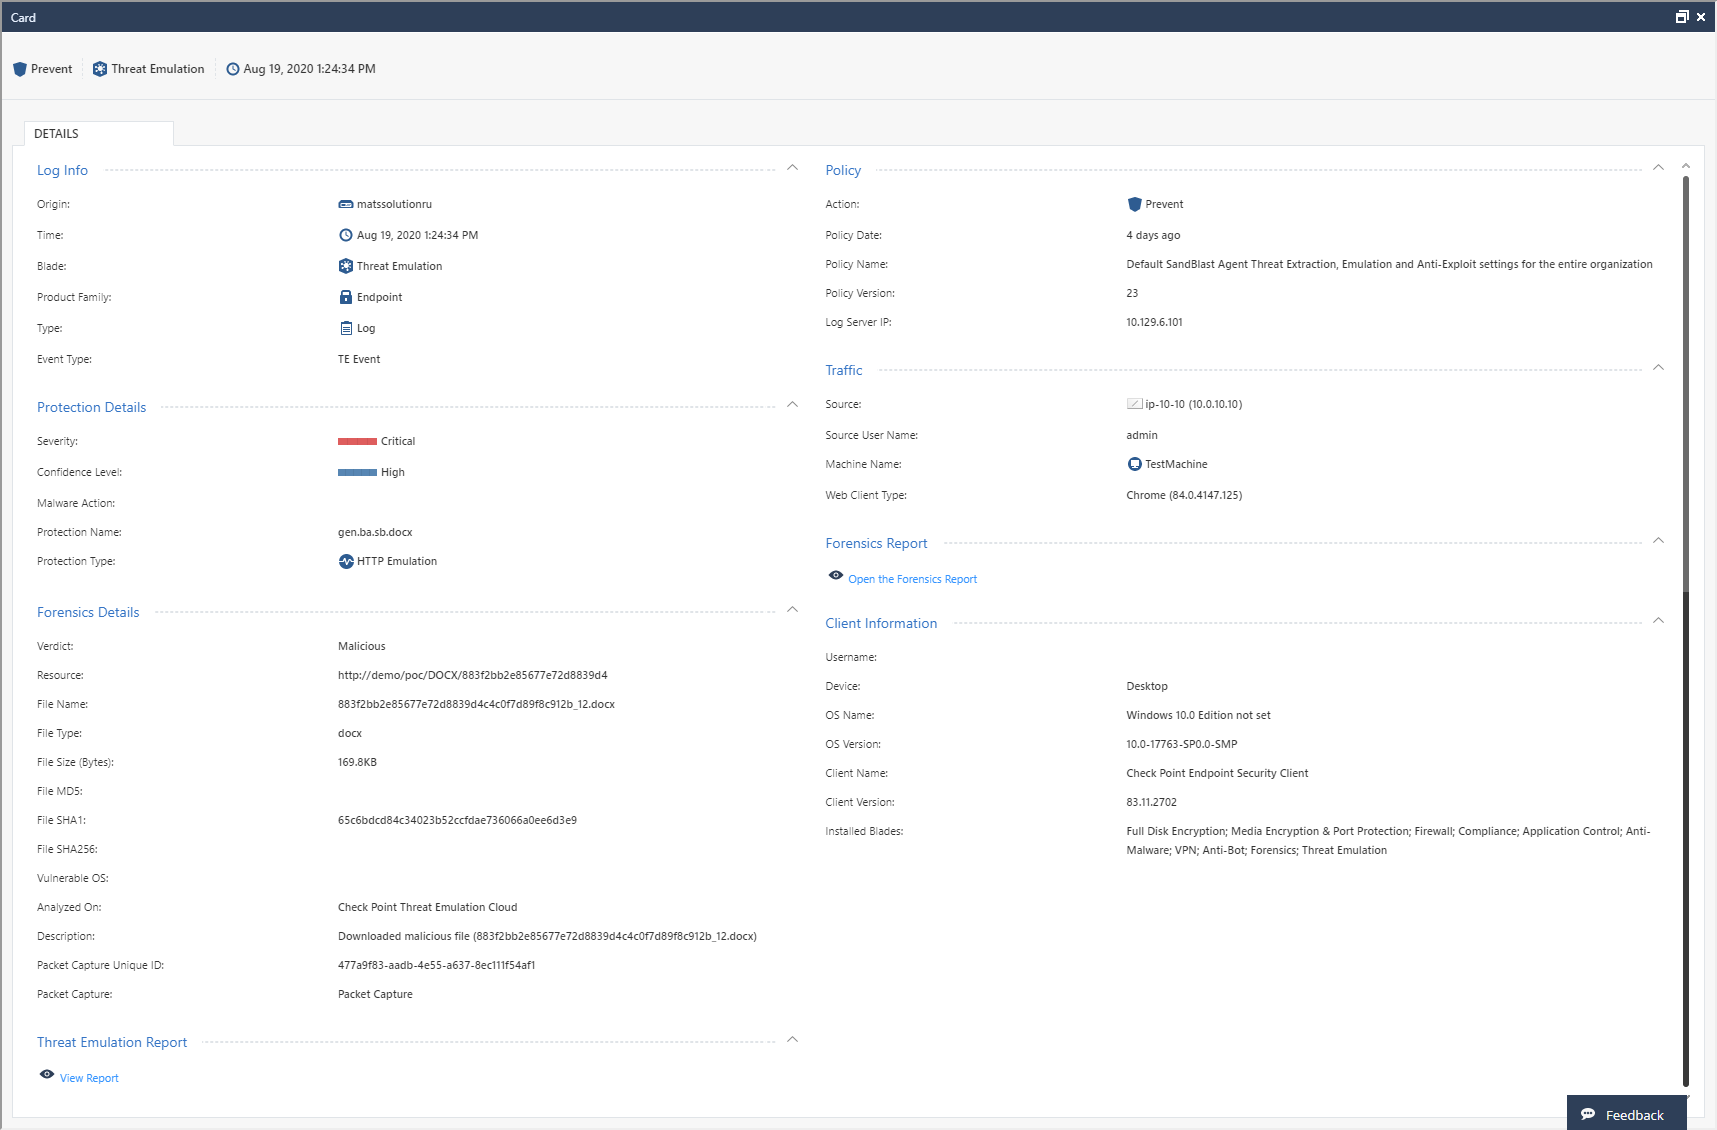
Detailed information on each log is available in the right pane of the Logs section, but it is more convenient to open the log by double-clicking to analyze the content. Below is an example of a log (the picture is clickable), which displays detailed information on triggering the Prevent action of the Threat Emulation blade on an infected ".docx" file. The log has several subsections that display the details of the security event: triggered policy and protection, forensics details, information about the client and traffic. Of particular note are the reports available from the log - Threat Emulation Report and Forensics Report. These reports can also be opened from the SandBlast Agent client.
Threat Emulation Report
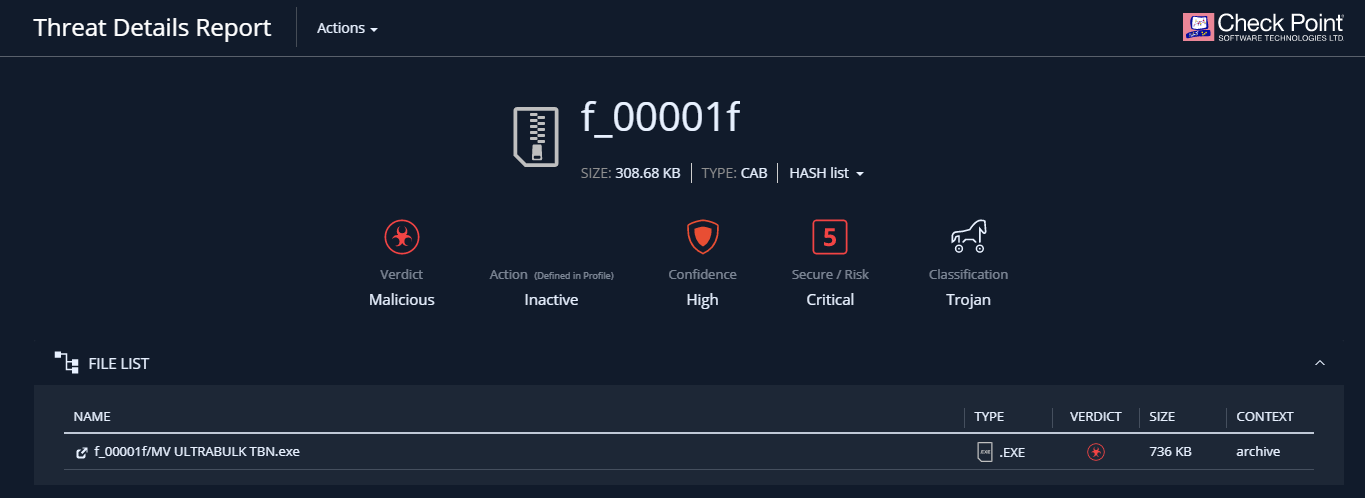
When using the Threat Emulation blade after emulation in the Check Point cloud, a link to a detailed report on the results of emulation - Threat Emulation Report appears in the corresponding log. The content of such a report is described in detail in our article on malware analysis using Check Point SandBlast Network forensics . It should be noted that this report is interactive and allows you to "go through" the details of each of the sections. It is also possible to view a record of the emulation process in a virtual machine, download the original malicious file or get its hash, and contact the Check Point Incident Response Team.
Forensics Report
For almost any security event, a Forensics Report is generated, which includes detailed information about the malicious file: its characteristics, actions, entry point to the system, and impact on important company assets. We discussed the structure of the report in detail in the article on malware analysis using Check Point SandBlast Agent forensics . Such a report is an important source of information when investigating security events, and if necessary, you can immediately send the contents of the report to the Check Point Incident Response Team.

SmartView
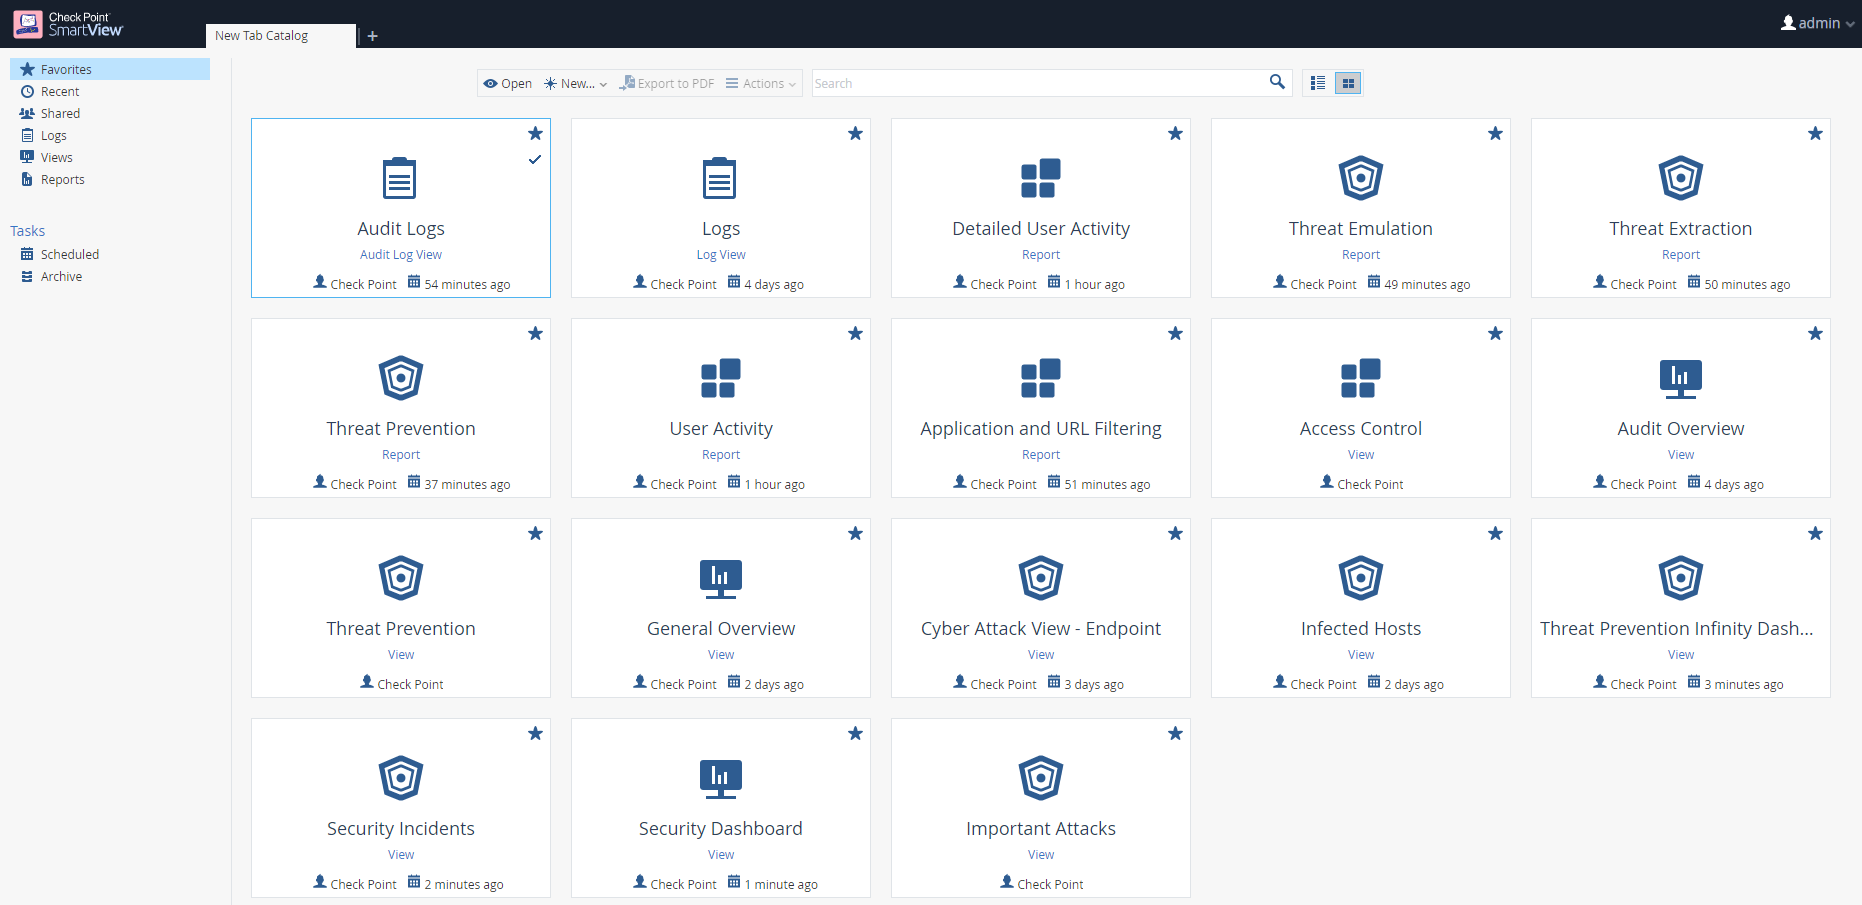
Check Point SmartView is a convenient tool for building and viewing dynamic dashboards (View) and reports in PDF format. User logs and audit events for administrators can also be viewed from SmartView. The figure below shows the most useful reports and dashboards for working with SandBlast Agent. Reports in SmartView are documents with statistical information about events for a certain period of time. Supports uploading reports in PDF format to the machine where SmartView is open, as well as regular uploading to PDF / Excel to the administrator's email. In addition, import / export of report templates, creation of your own reports and the ability to hide usernames in reports are supported. The figure below shows an example of an embedded Threat Prevention report.
Dashboards (View) in SmartView allow the administrator to access the logs for the corresponding event - just double-click on the object of interest, be it a chart column or the name of a malicious file. As with reports, you can create your own dashboards and hide user data. For dashboards, import / export of templates is also supported, regular upload to PDF / Excel to administrator's email and automatic data update to monitor security events in real time.
Additional monitoring sections
A description of the monitoring tools in the Management Platform would be incomplete without mentioning the Overview, Computer Management, Endpoint Settings, and Push Operations sections. These sections were described in detail in the second article., however, it will be useful to consider their possibilities for solving monitoring tasks. Let's start with the Overview, which consists of two subsections - Operational Overview and Security Overview, which are dashboards with information about the state of protected user machines and security events. As with interacting with any other dashboard, the Operational Overview and Security Overview subsections, when double-clicking on the parameter of interest, allow you to go to the Computer Management section with the selected filter (for example, "Desktops" or "Pre-Boot Status: Enabled"), or to the section Logs for a specific event. The Security Overview subsection is a Cyber Attack View - Endpoint dashboard that you can customize and set up automatic data updates.

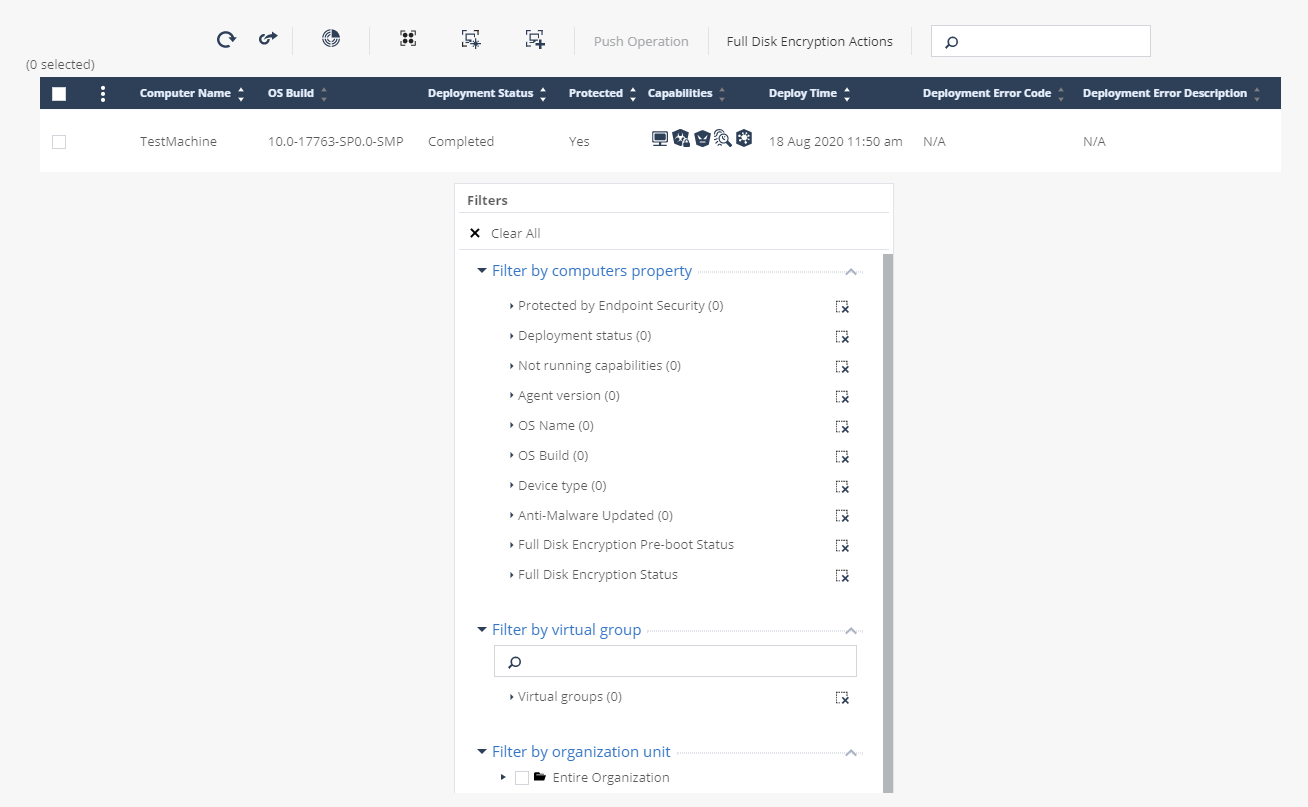
From the Computer Management section, you can monitor the status of the agent on user machines, the status of the Anti-Malware database update, disk encryption steps, and much more. All data is automatically updated and the percentage of eligible user machines is displayed for each filter. Export of computer data in CSV format is also supported. An important aspect of monitoring the security of workstations is setting up notifications about critical events (Alerts) and exporting logs (Export Events) for storage on the company's log server. Both settings are done in the Endpoint Settings section, and for Alerts
it is possible to connect a mail server to send notifications about events to the administrator and configure threshold values for triggering / disabling notifications depending on the percentage / number of devices that match the event criteria. Export Events allows you to configure the forwarding of logs from the Management Platform to the company's log server for further processing. Supported formats are SYSLOG, CEF, LEEF, SPLUNK, TCP / UDP protocols, any SIEM systems with a running syslog agent, using TLS / SSL encryption and syslog client authentication.
For in-depth analysis of events on the agent or in case of contacting technical support, you can quickly collect logs from the SandBlast Agent client using a forced operation in the Push Operations section. You can configure the forwarding of the generated archive with logs to Check Point servers or to corporate servers; the archive with logs is also saved on the user's machine in the C: \ Users \ username \ CPInfo directory. Supports starting the process of collecting logs at a specified time and the ability to postpone the operation by the user.
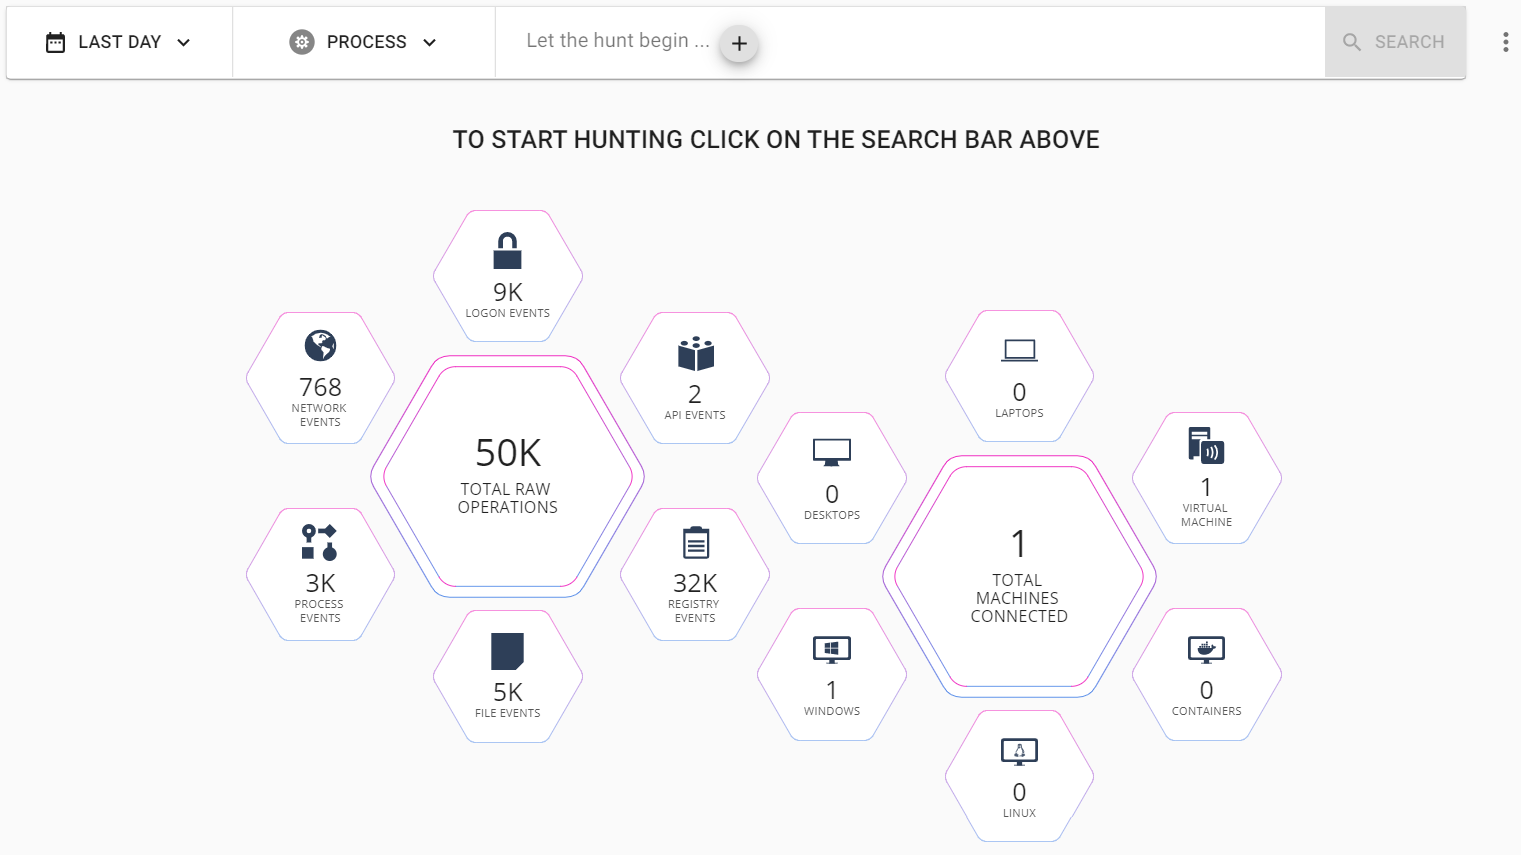
Threat Hunting
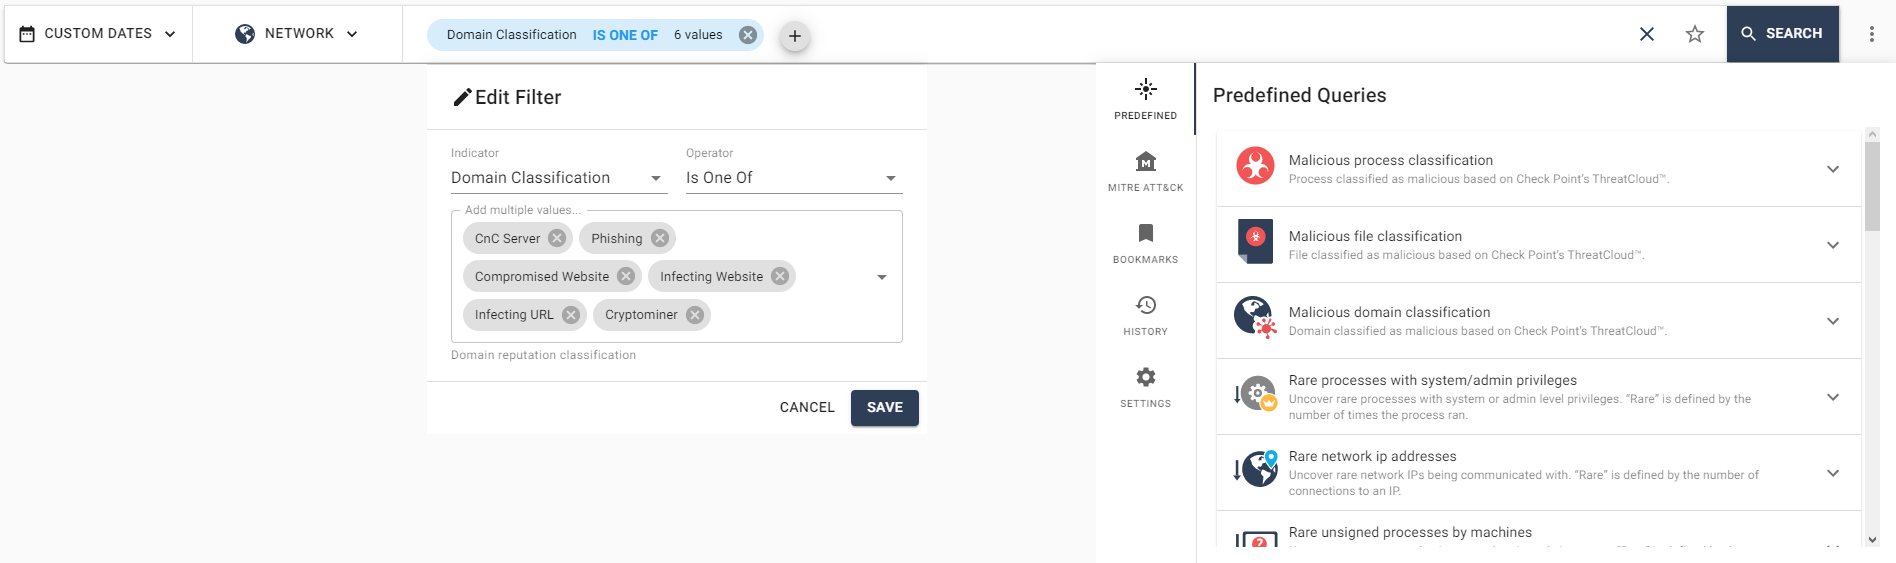
The Threat Hunting method is used to proactively search for malicious activity and anomalous behavior in the system to further investigate a potential security event. The Threat Hunting section of the Management Platform allows you to search for events with specified parameters in the data of a user machine. The Threat Hunting tool has several predefined queries, for example: for classifying malicious domains or files, tracking rare calls to certain IP addresses (relative to general statistics). The request structure consists of three parameters: indicator (network protocol, process identifier, file type, etc.), operator ("is", "is not", "includes", "one of", etc.) and the request body
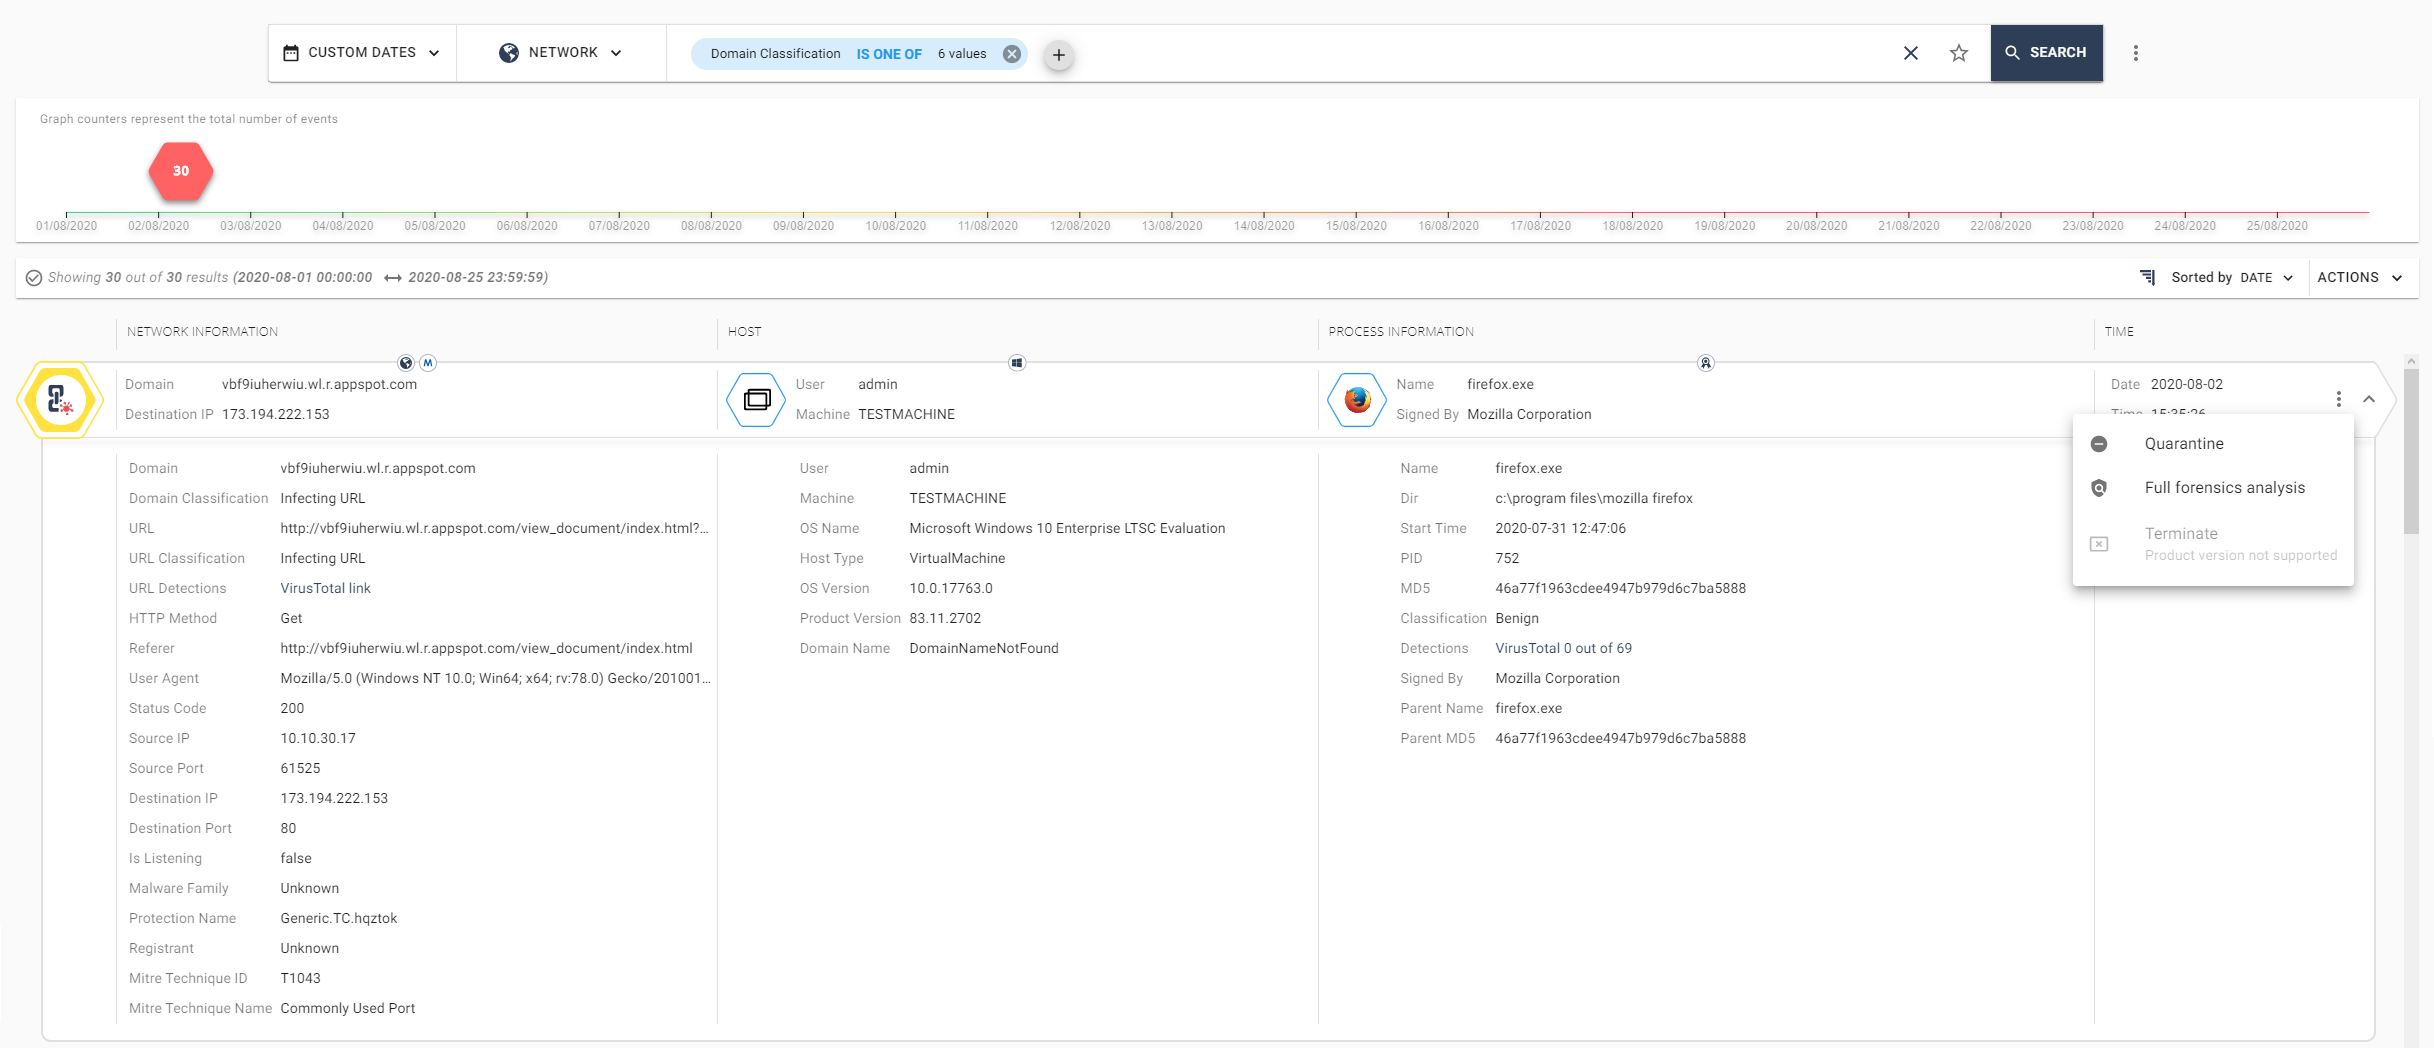
... Regular expressions can be used in the request body; multiple filters can be used simultaneously in the search string. After selecting a filter and completing the processing of the request, access to all suitable events appears, with the ability to view detailed information about the event, quarantine the request object, or generate a detailed Forensics Report with a description of the event. At the moment, this tool is in beta version and in the future it is planned to expand the set of features, for example, adding information about the event in the form of the Miter Att & ck matrix.
Conclusion
To summarize: in this article, we examined the possibilities of monitoring security events in the SandBlast Agent Management Platform, studied a new tool for proactively searching for malicious actions and anomalies on user machines - Threat Hunting. The next article will be the final one in this cycle, and in it we will look at the most common questions about the Management Platform solution and talk about the testing capabilities of this product.
A large selection of materials on Check Point from TS Solution . In order not to miss the following publications on the SandBlast Agent Management Platform - follow the updates on our social networks ( Telegram , Facebook , VK , TS Solution Blog , Yandex.Zen).