
As you may have heard, last year ABBYY acquired TimelinePI , a developer of Process Intelligence platforms. Now, in addition to intelligent information processing, ABBYY products help companies solve a new class of problems - analyze business processes, understand how they work from the inside and how to change them for the better.
This is a logical step for us. In the depths of large companies, huge amounts of data are continuously generated and processed. Our solutions for corporate customers help to structure a variety of information from accounting, HR, logistics and other documents and make it more convenient to work with them. Why not only organize the information, but also draw useful conclusions for business on its basis? For example, to understand how the processes are arranged, to identify non-obvious patterns in them, to analyze those metrics that were not previously taken into account, and even predict what will happen if the processes are automated using this or that technology?
Today we will tell you what the platform for intelligent analysis of business processes ABBYY Timeline is., what it is for, and we will give examples of how this solution works and where it is useful.
Process Intelligence is a set of tools for intelligent analysis of business processes. These solutions allow you to visualize, quantify and understand how to properly build processes in order to continuously improve their efficiency.
Both Process Intelligence and Process Mining use digital traces of user actions to analyze. However, Process Mining solutions , -. , Happy Path, Happy Path. Process Intelligence - – , .
Process Intelligence
1. Analyze the past . ABBYY Timeline solution helps to get a real picture of the process (this is called Process Discovery), based on digital traces . And already having an idea of the real state of affairs, management can identify areas with the greatest potential for automation.
Let's explain what a digital footprint
is This is a unique set of actions of an individual employee, department or group of departments, which is reflected in corporate information systems. Depending on the process, this can be information about the fact that an email was sent, a mark about the approval of a document, a username, a purchase on the site, clicking a button in a program on a desktop, and much more .
2. Tracking the present . The ABBYY Timeline platform allows you to observe in real time what is happening at each or several stages of the process, receive information about events, conditions, patterns, violations and respond to them in time.
3. Predict the future . Machine learning methods can be used to predict the possible outcome of processes that are not yet completed. The basis for machine learning will be the empirical data and documents (or information extracted from them) that are involved in the process.
4. Construct hypotheses and test them... ABBYY Timeline can both calculate the effect of the proposed automation and compare the process before and after the implementation of technologies. For example, a company has been using software robots for a month and, using the analysis of business processes, can understand how effective this project is.
Why is it needed
Let's figure out why analyze business processes using Process Intelligence?
Any business seeks to effectively use technological solutions in order to gain a competitive advantage. All large companies in one way or another automate individual tasks using artificial intelligence, digital twins, robots, etc. For example, computer vision is used to translate documents into electronic form, determine the type of data and then send them to the desired database, natural language processing (NLP) - to analyze the content of the text and extract the necessary entities and facts from it, RPA - to reproduce user operations : move files to target systems, send auto replies, open programs, etc.
Consistency is important in any technology project. Before implementing any solution, you need to clearly understand:
- how does everything work at the moment?
- where exactly will the technology be embedded?
- what task or tasks will it perform?
- maybe automation is not needed yet, but it is enough to rebuild and simplify the sequence of actions?
There are three methods for finding answers to these questions.
The first is to interview employees and write down how they imagine the process. But it’s not that simple. First, managers see the big picture and do not know some details and little things that are often important in critical situations. Secondly, performers and specialists can make mistakes in the sequence of stages or hide something, for example, the presence of an observer changes the behavior of employees and they often want to attach more importance to their work. Thirdly, depending on the complexity of the process, different specialists can perform the task in different ways. Thus, with this approach, the company risks getting a subjective and contradictory picture:
The second way is to turn to consultants to help re-engineer the processes. Business consultants look at the company more objectively and may discover subtle problems. By the way, many modern consulting firms use Process Intelligence solutions. For them, this is an additional tool to quickly study the customer's business processes and get more useful information. As a rule, process reengineering requires a lot of labor to find and solve a problem. In our estimate, such an analysis of business processes in a company can take from 6 to 8 months, while the use of the ABBYY Timeline platform makes it possible to do this faster.
However, any optimization project is final. The consultants and employees find a section of the process, implement the project, count the results, and after that they disagree and - lo, sadness! - take with them the solution with which they made the analysis.
Third way- rely on digital traces that remain in corporate sources when reengineering processes. Information is constantly accumulating in the logs of information systems. If you use this data correctly, you can learn a lot about your company. Forrester analysts call this concept Digital Intelligence. This is the digital maturity level of organizations that make extensive use of digital data to analyze processes and grow their business. For example, for this they take metadata (which employee completed the task, when and for how long, closed the application, etc.) and, using modern tools, connect these "digital traces" with why specific steps were taken in the process ...
Thus, you can look at the work of each employee individually - this is also one of the ways to use Process Intelligence. One subordinate will work slower than the other and complete fewer tasks per work day. What does it mean? It is important to see what kind of applications they are processing and what are the characteristics of these documents? Let's say one of the employees spent more time because he was processing the most complex contracts that require more thoughtful analysis.
Application of Process Intelligence makes an expert independent of external factors. This tool can come in handy in the day-to-day work of business analysts, consultants, and business leaders.
Why Process Intelligence Is More Than BI
Those who are firsthand familiar with the topic of business process optimization may have a logical question: "How does Process Intelligence differ from Business Intelligence (BI)?" BI can also interpret large amounts of data, focusing on key performance factors, helping to track decision making and building a big picture of the business. Yes, it is, but the devil, as they say, is in the details.
Business Intelligence's job is to show static metrics. And PI systems provide real-time process monitoring. The main difference between these solutions is that BI systems do not have standard tools for presenting data as a process. Moreover, the process is not only a sequence of steps, but a set of states, reasons and conditions for the transition between them.
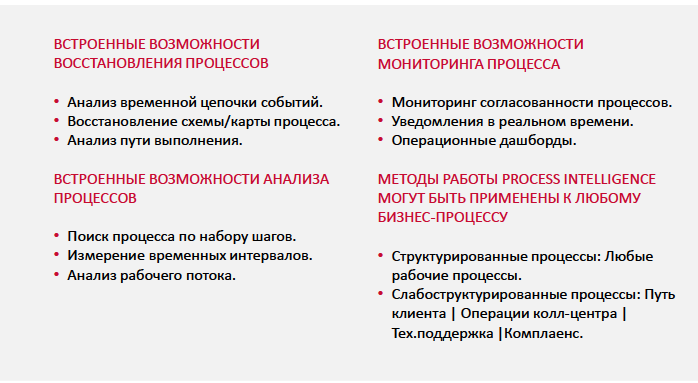
Unlike BI, Process Intelligence platforms, in particular, ABBYY Timeline, have dozens of specialized tools for different business tasks: data collection and extraction, monitoring and notification, event forecasting, etc. .d. We will talk about them below.
What Process Intelligence looks like
The entire mass of data that will be processed enters ABBYY Timeline using tools that are understandable and familiar to many for extracting and processing content.
The need for ETL ("extract, transform, load", or literally "extract, transform, load") stems from the variety of sources in which data is stored. For example, information for analysis comes from ERP, CRM, web analytics systems and others. ETL allows you to load data from different sources directly into ABBYY Timeline, and for this you do not need to install an additional database.
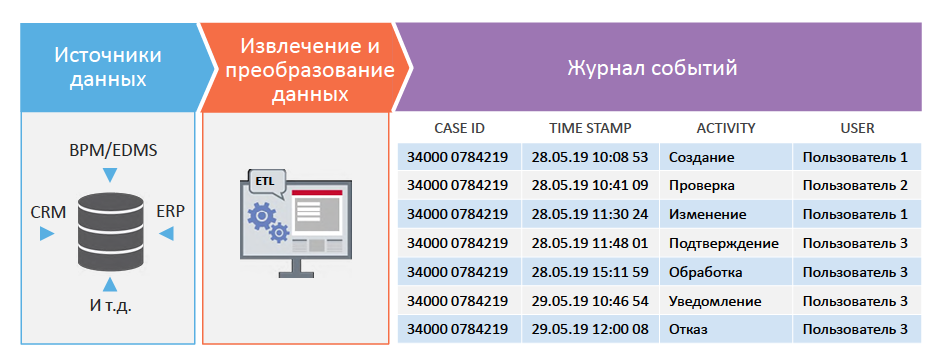
In the ABBYY Timeline interface, the event log looks like this (hereinafter, screenshots are clickable): This data can be supplemented, prepared, cleaned, etc., to use ETL more efficiently. For example, you can add dates, round up the timestamp to specified units (minutes, seconds), remove duplicate records, combine data from several systems into one dataset using a common key, and build a sequence of data conversion operations that is performed at boot in real time.

Also, each of the events (that is, the stages of the process) can be assigned the necessary parameters (attributes), which help to conduct deeper analytics. Attributes are structured data entered from documents into information systems manually or using OCR and NLP. For example, it can be the loan amount, the client's age, or the name and surname of the manager, if we are talking about a bank; region, type of insurance or day of the week if we are talking about an insurance company. Thus, when analyzing a business process, you can select one or more of the loaded attribute values, for example, 3 regions out of 23:

Any Process Intelligence system is a platform with many different metrics: indicators, numbers and graphs that are updated in real time. For example, our ABBYY Timeline is not just a dashboard in which an invited consultant once set up a dozen metrics that you will check once a month. The ABBYY Timeline platform can be used regularly. It is easy to make settings on it yourself and monitor the process from different sides every day: Analysis after implementation : on the dashboard, you can see the change in business indicators for a specific period, in this case, for several months. So, for example, an insurance company can understand how effective it was to automate the process of checking risk categories using software robots.
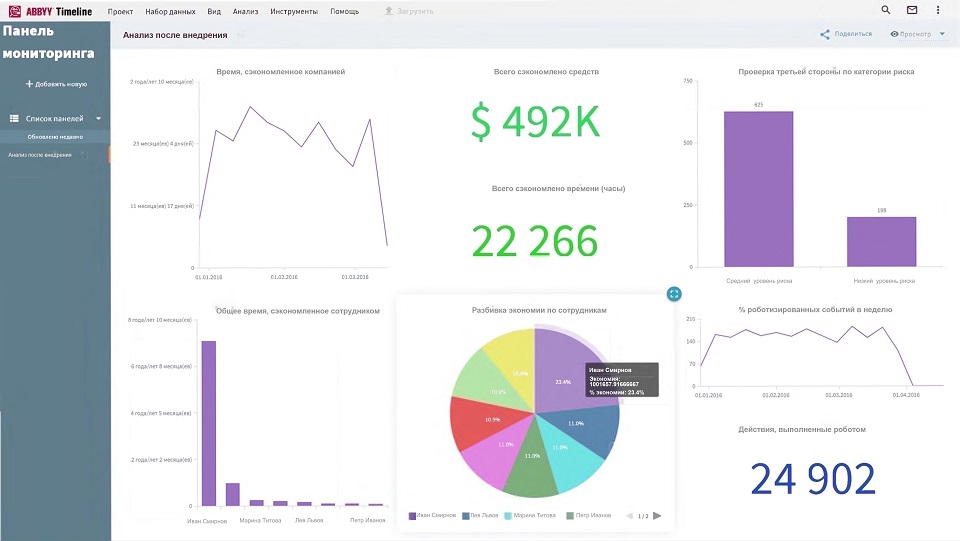
ABBYY Timeline is a complete business intelligence tool. He may be an employee of the organization that purchased the license, rather than an expensive hired consultant. Let's give an example of the platform start screen: Using the start screen, you can carry out top-level analytics: click on each average indicator, look at the histogram for the distribution by the number of process instances and how this distribution changes for each attribute (day of the week, manager, region, etc.) ).

Let's look at how you can use the start screen using the example of the process for settling an insured event. On the start screen above, we see the distribution of the first and last events in the process: in most cases (89%) the first event is a notification of an insured event. The last event - the application is closed - occurs 84% of the time. Sometimes the information from the start screen is enough to understand that you have broken data. For example, if “order closed” is indicated as the first event, then incorrect data was clearly received at the entrance. Or, for example, a manager knows that the process of settling an insured event does not last longer than a month. If the average time is 5 years, then something must have gone wrong.
Analysis tools and examples of their use
ABBYY Timeline tools are distributed across clusters. They help to consistently answer the questions:
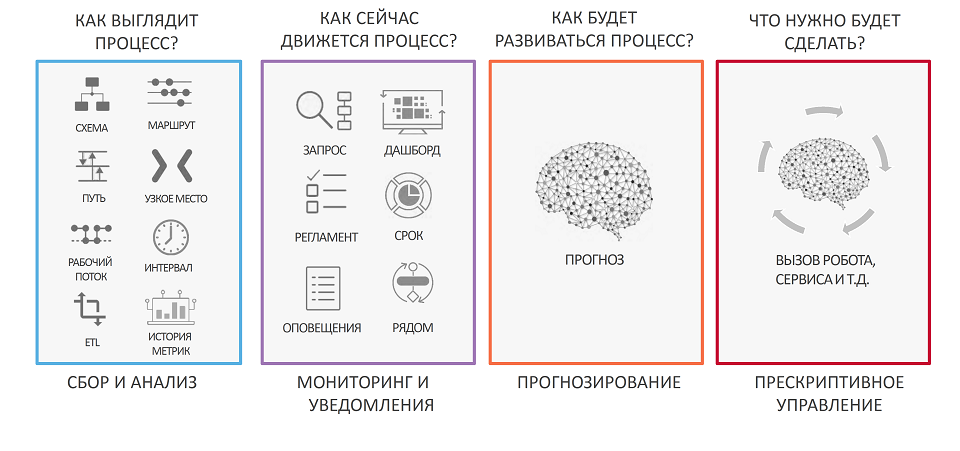
Understand what the process looks like
ABBYY Timeline provides an opportunity to restore a generalized scheme of a process: to see its stages, their duration and the number of transitions between them, and also to visualize the fastest (green on the diagram) and longest (red on the diagram) processes using animation. The scheme can be customized to achieve different levels of detail. For example, a manager may be alarmed by the situation why there are more yellow and red dots on the bill payment process diagram closer to the very last step. This is the way to maximize the high level

analysis: to detect any immediately conspicuous repetitive stages, bottlenecks, unnecessary steps. For example, you can pay attention to why the invoice is being coordinated in the accounting department for a long time. It is necessary to focus on such places if the company wants to speed up the process, or automate it.
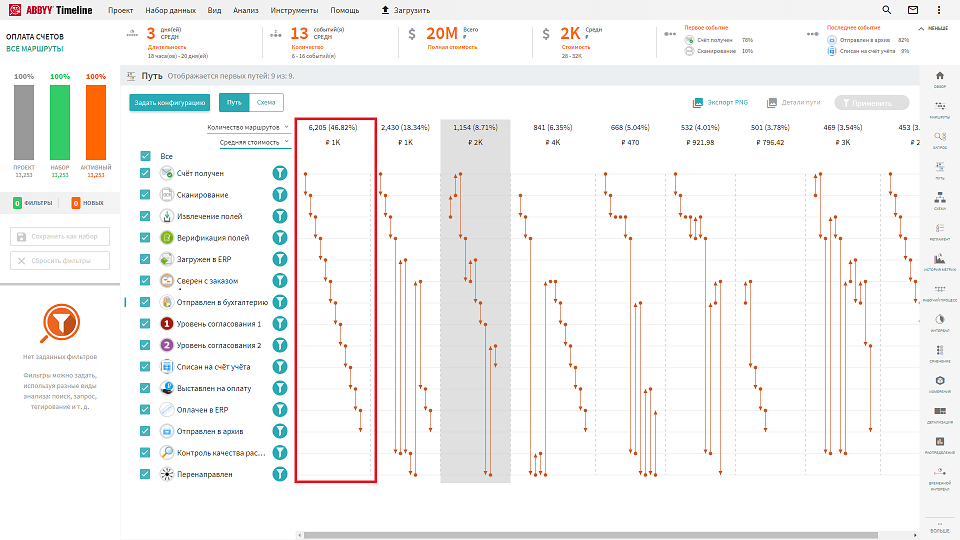
Another example of data visualization is with the Path tool . Unlike the scheme, a more detailed view of the bill payment process and all the options for passing it is already created here. "Paths" can be sorted - by frequency, by duration, by the number of steps, by the average cost of expenses. On the slide, we marked with a red frame the most popular and most harmonious route - the process followed it in almost 47% of cases
. , ..
. , ( 8% ) 2 , . . , .
,
A query is a way to detect processes in which a certain sequence of actions (pattern) of interest to the company is executed. In this way, you can check various patterns, for example, how often a manager responds with a large delay to a request from a client. A request can be set both flexibly and rigidly (as a strict adherence of stages one after another).
Let's take an example from the insurance industry . Using a request, you can, for example, track cases when, after an accident, a customer was given a replacement car, although this option was not provided for in the insurance policy. To find the processes that correspond to such a situation, the company's expert builds a query:

The screenshot shows that the client was given a replacement car, and then the insurance company confirmed the refusal for a loss. As we can see, it took the client more than 4 days to return the car. This is understandable: why should he be in a hurry when he can drive a rental car at the expense of the insurance company.
Thus, in ABBYY Timeline, you can monitor processes where a mandatory step has not been completed, for example, a specialist did not confirm insurance coverage. That is, upon request, you can eventually find such processes where one of the procedures is violated.
Regulations are another tool for finding violations of procedures. It has the ability to strictly define the sequence of events, attribute values, duration of stages, etc.:

The tool allows you to identify those processes that do not comply with the specified regulations and determine the nature of violations (and not just processes that do not generally correspond to the pattern). ABBYY Timeline detects violations of the following types:
- failure to meet deadlines,
- missed stage,
- wrong position,
- the wrong number of repetitions of a particular step.

In the system, you can see how many such violations were and how many "paths" they encountered. It is possible to filter out all events where violations occurred, for example, the damage assessment was not confirmed in time. Then a notification can be assigned to any violation: when it happens, a person or a robot will receive a notification.
Why is the "Schedule" tool useful in ABBYY Timeline? Most Process Intelligence systems motivate the manager to create an ideal scheme and redesign or ignore those processes that do not correspond to it. But the manager should be concerned about the reason for the deviation from the schedule, because not all violations are significant. Evaluating the regulations, the manager himself decides whether to react to the violation or not.
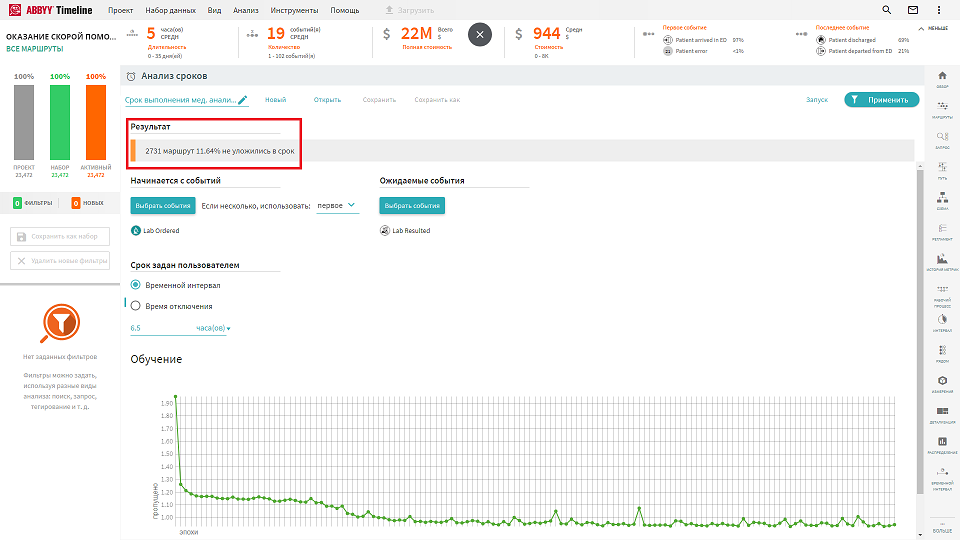
Let's analyze one more tool -"Timing analysis" . Using ML models trained on historical process data, you can monitor the observance of the time elapsed between two events. It allows you to predict which of the current processes or their stages will not meet the deadline. "Time analysis" allows you to set a condition that, for example, "all invoices that are received today must be paid by 16:00." You can select several events from which the tracking period of the new interval begins, and several events with which it should end.
Let's take an example from medicine. If the patient receives any services in a private clinic, it is necessary to record all studies and track the treatment process, in particular, so that, based on historical data and a trained model, predict whether medical tests will be performed in the time required for timely invoicing for the insurance companies. According to historical data, 11% of medical tests were not completed on time.
Determine how the process will develop
The Forecast tool , based on historical data, helps to predict the outcome of processes that have not yet completed. Let's take as an example predicting the number of free wards in a hospital. Let's say a patient arrives for examination after 4:00 pm and visits three doctors. The last of them discovered that another examination was needed. According to historical data, it can be determined that there were processes that developed according to a similar scenario and with a certain probability led to the fact that a person remained in the hospital until the morning. That is, the tool allows you to predict that hospitalization is expected and start looking for a free room for such a patient.
What to do with this information? Based on the predicted outcome of the process, expressed in the occurrence of a certain event, ABBYY Timeline allows you to set up a call to an external service - for example, create an automated ticket in the system using a robot. RPA begins to search through the ERP system of the entire branch network, where there are free wards, finds places in other branches and reserves transport for a certain time to transport the patient. According to this prognosis, the patient will be allowed to go home with a 77% probability. This means that you don't have to reserve a room for him.

Assess where robots are needed
Using ABBYY Timeline, you can analyze processes and detect repetitive actions in them, which can then be automated using technologies, including robots (RPA). Software robots are one of the leading technological trends in recent years. RPA manufacturers raise billions in investments, and large companies - for example, Alfa-Bank, VTB, VimpelCom - report millions in savings due to robotic labor.
We will tell you how to identify processes that can be given to software robots and justify the use of RPA using ABBYY Timeline.
1). Having made the discovery process, you get a draft of the visual script for RPA. Process Discovery- this is the same picture of the process. It further allows you to find problem points using measurable indicators, and optimize the process using more than 25 analytical tools. In Process Discovery, you can see something at a high level, and in the future, you can consider in more detail some of the stages of the process.
Let's look again at the previously reviewed screenshot of "Paths". As you can see, the very first path is the most frequent, slender, with clear and predictable steps. This path is the first candidate for automation, and its diagram is the very draft of the visual script for RPA.

The rest of the paths are completely different. Why? For example, invoices with pen marks or stamps on top of amounts and dates are spent on additional quality control of recognition. Another example is that the process of issuing loans to military personnel may differ from the process of issuing loans to a mother with many children.
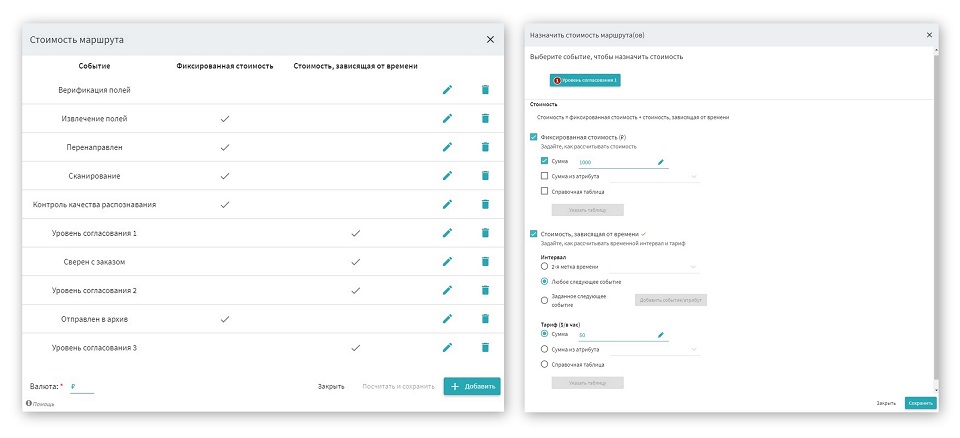
As we said above, Process Discovery also calculates the cost of completing tasks. Note that you can calculate the cost of a process by specifying both static cost metrics and variable ones (see screenshots below). The first screenshot shows which events cost depends on time. In particular, these are all levels of invoice payment approval. The second screenshot shows the detailed cost setting for the "Agreement Level 1" event.
2). There is an opportunity to look at the types of processes, determine their mass, the cost of completing tasks and the duration . You can look at the sequence diagram and see that some path is very complicated and confusing, but it makes no sense to automate it, it takes 0.01% of the total. Or maybe there is such a path of the process in which the stages are also confused, but this path accounts for 90% of all cases and, accordingly, costs. Then you need to tackle these pieces and automate them first.
In the flowchart, arrows show how the process steps are related. For example, you can see the "shuttle run" back and forth:
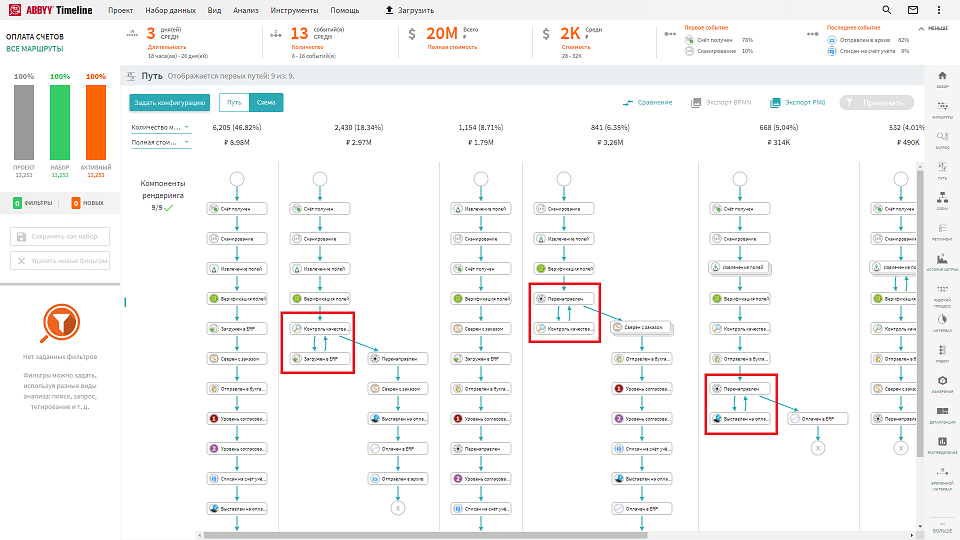
3). ABBYY Timeline has a what-if analysis that shows the savings in money and time on the process before and after the implementation of a new technological solution, for example, RPA.
ABBYY Timeline helps you find all pairs of events, show the time that passes between them, and test the hypothesis of how many man-hours and money can be saved if the entire process is switched to RPA. For example, as a result of an RPA system pilot, the manager learned that automatically copying data from one system to another is 5 times faster than manually copying data. Through ABBYY Timeline, the employee checks how much time and money the company can save through robotization. With this information, he can justify the introduction of a new system. The screenshot shows

- all pairs of events that are in processes,
- their number,
- ,
- , ,
- , .
, , , – , , .

ABBYY Timeline . , , 2 , ( ) .
The processes of automation and the introduction of machine learning into our lives will only accelerate. Just as people no longer want to go at random and therefore use navigators to calculate the route, time and cost of a trip, so the business uses PI to assess the effect of technology implementation in business processes. Getting a navigator today is easy, as is using Process Intelligence tools. Almost any company has digital footprints, and therefore a basis for studying processes. And now there is a technical opportunity to use this data - to engage in analytics, prediction and obtaining useful insights.
In the next few years, PI platforms will become a means of feedback for business, according to forecasts of the international analytical company NelsonHall. That is, based on the results of the analysis of business processes, it will be possible in real time, and not after the fact, to find bottlenecks, simplify, accelerate and automate processes and their stages within the organization, implement RPA faster and assess the impact of software robots on the company's revenues, and therefore more precisely to make plans for the future. Read more about the research results of the process analytics market here .