For wheat genetics, an important task is to determine ploidy (the number of identical sets of chromosomes in the cell nucleus). The classical approach to solving this problem is based on the use of molecular genetic methods, which are expensive and labor intensive. Determination of plant types is possible only in laboratory conditions. Therefore, in this work, we test the hypothesis: is it possible to determine the ploidy of wheat using computer vision methods, only on the basis of an image of an ear.
Data Description
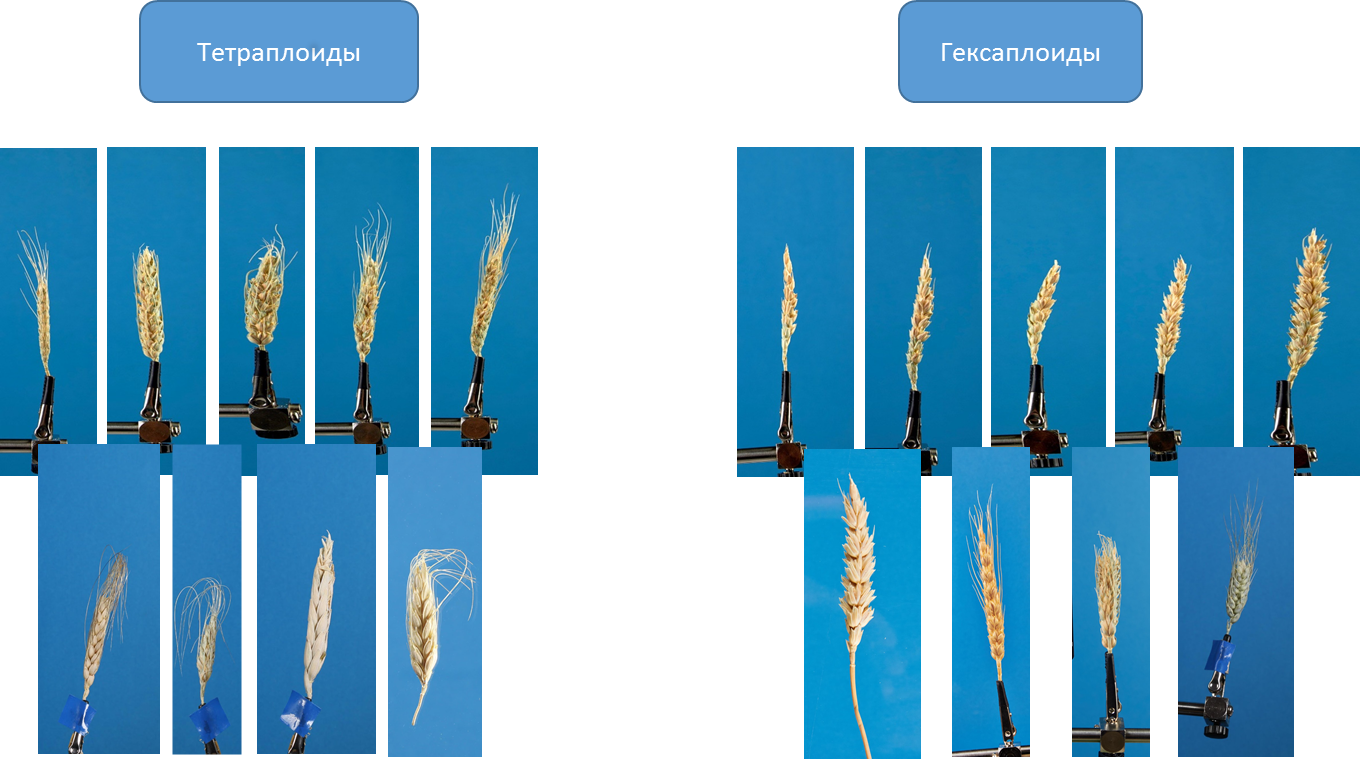
To solve the problem, even before the start of the workshop, a dataset was prepared in which the ploidy was known for each plant species. In total, we had 2344 photographs of hexaploids and 1259 tetraproids at our disposal.
Most of the plants were photographed using two protocols. The first case - on a table in one projection, the second - on a clothespin in 4 projections. In the photographs, the color palette of the colorchecker was always present , it is needed to normalize colors and determine the scale.

A total of 3603 photos with 644 unique seed numbers. The dataset contains 20 wheat species: 10 hexaploid, 10 tetraploid; 496 unique genotypes; 10 unique vegetation. Plants were grown between 2015 and 2018 in greenhousesICG SB RAS . Biological material was provided by Academician Nikolai Petrovich Goncharov .
Validation
One plant in our dataset can correspond to up to 5 photographs taken using different protocols and in different projections. We divided the data into 3 stratified sets: train (training sample), valid (validation sample) and hold out (delayed sample), in ratios of 60%, 20%, and 20%, respectively. When dividing, we took into account that all photographs of a certain genotype would always appear in one subsample. This validation scheme was used for all trained models.
Trying classic CV and ML methods
The first approach that we used to solve the problem is based on the existing algorithm that we developed earlier. The algorithm allows extracting a fixed set of different quantitative features from each image. For example, the length of the ear, the area of the awns , etc. For a detailed description of the algorithm, see Genaev et al., Morphometry of the Wheat Spike by Analyzing 2D Images, 2019 . Using this algorithm and machine learning methods, we trained several models to predict the types of ploidy.
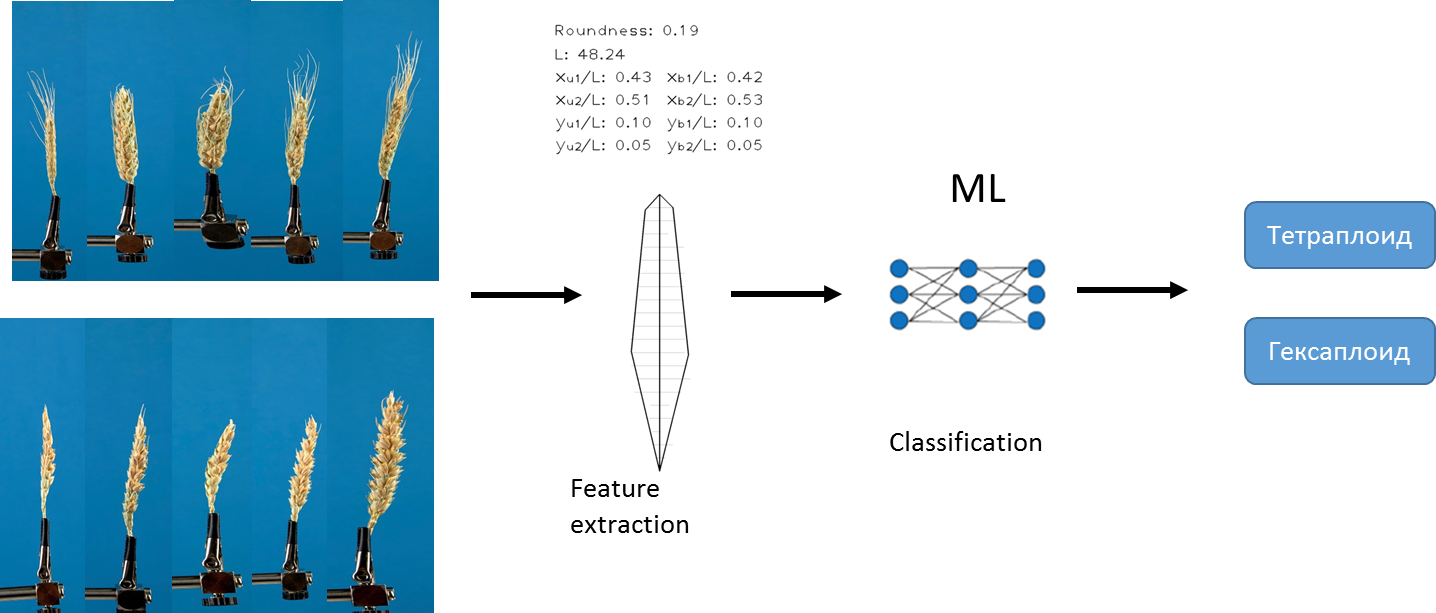
We used logistic regression methods , random forest and gradient boosting . Data has been pre- normalized... We chose AUC as a measure of accuracy .
| Method | Train | Valid | Holdout |
| Logistic Regression | 0.77 | 0.70 | 0.72 |
| Random forest | 1.00 | 0.83 | 0.82 |
| Boosting | 0.99 | 0.83 | 0.85 |
The best accuracy on deferred sampling was shown by the gradient boosting method; we used the CatBoost implementation.
Interpreting the results
For each model, we received an assessment of the "importance" of each feature. As a result, we got a list of all our features, ranked by significance and selected the top 10 features: Awns area, Circularity index, Roundness, Perimeter, Stem length, xu2, L, xb2, yu2, ybm. (a description of each feature can be found here ).
An example of important traits is ear length and perimeter. The distributions of the values of these traits in tetraploids and hexaploids are shown on the histograms. It can be seen that the distribution for hexaploids is shifted towards higher values.

We have clustered the top 10 features using the t-SNE method
In general, greater ploidy gives more variable values of traits. Hexaploids are characterized by a greater scatter / variance of the values of the trait. This is because the number of copies of genes in hexaploids is greater and therefore the number of variants of "work" of these genes increases.
To confirm our hypothesis of greater phenotypic variability in hexaploids, we applied the F statistic. The F statistic gives the significance of the differences in the variances of the two distributions. We considered the cases when the p-value is less than 0.05 to refute the null hypothesis that there are no differences between the two distributions. We ran this test independently for each trait. Test conditions: there should be a sample of independent observations (in the case of several images, this is not the case) and normal distributions. To fulfill these conditions, we tested one image of each ear. They took photographs only in one projection according to the protocol “on the table”. The results are shown in the table. It can be seen that the variance for hexaploids and tetraploids has significant differences for 7 characters. Moreover, in all cases, the value of dispersion is higher in hexaploids.The greater phenotypic variability in hexaploids can be explained by the large number of copies of one gene.
| Name | F-statistic | p-value | Disp Hexaploid | Disp Tetraploid |
| Awns area | 0.376 | 1.000 | 1.415 | 3.763 |
| Circularity index | 1.188 | 0.065 | 0.959 | 0.807 |
| Roundness | 1.828 | 0.000 | 1.312 | 0.718 |
| Perimeter | 1.570 | 0.000 | 1.080 | 0.688 |
| Stem length | 3.500 | 0.000 | 1.320 | 0.377 |
| xu2 | 3.928 | 0.000 | 1.336 | 0.340 |
| L | 3.500 | 0.000 | 1.320 | 0.377 |
| xb2 | 4.437 | 0.000 | 1.331 | 0.300 |
| yu2 | 4.275 | 0.000 | 2.491 | 0.583 |
| ybm | 1.081 | 0.248 | 0.695 | 0.643 |
Our data includes 20 species of plants. 10 hexaploid wheat and 10 tetraploid.
We have colored the clustering results so that the color + shape of each point corresponds to a specific view.

Most of the species occupy fairly compact areas on the chart. Although these areas can overlap a lot with others. On the other hand, within one species there can be clearly defined clusters, for example, for T compactum, T petropavlovskyi.
We averaged the values for each species for 10 features, obtaining a table 20 by 10. Where each of the 20 species corresponds to a vector of 10 features. For these data, a correlation matrix was built and hierarchical cluster analysis was performed. Blue squares in the graph correspond to tetraploids.

On the constructed tree, in general, the wheat species were divided into tetraploid and hexaploid. Hexaploid species were clearly divided into two clusters: medium-haired - T. macha, T. aestivum, T. yunnanense and long-haired - T. vavilovii, T. petropavlovskyi, T. spelta. The only exception is that the only wild polyploid (tetraploid) species T. dicoccoides was classified as hexaploid.
At the same time, the tetraploid species included hexaploid wheat with a compact ear type - T. compactum, T. antiquorum, and T. sphaerococcum, and the man-made isogenic line ANK-23 of common wheat.
Trying CNN

To solve the problem of determining the ploidy of wheat from the image of an ear, we trained a convolutional neural network of the EfficientNet B0 architecture with weights pre-trained on ImageNet. CrossEntropyLoss was used as a loss function; Adam optimizer; size of one batch is 16; images were resized to 224x224; the learning rate was changed according to the fit_one_cycle strategy with an initial lr = 1e-4. We trained the network for 10 epochs, applying the following augmentations at random: rotations by -20 +20 degrees, changing brightness, contrast, saturation, mirroring. The best model was chosen according to the AUC metric , the value of which was calculated at the end of each epoch.
As a result, the accuracy on the deferred sample AUC = 0.995 , which corresponds to the accuracy_score= 0.987 and an error of 1.3%. Which is a very good result.
Conclusion
This work is a good example of how a team of 5 students and 2 curators can solve an urgent biological problem and obtain new scientific results within a few weeks.
I would like to express my gratitude to all the participants in our project: Nikita Prokhoshin , Alexei Prikhodko , Evgeny Zavarzin , Artem Pronozin , Anna Paulish , Evgeny Komyshev, Mikhail Genaev .
Koval Vasily Sergeevich and Kruchinina Yulia Vladimirovna for photographing ears of corn.
Nikolai Petrovich Goncharov and Afonnikov Dmitry Arkadyevich for the provided biological material and help in interpreting the results.
To the Mathematical Center of Novosibirsk State University and the Institute of Cytology and Genetics of the SB RAS for organizing the event and computing power.

PS We plan to prepare the second part of the article, where we will talk about the segmentation of an ear and the selection of individual spikelets.