Hello, Habr! My name is Nikita, I help my Yandex colleagues with technical expertise on accessibility issues. In this article, I will share our research and explain why collecting and evaluating information about the technical preferences of visually impaired users is another important step towards fully understanding the specifics of accessibility.
Imagine: more and more areas of life are moving to the digital space, but everyone can fully use it except you. The whole world is moving forward, and you remain in place, inevitably lagging behind. This is exactly what happens when the development of IT products is carried out without taking into account their availability for users with disabilities.
Even an ordinary product is not easy to make convenient. The situation is aggravated when it comes to people interacting with information technology in a completely unusual way. And what could be more atypical and counterintuitive than the use of modern visually oriented interfaces without vision? How many developers and graphic designers can imagine exactly how to use their product without looking at the screen at all?
IT develops very quickly, sometimes there is simply not enough time to work out the availability of a product before launching. And when it does work out, then the next significant update can break everything, and you have to start over. Almost any company that maintains many services with isolated teams has accessibility issues. And Yandex, alas, is no exception, although we are constantly looking for the most effective development and testing regulations that take into account the limitations of human perception. By the way, we plan to tell about our experience in this area on Habré a little later.
It is not enough to realize the importance of the problem and study the technical documentation: the real world is more complicated. The most detailed specification is sometimes difficult to interpret unambiguously. And the assistive software used by people with visual impairments is diverse, its interaction with the outside world is not always consistent and obvious. The result is that the implementation of the same option can vary significantly for different products. These are not bugs, but features that need to be known and taken into account. That is, it is required not only to navigate existing solutions, but also to clearly understand how widespread they are, and what are the main technical preferences of the target audience. Knowing the most popular software configurations, you can take a more systematic approach to testing and quality control of availability.
However, obtaining objective information of this kind is very difficult, especially in a structured form. For this reason, several years ago Yandex decided to independently monitor the technical preferences of blind and visually impaired users of the Russian Internet. Today we are releasing the results of this study to anyone who might benefit from it: tech companies, individual developers, and accessibility professionals. The materials are accompanied by detailed comments, but for a quick acquaintance with the main results, you can immediately jump to the conclusions at the end of the article.
Unfortunately, we all still have a long way to go to ensure that information technology is accessible to people with visual impairments. The proposed research is one of the important steps on this path.
Preliminary information
This spring, for the fourth time, we conducted a survey of people with visual impairments, designed to determine the technical preferences of this category of users. Within four weeks, 555 completed questionnaires were received.
In some aspects, the research methodology has been changed and supplemented, which makes it impossible to directly compare a number of results over different years. Comparisons are shown only where correct.
Warnings and notes:
- Most of the questions in the questionnaire allowed a choice of several answers (illustrated by bar graphs), therefore, the percentages in such items do not add up to 100%. For questions where there was only one answer (illustrated with pie charts), the sum of the shares may slightly deviate from 100% due to rounding.
- The sum of all those who answered some questions may differ from the total number of respondents: some of the questions were asked only with a certain history of passing the questionnaire, and in some cases the respondents found it difficult to give an unambiguous answer.
- The study cannot represent all visually impaired people. It has a pronounced bias towards the blind, who are quite active users of computer technology and electronic services.
Terms used
A number of specialized terms are used in the text with the following meanings:
- A braille display is a device designed to convert information received in the form of a digital signal into characters displayed in bold braille. Information from such a device is read tactilely.
- — , , , , , , .
- — - , . - — «accessibility», «availability», - «».
- — , .
- — , . . «screenreader». IT- « ».
- — , , - ( , .).
- Self-sounding working environment - specialized software that combines functionality for performing a target task and non-visual interaction with the user.
- Visually impaired - a person with significant visual impairments that allow him to interact with interfaces visually, but with the need to use screen magnification and image correction programs.
Geography
The survey was conducted on the Internet, among Russian-speaking users. Countries that respondents indicated as those in which they live most of the time:

| Answer | Share | Respondents |
|---|---|---|
| Russia | 86.7% | 481 |
| Belarus | 5.8% | 32 |
| Ukraine | 3.1% | 17 |
| Kazakhstan | 2.5% | fourteen |
| Moldova | 0.9% | five |
| Other | 1.1% | 6 |
The Other category includes one respondent from Austria, Azerbaijan, Georgia, Lithuania, Poland and Uzbekistan.
General technologies
The first block of questions relates to general technical preferences: device types, operating systems, browsers, etc.
1. Which of the following devices do you use?

| Answer | Share | Respondents |
|---|---|---|
| Desktop / laptop | 97.3% | 540 |
| Touchscreen smartphone / tablet | 94.8% | 526 |
| Mobile phone with push-button control | 13.5% | 75 |
| Other | 1.3% | 7 |
The continued popularity of stationary computers / laptops is observed, the share of which in all polls is stable at 96–97%. At the same time, there is a noticeable upward trend in the use of modern sensor devices, the share of which has been steadily growing since 2014, and by 2020 has almost reached parity with desktop solutions.
The number of push-button telephones users has been showing a downward trend in all years of observation, and among them, by 2020, only 18.7% do not have a modern touch device.
Thus, among users with visual impairments in recent years, there has been an almost ubiquitous spread of modern mobile devices, but without any noticeable abandonment of desktop computers. The share of people using exclusively a mobile touch device is extremely small at 2.7%, and the share of people using a desktop computer without a touch mobile device is twice as large - 5.2%.
In the "Other" category, users indicated set-top boxes, Smart TVs, smart watches and speakers, as well as tiflo flash players (specialized devices for reading "talking" books).
2. What operating system is installed on your computer / laptop?

| Answer | Share | Respondents |
|---|---|---|
| Windows | 98% | 529 |
| macOS | 12.2% | 66 |
| One of the Linux distributions | 4.3% | 23 |
| Other | 0.4% | 2 |
It is noticeable that some part of the audience uses several operating systems for personal computers at once. It should be borne in mind that the survey was primarily attended by active users of computer equipment and technology enthusiasts. This means that, on average, the number of blind and visually impaired people working on more than one system is likely to be lower.
Throughout the history of surveys, the Windows system has maintained an undeniable leadership in the prevalence of users with visual impairments at the level of 96-98%. At the same time, compared to the previous survey in 2016, the share of macOS increased from 5.6% to 12.2%, while the share of Linux, on the contrary, decreased from 6.6% to 4.3%.
However, for the majority of blind people who have access to several operating systems at once, the main solution is still Microsoft Windows: for 60% among Windows and macOS users and for 85% among those who work with Windows and Linux. This is most likely due to the higher level of development of non-visual accessibility tools on Windows compared to macOS and especially Linux. A significant number of users simultaneously using macOS and Linux could not be identified.
In the "Other" category, respondents recorded Android and iOS systems. Most likely due to inattention.
3. Which browser do you use as your main browser and use it most often on your computer / laptop?
One of the important features of the work of blind users on a PC is the frequent use of more than one browser. This is due to the occasional different degree of availability of the same web interfaces in different browsers. For this reason, it is important to distinguish between the first choice browser and the one that the user only accesses from time to time.

| Answer | Share | Respondents |
|---|---|---|
| Google chrome | 42.9% | 217 |
| Mozilla Firefox | 28.7% | 145 |
| Internet Explorer | 8.7% | 44 |
| Yandex browser | 6.9% | 35 |
| Opera | 4.5% | 23 |
| Safari | 3.4% | 17 |
| Microsoft Edge | 3% | fifteen |
| Other | 2% | ten |
Browser preferences of visually impaired users have changed dramatically since our last survey in 2016:
- Google Chrome has become more popular: now it is chosen by 42.9% against 7.7% in 2016: a confident first place against only the third.
- Mozilla Firefox lost ground from 54.1% to 28.7% and dropped from first to second place.
- Internet Explorer 27,6% 8,7%, .
The still quite high popularity of Internet Explorer is explained by its good compatibility with screen readers, although many sites are now inoperable in it. The strong fall in Firefox is probably due to the transition to the Quantum engine in version 57. It caused a loss of compatibility with screen readers on Windows. It was not possible to overcome this problem immediately, and users of the JAWS program needed a paid update to completely solve all problems. The availability of Chromium-based browsers has been steadily improving all this time, which has led to an increase in their popularity among users with visual impairments. For example, in Google Chrome 75-76, the function of automatic generation of descriptions for images without text labels appeared.
Internet Explorer is mostly preferred by JAWS users: 5 times more often than those using NVDA (16.7% versus 3.2%). NVDA users in general are more likely to choose modern browsers: Chrome's share is 44% versus 41.3%, and Firefox's share is 30.3% versus 24.5% for JAWS users.
This is most likely due to the fact that NVDA is free and can be maintained by the user in an evergreen state along with browsers. JAWS, by contrast, offers an annual paid upgrade or subscription, and users are often not running the latest version and are therefore more likely to use non-modern browsers that are better compatible with their version of the screen reader. Taking into account the current trends in the redistribution of shares and the development of screen readers themselves, this factor in the future may additionally affect the popularity of browsers among users with visual impairments.
Among blind users of macOS, for whom this system is the main one, the browser of the first choice in about half of the cases is still Safari, the second most popular is Chrome, the rest prefer other browsers.
The sample of blind Linux users, for whom this system is the main one, turned out to be quite small, so already a few respondents can strongly influence the distribution of shares. According to the data collected, 80% of these users prefer Firefox and only 20% Chrome. However, this result is quite expected, since browsers based on the Chromium engine on Linux systems became available with Orca only in the fall of 2019, and this functionality is still in beta testing.
Other browsers include Atom, Maxthon, SeaMonkey, Tor and UC Browser. Several Windows and iOS screen reader users insistently pointed out Safari, which was never available to screen readers on Windows, so it was most likely implied that they prefer to surf the Internet from a mobile device.
4. What browser do you use as an additional one and do you use it on your computer / laptop in addition to the one mentioned above?

| Answer | Share | Respondents |
|---|---|---|
| Mozilla Firefox | 34% | 172 |
| Google chrome | 31.8% | 161 |
| Internet Explorer | 20% | 101 |
| I am not using an additional browser | 14.8% | 75 |
| Yandex browser | 12.1% | 61 |
| Opera | 11.1% | 56 |
| Microsoft Edge | 9.3% | 47 |
| Safari | 3.8% | 19 |
| Other | 2% | ten |
The share of Internet Explorer here is also largely shaped by users who prefer the JAWS screen reader.
Among blind macOS users, there is a strong bias towards using Chrome and other Chromium-based solutions with a fairly low prevalence of Firefox as an additional browser. This is most likely due to the fact that Firefox's availability for VoiceOver has not been sufficiently stabilized.
Blind Linux users are more likely than others to do without an additional browser. A possible explanation is the lack of a large number of alternatives due to the only recent implementation of basic browser accessibility on the Chromium engine. Plus, this functionality is still in beta testing.
Other browsers include Brave, FreeU, SeaMonkey, SRWare Iron, Tor and UnGoogled Chromium.
5. What operating system is installed on your smartphone / tablet?

| Answer | Share | Respondents |
|---|---|---|
| Android | 75.8% | 408 |
| iOS | 37.2% | 200 |
| Symbian | 9.7% | 52 |
| Other | 0.7% | 4 |
It should be noted that in the distribution of respondents' preferences regarding mobile operating systems, there is a fundamental discrepancy with similar studies of the English-speaking audience, in which the share of iOS is more than 2/3 of the respondents, and Android is only slightly more than 1/4.
Throughout the history of observations among Russian-speaking users with visual impairments, the share accounted for by Android surpassed iOS: at first by about 2/3 to 1/3, and the latest survey in 2016 recorded a record ratio of respondents: Android - 83.3%, iOS - 29%. The 2020 poll shows a narrowing gap: it has become the lowest in the last three surveys. Most likely, this is due to the higher level of development of non-visual accessibility tools on iOS compared to Android. A more significant churn of the audience on iOS may be hindered by economic factors.
However, 24.7% of the total mass of users of modern touch devices work simultaneously with Android and iOS, so narrowing the gap is not always associated with the abandonment of one device in favor of another. Often there is a combination of two systems, since one of them may be more convenient for non-visual solution of some specific problems. However, the survey was primarily attended by active computer users and technology enthusiasts. This means that, on average, the number of blind and visually impaired people working on more than one system is likely to be lower.
Other systems included BlackBerry 10, MIUI and Windows.
6. How often do you interact with sites using the browser on your smartphone / tablet?

| Answer | Share | Respondents |
|---|---|---|
| , | 57,8% | 290 |
| , | 23,5% | 118 |
| 18,7% | 94 |
Thus, for more than 3/4 of those surveyed, interacting with a service through a mobile browser is not explicitly the preferred choice. This is due to the fact that the level of convenience and simple accessibility of web content when working non-visually from a desktop computer and a mobile device is very different: the corresponding assistive technologies on mobile operating systems lag significantly behind their desktop counterparts in functionality. Especially in the case of Android, which is the most widely used mobile system.
Most likely, and because of this, there is also a steadily high proportion of the use of desktop computers by the blind without any noticeable abandonment of them. It is the desktop solutions that provide greater usability with web interfaces.
7. Which browser do you use as your main browser and use it most often on your smartphone / tablet?
Although differences in the degree of accessibility of the same web interfaces in different browsers for mobile operating systems are less common and only on Android, in this case the respondents were also asked to divide the browser of the first choice and the one that happens to be accessed only from time to time.
In addition, this question was only asked to users who indicated earlier that they quite often use the Internet from a mobile device. That is, the responses do not include deeply negative user experiences that might be caused by an overly old device or insufficient skills in the associated assistive technology.

| Answer | Share | Respondents |
|---|---|---|
| Google chrome | 49.5% | 202 |
| Safari | 31.1% | 127 |
| Yandex browser | 8.1% | 33 |
| Mozilla Firefox | 4.2% | 17 |
| Samsung Internet Browser | 2.9% | 12 |
| Opera | 2.5% | ten |
| Microsoft Edge | 1.5% | 6 |
| Free Adblocker Browser | 0.2% | 1 |
The vast majority of Android users prefer the Chrome browser, while iOS users prefer Safari. At the same time, for Android, Yandex.Browser, also based on Chromium, comes second after Chrome, and the only noticeable alternative implementation of the browser engine in the face of Firefox has a very small share: less than 5%.
Among people who have both an Android device and an iOS device at the same time, the vast majority prefer iOS to access the Internet through a mobile browser. This is due to the fact that the functionality of assistive technologies for working on the Internet on Android is significantly inferior to those on iOS.
8. What browser do you use as an auxiliary (additional) one when working on a smartphone / tablet in addition to the one previously indicated? "

| Answer | Share | Respondents |
|---|---|---|
| I am not using an additional browser | 40.9% | 167 |
| Google chrome | 25.7% | 105 |
| Yandex browser | 17.4% | 71 |
| Mozilla Firefox | 11.5% | 47 |
| Safari | 6.4% | 26 |
| Samsung Internet Browser | 3.7% | fifteen |
| Opera | 2.5% | ten |
| Microsoft Edge | 1.5% | 6 |
| Other | 2.9% | 12 |
The category "Other" included browsers such as ADM, Aloha, Kiwi, MIUI, Tor, UC Browser, but most often without specification, just "built-in".
Assistive technology
The second block of questions relates to user preferences in relation to specialized technologies focused on functional compensation of vision problems.
9. What assistive technologies do you use during your work?

| Answer | Share | Respondents |
|---|---|---|
| Screen Reader | 96.6% | 536 |
| Screen enlargement and image correction program | 9.2% | 51 |
| Braille display | 8.6% | 48 |
| Self-sounding work environment | five% | 28 |
| Another | 0.4% | 2 |
This question demonstrates the structural disproportion of the respondents: the number of blind people significantly exceeds the number of visually impaired. Therefore, the results of this study reflect primarily the technical preferences of blind users who work with alternative presentation of screen information through speech synthesis or braille displays.
The share of visually impaired people in the total mass of people with significant visual impairments is undoubtedly higher, however, it was not possible to attract such respondents in sufficient numbers due to their greater absent-mindedness in the general mass of users, which complicates the search. Since the visual way of interacting with the interface, even with the involvement of assistive technologies, still generally corresponds to the initially conceived by the developer, the severity of the problems that arise is proportionally lower. It also does not contribute to the consolidation of visually impaired users in online communities.
Nevertheless, in a sample of exclusively visually impaired users, some bias in the statistics of preferences for general technologies is noticeable, namely:
- 9,8% , , , 100% Windows 6,5% macOS Linux.
- 11,7% , , , 88,9% Android 20% iOS.
- Chrome Firefox, . Opera . , Internet Explorer .
- , Chrome Safari.
In the "Other" category, some respondents indicated a number of products for solving narrow-profile tasks, in particular, plug-ins for professional music software that make it accessible to the blind.
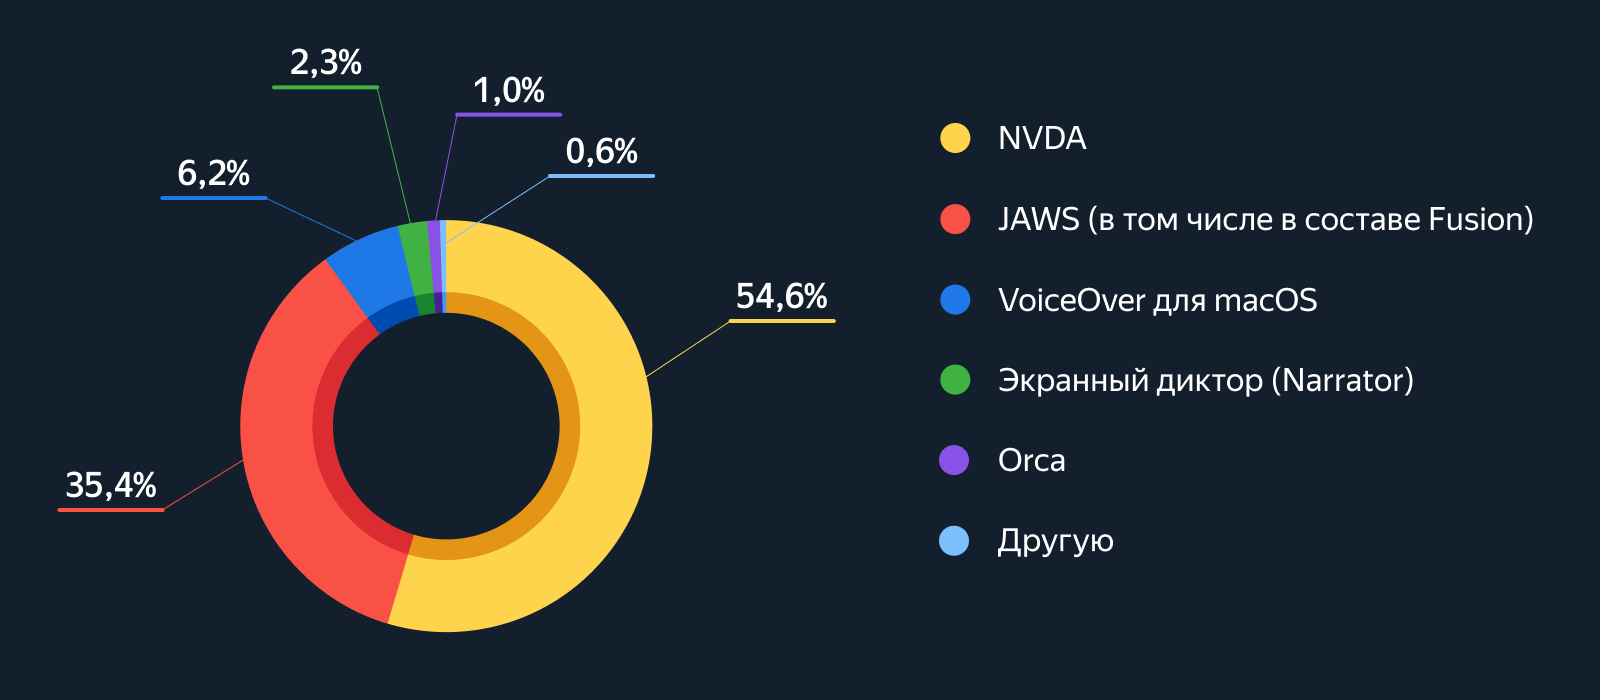
10. Which screen reader do you use as the main (work with it most of the time) on your computer / laptop?
As with browsers, desktop operating systems often have more than one screen reader at the same time, especially on Windows, where there are several such solutions at once and switching between them is quite easy. For this reason, it is important to separate the first choice screen reader from the program that the user only accesses from time to time.
| Answer | Share | Respondents |
|---|---|---|
| NVDA | 54.6% | 284 |
| JAWS (also included with Fusion) | 35.4% | 184 |
| VoiceOver for macOS | 6.2% | 32 |
| Narrator | 2.3% | 12 |
| Orca | 1% | five |
| Another | 0.6% | 3 |
Both of the most popular screen readers are designed for Windows, with NVDA being a free open source solution (in development since 2006), and JAWS being paid proprietary software (since 1995).
For a long time, it was JAWS that remained the most popular program of this class according to surveys of both English- and Russian-speaking blind. In 2019, NVDA surpassed JAWS in screen readers for the first time in English-speaking audience polls. Nevertheless, in surveys of the Russian-speaking audience conducted by Yandex, the transition of leadership from JAWS to NVDA was first recorded back in 2016.
The share of NVDA, as the main screen access program, continues to grow and since 2016 has increased from 49.6% to 54.6%, while the share of JAWS has decreased from 44.6% to 35.4%. Most likely, the trend will continue: NVDA is free and is increasingly developing, including through a powerful ecosystem of add-ons developed by the community.
Also, the use of VoiceOver for macOS as the main screen reader has grown from 3.4% to 6.2%, and the built-in Windows Narrator has received the first users working with it as a main solution since 2016, thanks to the rapid development of its functionality during recent years.
The share of Orca for Linux as the main screen access program among the Russian-speaking blind has remained stably low since 2016, increasing from 0.8% to 1%, but given the low base, these fluctuations are at the level of statistical error.
Inaccurate responses were recorded or moved to the "Other" category during processing, so any other applications of this category do not appear there.
11. What other screen reader programs do you use as additional programs on your computer / laptop besides the one mentioned earlier?

| Answer | Share | Respondents |
|---|---|---|
| NVDA | 34.4% | 179 |
| JAWS (also included with Fusion) | 31.2% | 162 |
| Narrator | 25% | 130 |
| I do not use additional screen readers | 23.7% | 123 |
| VoiceOver for macOS | 5.2% | 27 |
| Orca | 2.9% | fifteen |
| Another | 0.6% | 3 |
Windows built-in Narrator is still rare as a primary screen reader, but has doubled as an additional screen reader since 2016, from 12.6% to 25%. In addition, over the same period, the proportion of users who are completely satisfied with their main screen reader and are not using any additional options increased from 15.2% to 23.7%.
We can also note the disappearance of a number of unpopular solutions for Windows. So, in 2016, 3.2% of respondents used Window-Eyes as additional software, and 0.8% - COBRA. However, distribution of Window-Eyes was discontinued in 2017 after its takeover by developer JAWS a year earlier, and developer COBRA also went bankrupt in 2017, which led to users abandoning these no longer developing screen readers.
Inaccurate responses were recorded or moved to the "Other" category during processing, so any other applications of this category do not appear there.
12. What screen readers do you use on your smartphone / tablet?

| Answer | Share | Respondents |
|---|---|---|
| TalkBack | 71.1% | 372 |
| VoiceOver for iOS | 37.1% | 194 |
| Voice Assistant | 24.7% | 129 |
| Commentary Screenreader | 10.3% | 54 |
| Mobile Speak for Symbian | nine% | 47 |
| Talks | 1.9% | ten |
| Another | 1% | five |
It is noticeable that Android users relatively often use more than one screen reader, although the absolute leader is TalkBack, developed by Google. In second place is Voice Assistant - a fork of TalkBack from Samsung, which is present only in some devices from this manufacturer.
Samsung's solution, which appeared in 2015 (originally called Galaxy TalkBack), was extremely rare at the time of the survey in 2016, but now, thanks to a pre-installation on many devices and some functional advantages over the original TalkBack, it is used by a significant number of blind people.
The ShinePlus screen reader for Android, which played a prominent role, which according to a 2016 survey was used by 32.7% of blind users, almost completely disappeared from the radar after its development was stopped and removed from Google Play.
The Other category includes screen readers such as BlackBerry Screen Reader, BRLTTY, ShinePlus, and some non-specific solutions.
13. How long are you using braille displays?

| Answer | Share | Respondents |
|---|---|---|
| 24, 32, 40 | 58.3% | 28 |
| 12, 14, 18, 20 | 47.9% | 23 |
| 64, 80 | 6.3% | 3 |
The findings show that 9% of blind people also use various braille displays along with screen readers. However, within the framework of this survey, the respondents' belonging to nosological groups was not specified: there is no information on how many respondents use a braille display in addition to speech output, and what - as the only possible channel for obtaining information (deaf-blindness).
In the process of analyzing the comments left in the free-form questionnaire, we identified user complaints about the congestion of modern web interfaces from the point of view of the user of the Braille display. The blocks, which are quite convenient for navigation and interaction through speech synthesis, are still overloaded for the user of the braille display due to the long inscriptions that do not fit on the display line and require additional scrolling to read.
The problem is further compounded by the fact that 47.9% of braille display users use compact devices with line lengths of up to 20 cells. At the same time, a braille display is an extremely expensive device, and its price is determined, first of all, by the length of the line, so the expectation that an interested user can easily switch to a larger display is not constructive.
Today, the mainstream in the field of accessibility is the concept of universal design: the idea of creating a single interface that is accessible to all categories of users. This approach works well for blind people using speech synthesis, since this method of interaction provides a sufficient speed of information processing, including in general-purpose interfaces. However, if a user uses a braille display as the main channel for obtaining information, the creation of a separate simplified interface often looks quite justified: this is the only way to ensure a sufficiently high level of ergonomics.
14. What screen enlargement and image correction programs do you use?

| Answer | Share | Respondents |
|---|---|---|
| Operating system built-in screen magnification function | 96.1% | 49 |
| ZoomText (also included with Fusion) | 9.8% | five |
Throughout the history of surveys, there has been a great commitment of users to built-in solutions for screen enlargement and image correction - 85–86% of the total number of visually impaired respondents, while in 2020 their number increased to 96.1%. Of the third-party solutions used, only ZoomText software for Windows was identified.
However, among all respondents using screen enlargement and image correction software, a whopping 64.7% also use screen readers. Therefore, this sample still has a strong bias towards people with severe visual impairments, which force them at least occasionally to resort to an alternative non-visual way of interacting with interfaces.
15. What self-sounding work environments do you use?

| Answer | Share | Respondents |
|---|---|---|
| Leasey | 39.3% | eleven |
| GuideConnect / Guide | 32,1% | 9 |
| Emacs Emacspeak | 21,4% | 6 |
| LUWRAIN | 17,9% | 5 |
| 14,3% | 4 |
Despite the fact that users of braille displays often objectively need special simplified interfaces, they have very little overlap with the group of users using self-sounding working environments. Only 8.3% of those working with a braille display use self-sounding workspaces. The most likely explanation is the relatively low functionality of support for braille displays in self-sounding work environments, which are mainly focused on speech interaction. As a result, users of braille displays still prefer screen readers over general-purpose software.
The “Other” category was made up of narrow-profile self-sounding applications, voice assistants and some non-specific solutions.
Estimated audience estimate
A frequently asked question is how to estimate the total audience capacity of users with visual impairments. However, specific data are not available for the following reasons:
- Official state statistics are focused on accounting for people according to the general characteristics of having a disability and does not take into account the aspect of the prevalence of the use of information technologies.
- Often open state statistics do not provide information in the context of the causes of disability; therefore, it is difficult to assess even the total number of people with visual impairments.
- Unofficial statistics of individual researchers or public organizations are usually either absent or have insufficient reliability, significantly diverging from data from duplicate sources.
In this regard, the study conducted an independent assessment of the number of people with visual impairments who are active users of information technology. Unfortunately, it turned out to be impossible to obtain a sufficiently complete assessment, therefore, the data obtained will be presented below with a list of the factors influencing them, but without a final interpretation of their weight.
First of all, 86.7% of the respondents live in Russia most of the time. The second most popular main place of residence is Belarus, but there are only 32 such respondents, which seems insufficient given the selected assessment methodology based on the principle of extrapolating the shares of the software used. In addition, 96.6% of respondents use screen readers, so the study considers primarily users with significant visual impairments.
For these reasons, all further analysis was based solely on the data of respondents from Russia using screen readers. The resulting score will only apply to users in this group.
According to the survey results, 97.8% of blind respondents from Russia use stationary computers or laptops, and 96.1% use touchscreen smartphones or tablets. Among personal computer users, 97.6% work with the Windows operating system, and of these, 54.7% use the NVDA screen reader as the main program, and 35.6% as an additional one. It turns out that the NVDA program is used in one way or another by 86.2% of users from the considered group: 52.2% - as the main one, and 34% - as an additional tool for accessing a PC. Based on these data and knowing the total number of NVDA users, it is possible to obtain an approximate estimate of the total number of blind information technology users in Russia.
NVDA is developed by the non-profit organization NV Access from Australia, which has kindly agreed to provide anonymized data on requests to the server from Russia. Yandex would like to thank NV Access for their cooperation and assistance in preparing this part of the study.
Several recent versions of NVDA were accompanied by some instability and loss of compatibility of add-ons, which was caused by the transition from Python 2 to Python 3 and changes in some internal APIs. This led to the refusal of some users to update. The total observed number of users of the first versions of Python 3 is almost half that of Python 2. For this reason, it was decided to take the latest version of Python 2 - NVDA 2019.2.1, released in August 2019, as a guideline.
By May 2020, NVDA version 2019.2.1 was downloaded 6004 times by users from Russia. Thus, as a first approximation, the total number of blind users of information technology in Russia can be estimated at 6965 people. However, there are a number of additional factors that can have a significant impact on this assessment and do not allow it to be accepted as a final one. Here they are.
Factors that may underestimate the estimate:
- NVDA , , NV Access. , Windows, NVDA, .
- NVDA , . , — . , 2020 37,9% NVDA. NVDA .
- NVDA NV Access . , NVDA . 65,1%.
- NVDA download statistics do not take into account users, but work computers, so the estimate may be underestimated if more than one blind person is using the same machine, for example, in the case of a family computer.
Factors that may overestimate:
- NVDA may not be used by a visually impaired person, but, for example, by an ordinary developer testing accessibility.
- NVDA download statistics do not take into account users, but work computers, so the estimate may be overestimated if one blind person works on more than one machine. For example, he simultaneously owns a stationary computer and a laptop.
- There may be a certain number of computers in common use that do not actually belong to any person, but which have NVDA installed. For example, computer labs in schools.
The second and third underestimating factors allow you to make a specific correction and obtain a range of fluctuations in the estimate. If we assume a similar distribution by country in a group of users with an unknown country of residence, and also completely discard those for whom NVDA is not the main program, then the estimate of the number of blind IT users in Russia increases to 18,522 people.
There is no information to assess the impact of other factors on the numerical estimate. This, as well as the lack of objective data on the weights of all of the above factors, makes it difficult to obtain a final assessment of the audience of blind users of information technology in Russia. However, for a number of expert considerations, underestimating factors seem to be more significant, so that the final estimate is closer to the upper limit and, most likely, is in the region of 12-15 thousand people.
In general, our estimate is consistent with general statistics and common sense. In 2017, the total number of visually impaired people in Russia was 80 thousand people... A significant part of them have only a partial loss of vision, therefore they do not apply to the blind. Some of the blind are still not users of information technologies: both because of the relative difficulty of mastering them without sight, with insufficient development of appropriate training programs in rehabilitation centers, and because of the demographic shift of the audience of the blind towards older people who are less interested in IT. ...
Nevertheless, constant work is underway to train the blind to work with information technologies. And in the future, age-related vision loss will happen to the generation that is accustomed to the daily use of computers and smartphones. For this reason, over time, the audience of blind and visually impaired IT users is likely to grow, and it makes sense to think about this in the context of product development right now.
conclusions
Based on the results obtained, the following practically significant conclusions can be drawn for developers, testers and project managers:
- 95%, . , 97%, . (. 1)
- Windows Android. . iOS , . (. 2 5)
- , -, , , - . (. 6)
- -, , Chrome Firefox, Chrome (Android) Safari. Chromium, . (. 3 7)
- desktop- Internet Explorer, . , . « » ( « ») ( IE JavaScript). (. 3)
- :
- - desktop ( ):
- Chrome NVDA Windows
- Firefox NVDA Windows
- Chrome JAWS Windows
- Firefox JAWS Windows
- Internet Explorer JAWS Windows
- Safari VoiceOver macOS
- - ( ):
- Chrome TalkBack Android
- Safari VoiceOver iOS
- Windows ( ):
- NVDA
- JAWS
- / :
- TalkBack Android
- VoiceOver iOS
- VoiceOver macOS
- Orca Linux
- - desktop ( ):
- . «», «». , , . , , . (. 13)
- , — , , .
All of this does not mean that less common operating systems and browsers should not be considered when providing accessibility. This only allows you to more efficiently prioritize when customizing your products, but ideally, availability should be ensured for all possible custom configurations.
English-speaking audience research
Similar studies of the English-language market of assistive technologies for visually impaired users have been conducted by the American company WebAIM since the end of 2008. The last study that was referenced above was in 2019 - Screen Reader User Survey # 8 Results .