Google Sheets → Node.js → Google Charts → Business card site → Top 3 in the search Full name + specialization
Based on the table data, I decided to supplement the business card site with information about publications that would be generated automatically. What I wanted to get:
- An up-to-date summary of publications, located on the Google Charts timeline .
- Automatic generation of output data and links to articles from a google table into an html version of a business card.
- PDF versions of articles from all sites, due to concerns about the closure of some older sites in the future.
You can see how it happened here . Implemented on the Node.js platform using Bootstrap, Google Charts and Google Sheets to store raw data.
Raw data about publications in Google Spreadsheet
Google Spreadsheet LynxReport: Publication accounting contains all source data and analytics for publications. I keep the information on the "Data" tab up to date by manually entering new links to articles, the rest is downloaded for the most part automatically.
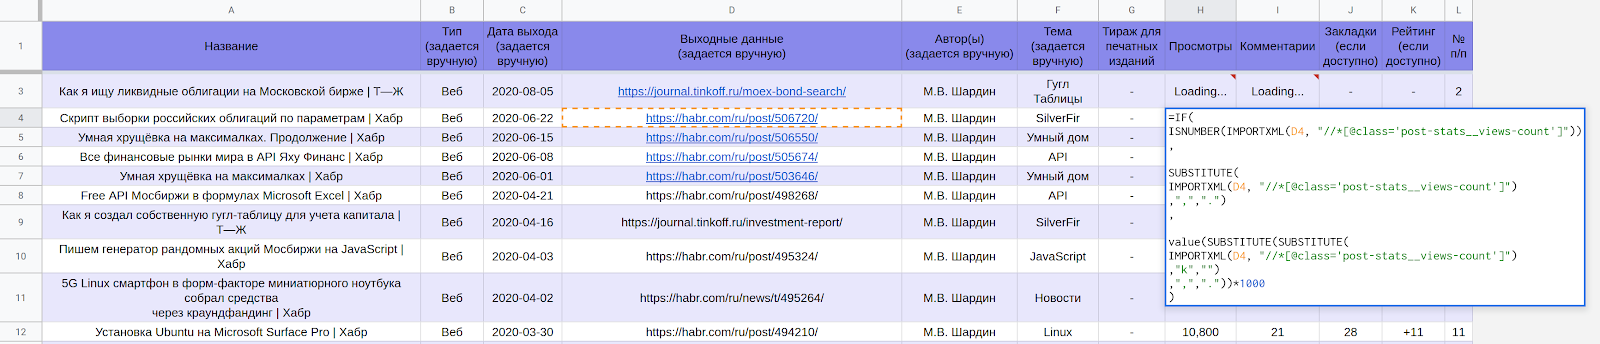
Part of the LynxReport table : accounting for publications with initial data
Actual data on views and comments are loaded through formulas.
For example, to get the number of views from Habr pages in a cell of Google tables, use the formula:
=IF(
ISNUMBER(IMPORTXML(D6, "//*[@class='post-stats__views-count']"))
,
SUBSTITUTE(
IMPORTXML(D6, "//*[@class='post-stats__views-count']")
,",",".")
,
value(SUBSTITUTE(SUBSTITUTE(
IMPORTXML(D6, "//*[@class='post-stats__views-count']")
,"k","")
,",","."))*1000
)
Formulas are not the fastest option and you have to wait about half an hour to get several hundred positions. After the download is complete, you can see all the numbers as in the screenshot below. They provide answers to which topics are popular and which are not.

Part of the LynxReport table : posting with analytics
Reading data from a spreadsheet and converting to Google Charts format
To transform this pivot data from a google spreadsheet into a business card site, I needed to convert the data to the Google Charts timeline format .
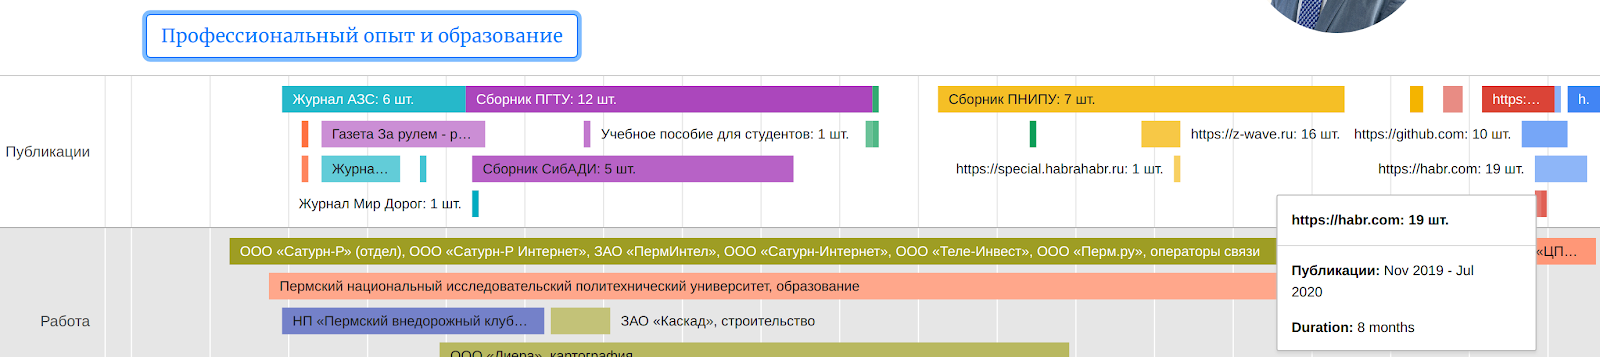
The resulting timeline of Google Charts on the business card site
In order to correctly draw such a chart, the data must be organized as follows:

Data for Google Charts on the business card site in html form
To perform all the transformations automatically, I wrote a script under Node.js that is available on GitHub .
If you are not familiar with Node.js, then in my previous article I described in detail how you can use the script under different systems:
- Windows
- macOS
- Linux
Link with instructions here . The principle is similar.

The work of the script for converting to the desired data format and generating pdf versions of articles from sites (all lines are processed instantly - I specially set a delay to record this video)
In order to read data from a google table in automatic mode, I use key authorization .
You can get this key in the Google Project Management Console : Credentials

in Google Cloud Platform
After the script completes, two text files with html data of the graphs and all pdf copies of online articles should be generated.
I import data from text files into the html code of a business card site.
Generation of pdf copies of articles from sites
Using Puppeteer, I save the current view of articles along with all comments in pdf form.
If you do not set a delay, then several dozen articles on the list can be saved as pdf files in just a few minutes.
And the delay is needed in order for comments to be loaded on some sites ( for example, on - ).
results
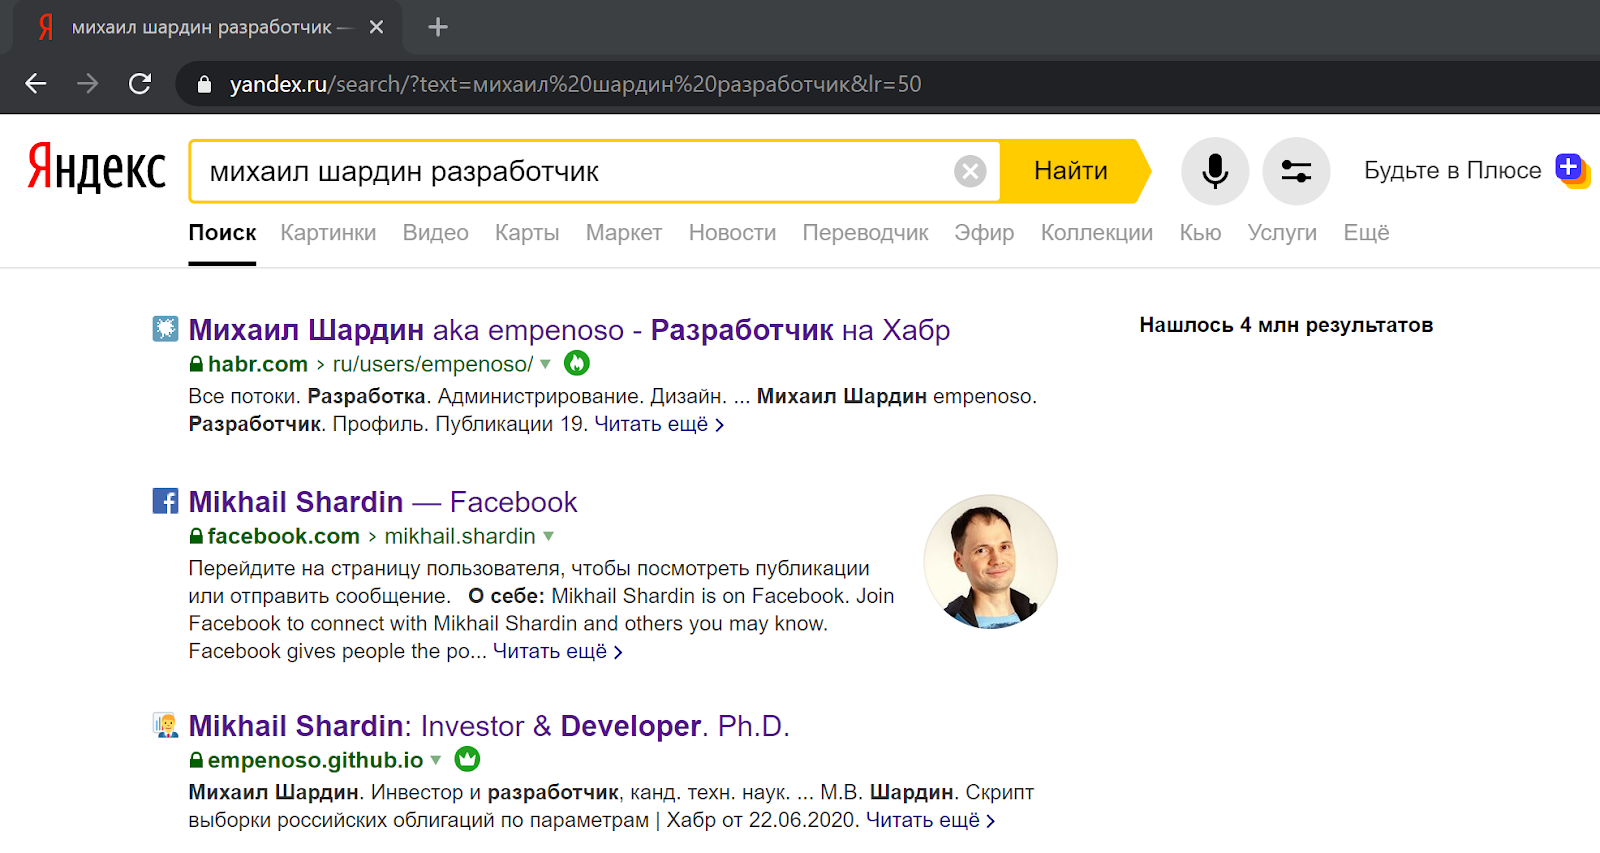
Since the writing of the script was started in order to better match the search algorithms, you can evaluate the results using the search.
Search by name and surname + indication of specialization in both cases returns links to my articles and even a business card site:
In Yandex search results :
In Google search results :

I still cannot decide whether it is worth registering a separate domain name if the business card is empenoso.github.io and so is it at the top of the search?
Instead of a conclusion
- Perhaps this article will make someone think about what he looks like on the Internet.
- Perhaps this article will help someone to establish accounting and organization of publications.
- The source code for the script is located on GitHub .
By: Mikhail Shardin
August 17, 2020