There are many useful tools out there to help you monitor server load, from Linux utilities to specialized services.
Simple Linux utilities show the current memory consumption for each process, CPU load, free disk space and traffic statistics.
In addition, there are paid and free services that monitor the status of your server around the clock, register failures in its operation or network availability, and also check the performance of applications.
Content
- Linux utilities
- Resource usage
- top
- htop
- top
- Network traffic
- nethogs
- IPTraf
- netstat
- nethogs
- Disk space
- df
- du
- Improved versions
- df
- Memory usage
- free
- vmstat
- free
- Resource usage
- Monitoring services
- SolarWinds Server and Application Monitor
- Navicat Monitor
- Zabbix
- SolarWinds Server and Application Monitor
Linux utilities
Resource usage
top
One of the most tools for checking resource usage by processes. The utility
topproduces a simple table with the current resource consumption, where the highest load processes are indicated at the top.
top - 14:45:52 up 29 min, 1 user, load average: 0.10, 0.09, 0.06
Tasks: 56 total, 1 running, 55 sleeping, 0 stopped, 0 zombie
Cpu(s): 0.0%us, 0.3%sy, 0.0%ni, 99.7%id, 0.0%wa, 0.0%hi, 0.0%si, 0.0%st
Mem: 1019600k total, 393756k used, 625844k free, 11136k buffers
Swap: 0k total, 0k used, 0k free, 316748k cached

PID %MEM VIRT SWAP RES CODE DATA SHR nFLT nDRT S PR NI %CPU COMMAND
832 1.3 32364 18m 12m 896 11m 1688 1 0 S 20 0 0.0 bash
820 0.4 89456 83m 4008 488 948 3040 12 0 S 20 0 0.0 sshd
812 0.3 49948 46m 2828 488 616 2216 0 0 S 20 0 0.0 sshd
1 0.2 24192 21m 2108 152 868 1300 23 0 S 20 0 0.0 init
400 0.1 243m 242m 1420 344 216m 1084 0 0 S 20 0 0.0 rsyslogd
Some general statistics are provided immediately before the table, including the average CPU load over the last minute, 5 minutes and 15 minutes. It also shows memory consumption, paging file consumption, and process state.
The list is updated in real time: you can display it on a second monitor and watch it constantly.
htop
Although the utility
topcomes with almost every distribution, an improved version is also available for download in most repositories htop.
Installation
htopon Ubuntu:
apt-get install htopHere we see almost the same output, but with different colors and more interactive output:
CPU[| 0.7%] Tasks: 21, 3 thr; 1 running
Mem[||||||||||||| 64/995MB] Load average: 0.00 0.02 0.05
Swp[ 0/0MB] Uptime: 00:37:37

PID USER PRI NI VIRT RES SHR S CPU% MEM% TIME+ Command
2752 root 20 0 25660 1876 1364 R 0.0 0.2 0:00.06 htop
1 root 20 0 24192 2108 1300 S 0.0 0.2 0:00.55 /sbin/init
312 root 20 0 17224 640 444 S 0.0 0.1 0:00.04 upstart-udev-brid
314 root 20 0 21592 1360 760 S 0.0 0.1 0:00.04 /sbin/udevd --dae
394 messagebu 20 0 23808 688 436 S 0.0 0.1 0:00.01 dbus-daemon --sys
401 syslog 20 0 243M 1420 1084 S 0.0 0.1 0:00.07 rsyslogd -c5
402 syslog 20 0 243M 1420 1084 S 0.0 0.1 0:00.00 rsyslogd -c5
The top is clearer and better organized here.
Here are some keys for better use
htop:
- M : sort processes by memory usage
- P : sort processes by CPU usage
- ? : reference
- k : kill current / marked processes
- F2 : setting (here you can select the options to display)
- / : search for processes
A number of other options are listed in the help and settings. It is worth starting the study of the program from these two sections.
Network traffic
nethogs
nethogsIs the simplest utility to see how much traffic is on each service. On Ubuntu, the utility is installed with the following command:
apt-get install nethogsThen it can be started without keys. The issue is simple:
 PID USER PROGRAM DEV SENT RECEIVED
3379 root /usr/sbin/sshd eth0 0.485 0.182 KB/sec
820 root sshd: root@pts/0 eth0 0.427 0.052 KB/sec
? root unknown TCP 0.000 0.000 KB/sec

TOTAL 0.912 0.233 KB/sec
There are only a few options for changing the output:
- m : switch between kb / s, kb, b, mb
- r : sort by received traffic.
- s : sort by sent traffic
- q : exit
While this is a simple utility, it is great for quickly seeing which applications are generating traffic.
IPTraf
IPTraf- another way to monitor network traffic, with a lot of options. Installation on Ubuntu:
apt-get install iptrafThis utility offers to choose one of the interactive interfaces:
 ???????????????????????????????????
? IP traffic monitor ?
? General interface statistics ?
? Detailed interface statistics ?
? Statistical breakdowns... ?
? LAN station monitor ?
???????????????????????????????????
? Filters... ?
???????????????????????????????????
? Configure... ?
???????????????????????????????????
? Exit ?
???????????????????????????????????
For example, to view all network traffic, select the first menu item:
? TCP Connections (Source Host:Port) ?????????? Packets ??? Bytes Flags Iface ?
??192.241.xxx.xxx:22 > 369 82420 -PA- eth0 ?
??72.43.xxx.xxx:49488 > 381 19860 --A- eth0 ?
? ?
? ?
For IP addresses to be resolved into domains, you need to select the 'Reverse DNS lookups' item in the configuration.
Along with viewing traffic by ports, there is an option to view traffic by service (option 'TCP / UDP service names'). With both options enabled, the output will look something like this:
 TCP Connections (Source Host:Port) ?????????? Packets ??? Bytes Flags Iface ?
??192.241.xxx.xxx:ssh > 151 34924 -PA- eth0 ?
??rrcs-72-43-xxx-xxx.nyc.biz.rr.co:49488 > 155 8108 --A- eth0 ?
? ?
? ?
? ?
? ?
? ?
? ?
? ?
? ?
? ?
? ?
? TCP: 1 entries ???????????????????????????????????????????????? Active ??
????????????????????????????????????????????????????????????????????????????????
? UDP (72 bytes) from 192.241.xxx.xxx:43463 to 8.8.8.8:domain on eth0 ?
? UDP (66 bytes) from 192.241.xxx.xxx:53140 to 8.8.8.8:domain on eth0 ?
? UDP (135 bytes) from 8.8.8.8:domain to 192.241.xxx.xxx:41429 on eth0 ?
? UDP (119 bytes) from 8.8.8.8:domain to 192.241.xxx.xxx:43463 on eth0 ?
? UDP (110 bytes) from google-public-dns-a.googl:domain to 192.241.xxx.xxx:531 ?
There are a few other interfaces you can learn on your own.
netstat
The utility
netstatis a very flexible and powerful tool for collecting network information.
By default, it
netstatgives a list of open sockets:
Active Internet connections (w/o servers)
Proto Recv-Q Send-Q Local Address Foreign Address State
tcp 0 0 192.241.187.204:ssh ip223.hichina.com:50324 ESTABLISHED
tcp 0 0 192.241.187.204:ssh rrcs-72-43-115-18:50615 ESTABLISHED
Active UNIX domain sockets (w/o servers)
Proto RefCnt Flags Type State I-Node Path
unix 5 [ ] DGRAM 6559 /dev/log
unix 3 [ ] STREAM CONNECTED 9386
unix 3 [ ] STREAM CONNECTED 9385
. . .
If add option
-a, it will show a list of all ports:
Active Internet connections (servers and established)
Proto Recv-Q Send-Q Local Address Foreign Address State
tcp 0 0 *:ssh *:* LISTEN
tcp 0 0 192.241.187.204:ssh rrcs-72-43-115-18:50615 ESTABLISHED
tcp6 0 0 [::]:ssh [::]:* LISTEN
Active UNIX domain sockets (servers and established)
Proto RefCnt Flags Type State I-Node Path
unix 2 [ ACC ] STREAM LISTENING 6195 @/com/ubuntu/upstart
unix 2 [ ACC ] STREAM LISTENING 7762 /var/run/acpid.socket
unix 2 [ ACC ] STREAM LISTENING 6503 /var/run/dbus/system_bus_socket
. . .
Flags
-tor -ufilter TCP or UDP connections, respectively. The flag -sdisplays statistics. To constantly update the output, you need to run the command with the key -c.
Disk space
df
The standard utility for viewing information about mounted partitions is
df. It displays a list of connected devices and information about the occupied space.
Filesystem 1K-blocks Used Available Use% Mounted on
/dev/vda 31383196 1228936 28581396 5% /
udev 505152 4 505148 1% /dev
tmpfs 203920 204 203716 1% /run
none 5120 0 5120 0% /run/lock
none 509800 0 509800 0% /run/shm
By default, the output is in bytes, which is not very convenient. The parameter
-hactivates the output in megabytes and gigabytes:
Filesystem Size Used Avail Use% Mounted on
/dev/vda 30G 1.2G 28G 5% /
udev 494M 4.0K 494M 1% /dev
tmpfs 200M 204K 199M 1% /run
none 5.0M 0 5.0M 0% /run/lock
none 498M 0 498M 0% /run/shm
To view the entire space on all disks, add the option
--total.
du
The utility
dfallows you to quickly get a general overview. For more detailed information, a program duthat analyzes the current directory and any subdirectories is better suited . The default output looks like this:
4    ./.cache
8    ./.ssh
28    .
Again, a more readable output is enabled with a key
-h.
Viewing the sizes of files and directories is enabled by the flag
-a, the grand total - by the flags -c(details and amount) and -s(only amount).
Improved versions
The improved versions of df and du are called pydf and ncdu and are installed on Ubuntu with the
apt-get install pydfand commands apt-get install ncdu. They organize beautiful results in pseudo-graphics with colors:
pydf -a
dev/vda 30G 1200M 27G 3.9 [........] /
udev 493M 4096B 493M 0.0 [........] /dev
devpts 0 0 0 - [........] /dev/pts
proc 0 0 0 - [........] /proc
tmpfs 199M 204k 199M 0.1 [........] /run
none 5120k 0 5120k 0.0 [........] /run/lock
none 498M 0 498M 0.0 [........] /run/shm
. . .
ncdu
--- /root ----------------------------------------------------------------------
8.0KiB [##########] /.ssh
4.0KiB [##### ] /.cache
4.0KiB [##### ] .bashrc
4.0KiB [##### ] .profile
4.0KiB [##### ] .bash_historyHere you can navigate the file system using the arrow keys.
Memory usage
free
The easiest way to view the current RAM usage is with the command
free. Output without options looks like this:
 total used free shared buffers cached
Mem: 12286456 11715372 571084 0 81912 6545228
-/+ buffers/cache: 5088232 7198224
Swap: 24571408 54528 24516880
Launching with a key
-mgenerates an output in megabytes.
The middle row
-/+ buffers/cacheshows the amount of used memory minus the sum of buffers / cache, and the amount of free memory plus the sum of buffers / cache.
The fact is that Linux, like most modern OSes, tries to use the maximum amount of available RAM for buffers and cache. Therefore, the second line matters, which shows the real amount of potentially available RAM for applications, if you ignore the buffers and cache. This space will be released automatically if needed for applications.
vmstat
The command
vmstatdisplays various information about the system, including memory, paging file, I / O operations, and CPU load.
procs -----------memory---------- ---swap-- -----io---- -system-- ------cpu-----
r b swpd free buff cache si so bi bo in cs us sy id wa st
1 0 2828 407616 335348 5511476 0 0 26 268 41 27 28 30 42 0 0
The first column
rshows the number of active processes, the second - the number of processes in an uninterruptible wait state.
Columns
siand soshow the amount of memory that is read from and written to the paging file, respectively.
The following shows the number of blocks received or sent to the block I / O device (bi, bo), the number of interrupts per second including timer (in), the number of context switches per second (cs), and CPU statistics: percentage of time spent processing code in user space (us), for processing kernel code (sy), in sleep state (id) and waiting for I / O (wa), as well as time "stolen" from the virtual machine (st), that is, when the virtual CPU waits for the real CPU while the hypervisor is serving another virtual processor.
The flag
-S Mactivates delivery in megabytes. Running with the option -sshows general statistics.
Monitoring services
If you need to monitor the server status around the clock (memory, CPU, free space, performance, response time, etc.), then you can use a free or paid monitoring service. There are many such services, here is a small list in alphabetical order:
- Anturis
- AppDynamics
- AppNeta
- Atera
- BigPanda
- CollectD
- Datadog
- eG Innovations
- Ganglia
- Icinga (free adaptation of Nagios Core)
- Instrumental
- LogicMonitor
- ManageEngine OpManager
- Monitis
- Motadata
- Nagios XI (the free version is called Nagios Core)
- Navicat Monitor
- NinjaRMM
- Op5 Monitor
- OpenNMS
- Pandora FMS
- Panopta
- PRTG Network Monitor
- SeaLion
- Server Density
- Site24x7
- SolarWinds Server and Application Monitor
- Spiceworks Network Monitor (free)
- Stackify
- WhatsUpGold
- Zabbix (free system monitor)
Some monitors are better suited for small businesses, while others are better suited for large companies. Some specialize in monitoring cloud systems. There are services that only run on Linux servers. Systems differ in scalability, feature set, and level of automation. Several monitors are distributed open source.
For example, consider three relatively popular monitoring services.
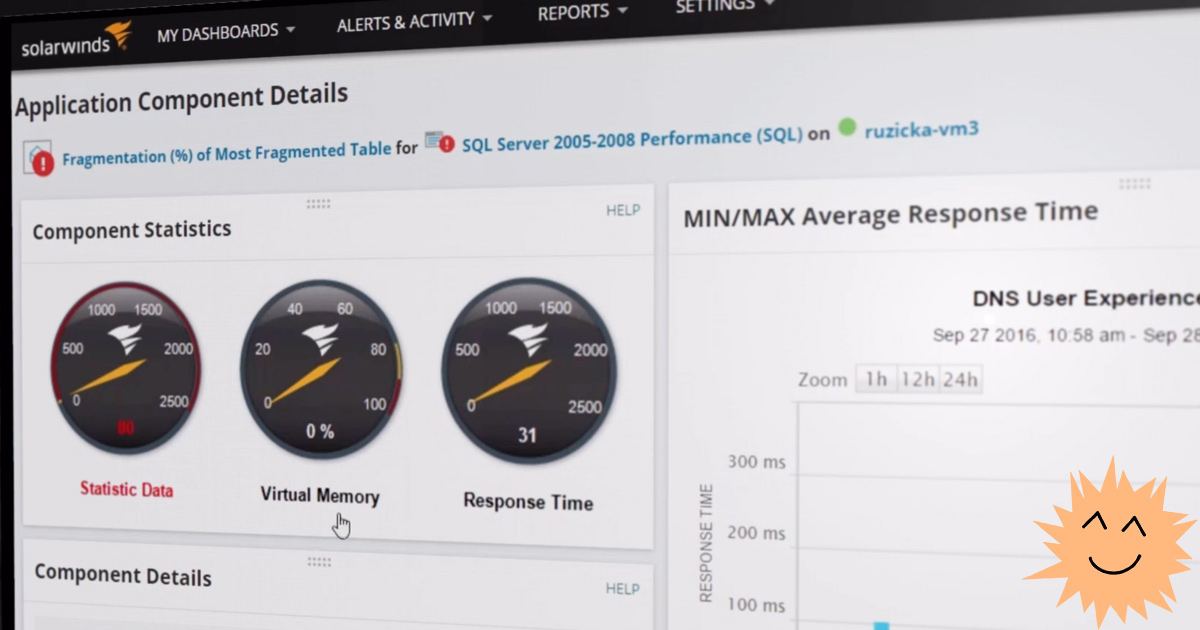
SolarWinds Server and Application Monitor
One of the most advanced server monitors on the market is SolarWinds Server and Application Monitor (SAM). Although the tool only installs on Windows Server 2016+, it can track any hardware, including Linux servers.
The monitor monitors server performance, reports problems, and also provides some management capabilities: it allows you to restart the server, shoot processes and restart services, that is, it is a tool not only for monitoring, but also for administration.

The program is better suited for large corporations. Declared compatibility with Dell PowerEdge, HP ProLiant, IBM eServer xSeries, Dell PowerEdge Blade, HP BladeSystem, Microsoft Windows Server, and VMware vSphere. At the same time, SAM also monitors AWS and Azure cloud instances.
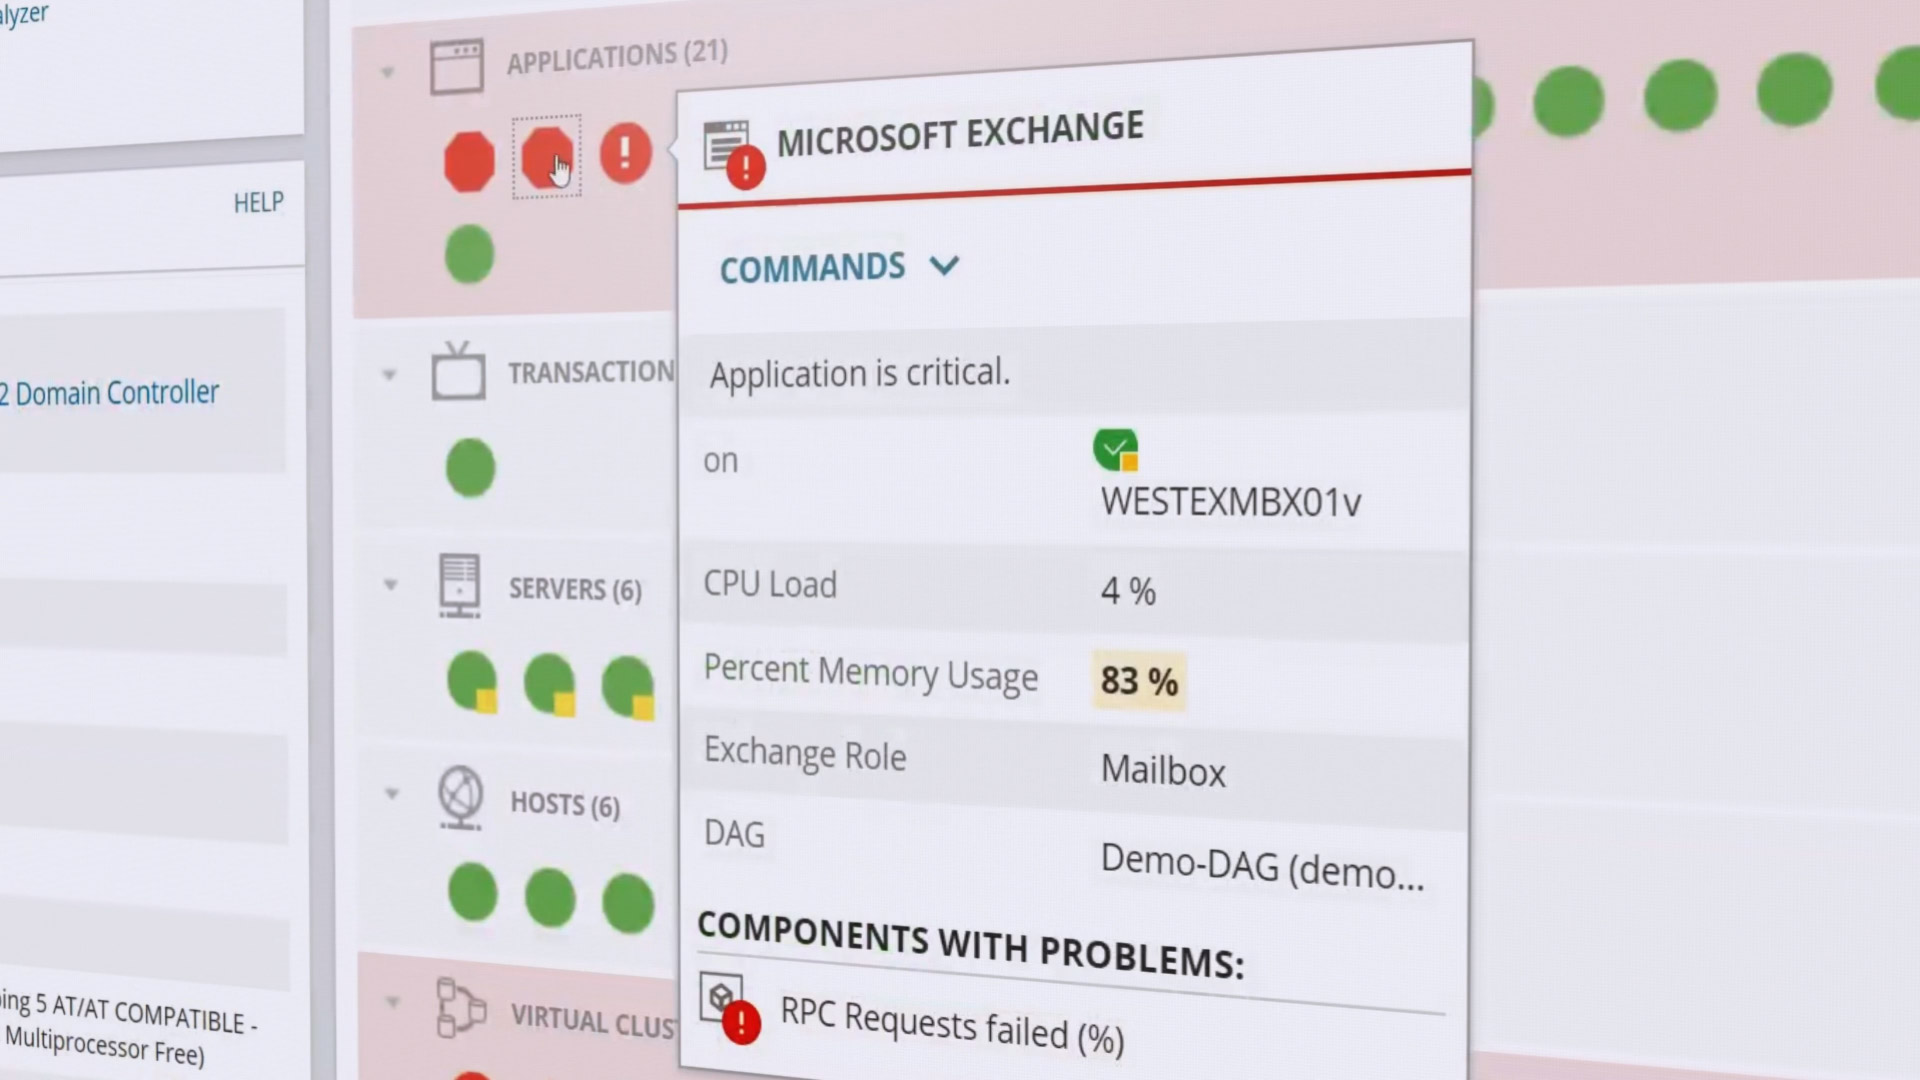
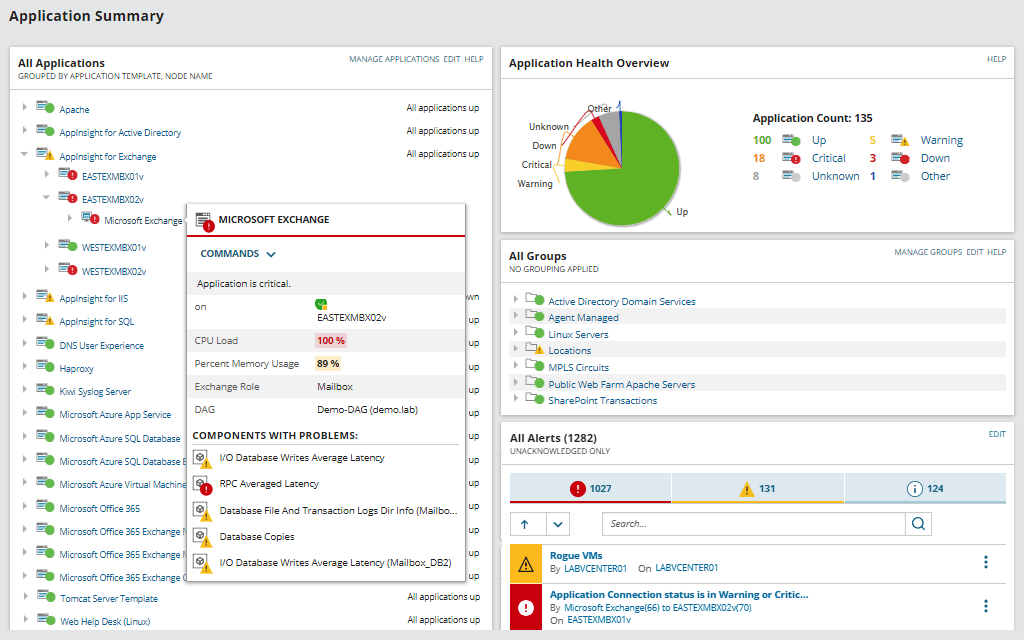
It shows statistics on response time, CPU load, memory, etc. The performance of individual applications is monitored: support for more than 1200 different applications is built-in. It also checks the health of the hardware: CPU utilization, disk load, power supply, fan status, etc. The statuses are color coded from green to red to make it easy to assess the health of the system at a glance.
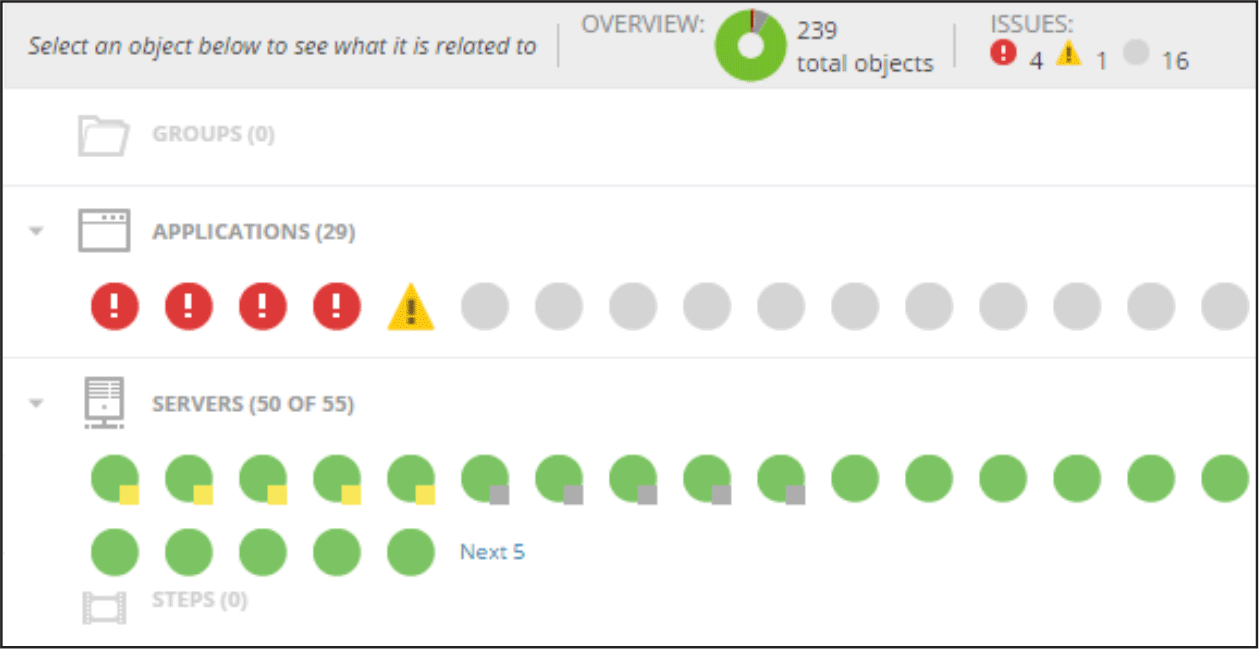
The monitor automatically detects new hardware and software in your cluster, immediately adding it to the dashboard. This is one of the key features of SAM, as well as maximum automation - prepared templates for automating regular monitoring and maintenance tasks, templates for reports and notifications.
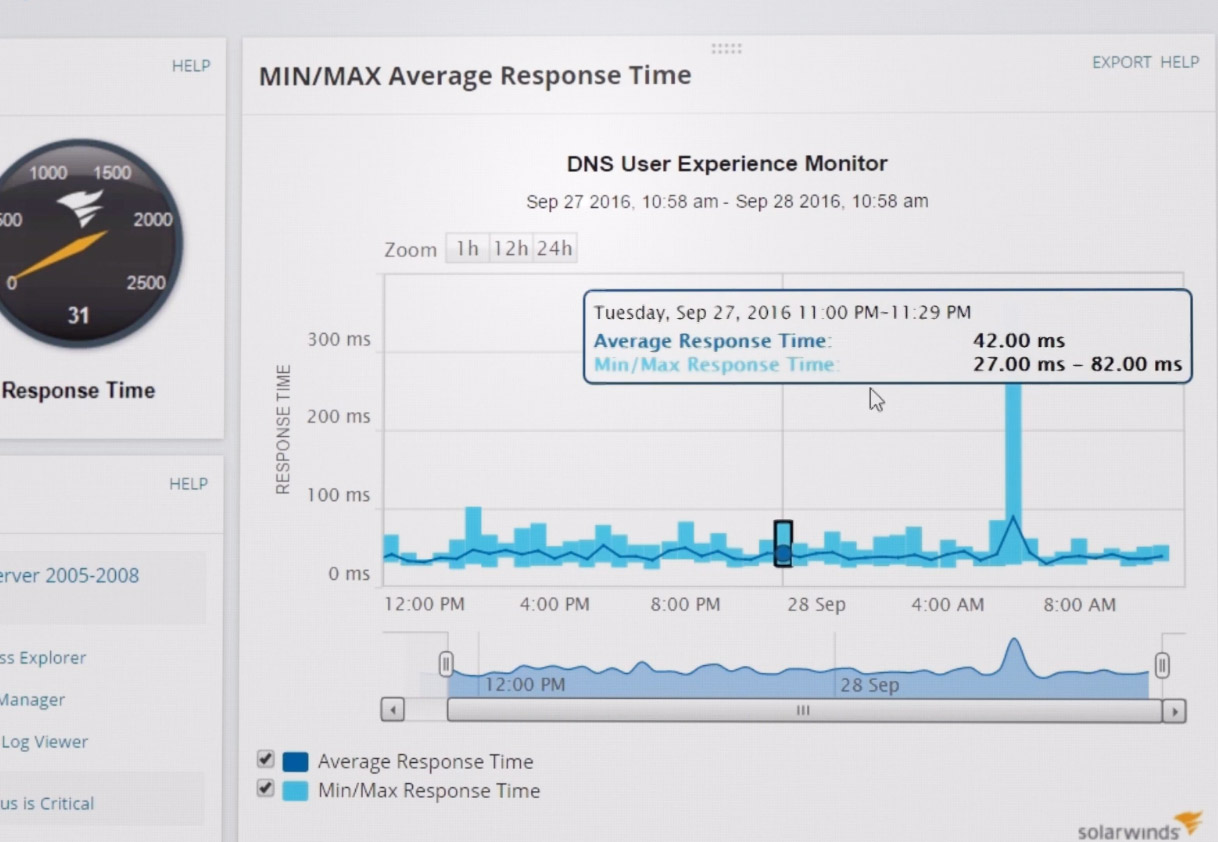
Usually such services have a free trial period, and the cost may depend on the set of used functionality. There is also a trial period here, and the cost of SolarWinds Server and Application Monitor starts at 1275 euros in minimum functionality.
Navicat Monitor
Another example is Navicat Monitor , which specializes in database monitoring. It supports MySQL, MariaDB, SQL Server, as well as cloud-based DBMSs such as Amazon RDS, Amazon Aurora, Oracle Cloud, Google Cloud and Microsoft Azure.

Standard view
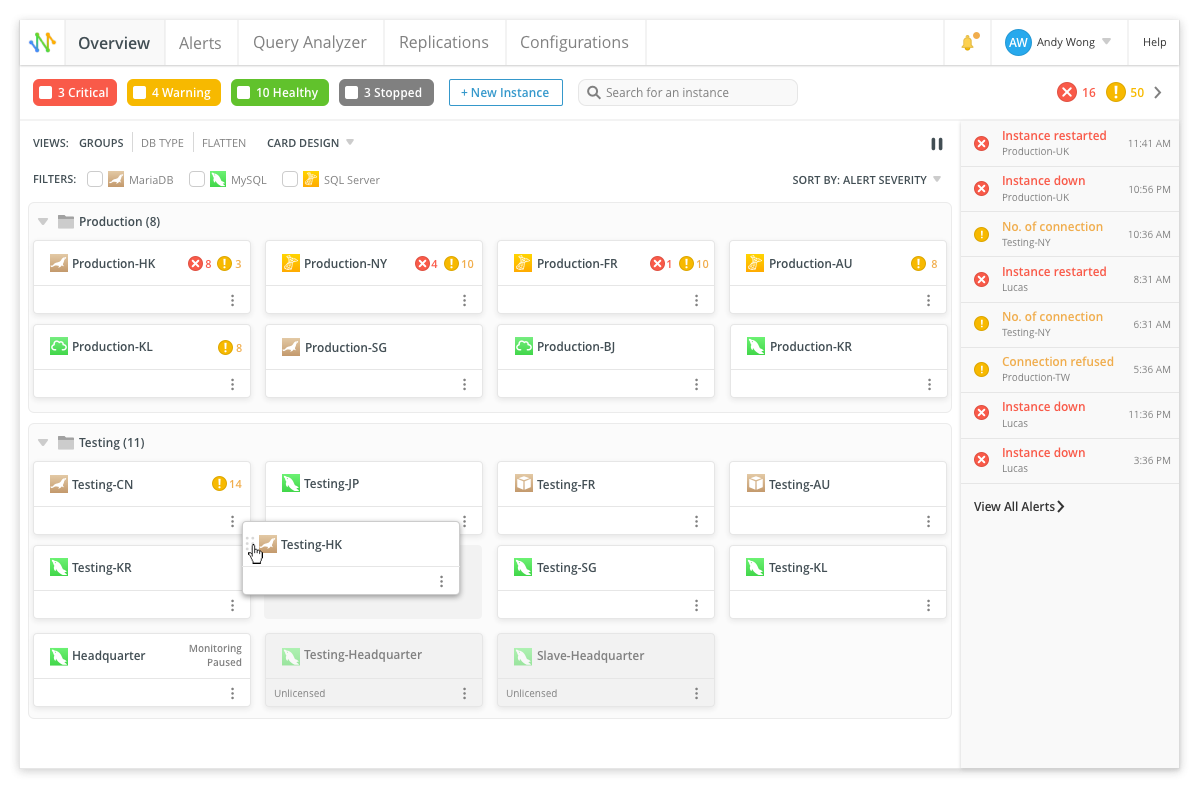
Compact view The
monitor tracks the execution time of specific queries by running them at a specified interval.

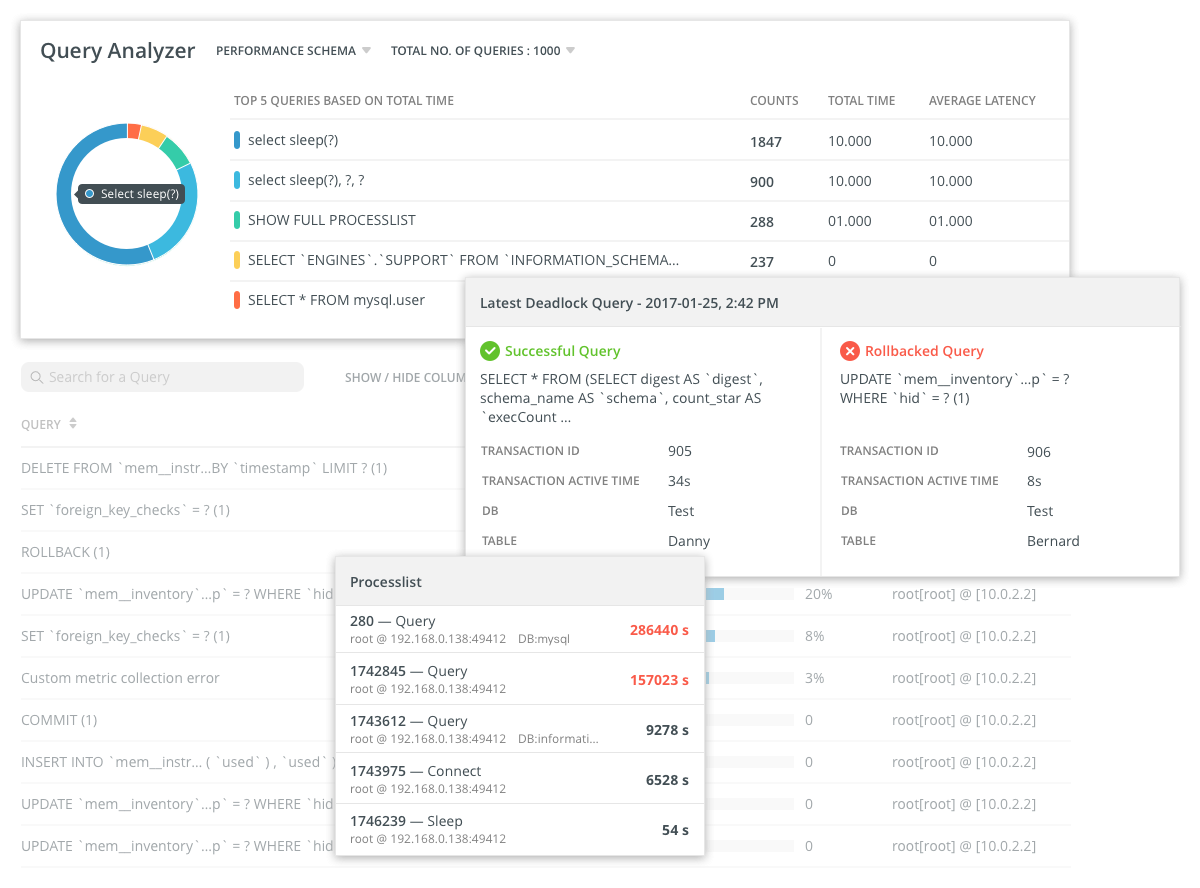
In addition to queries to the database, other queries are periodically sent to servers to monitor the performance indicators of the I / O system, network, etc. Statistics are collected on CPU utilization, memory utilization, and other standard metrics.
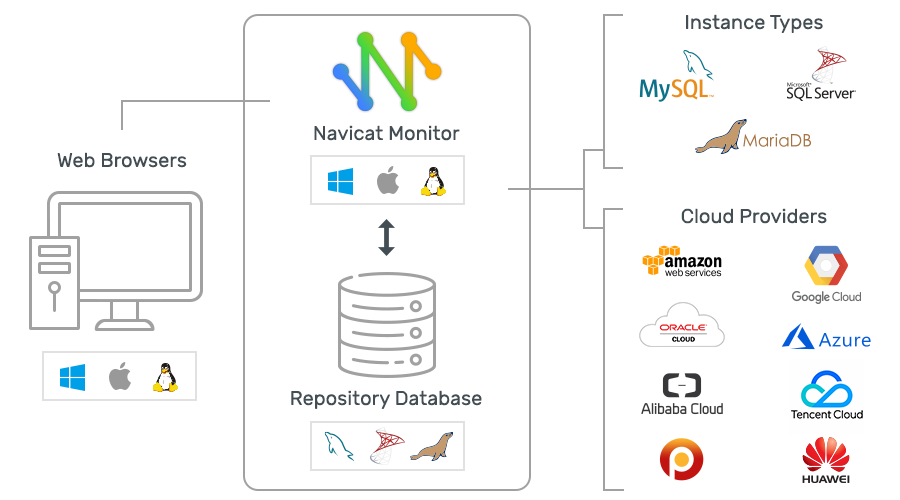
Navicat Monitor architecture does not provide software installation on monitoring objects
The minimum price for Navicat Monitor is $ 32.99 per token per month (one token corresponds to monitoring one server or four Azure bases). There is a fully functional 14-day trial.
Zabbix
Zabbix is a free open source tool that monitors the health of the network, applications and the server itself. Comes with ready-made templates for monitoring popular servers and operating systems, including HP, IBM, Lenovo, Dell, Linux servers, Ubuntu and Solaris. Over the years, Zabbix community has prepared templates for various scenarios.
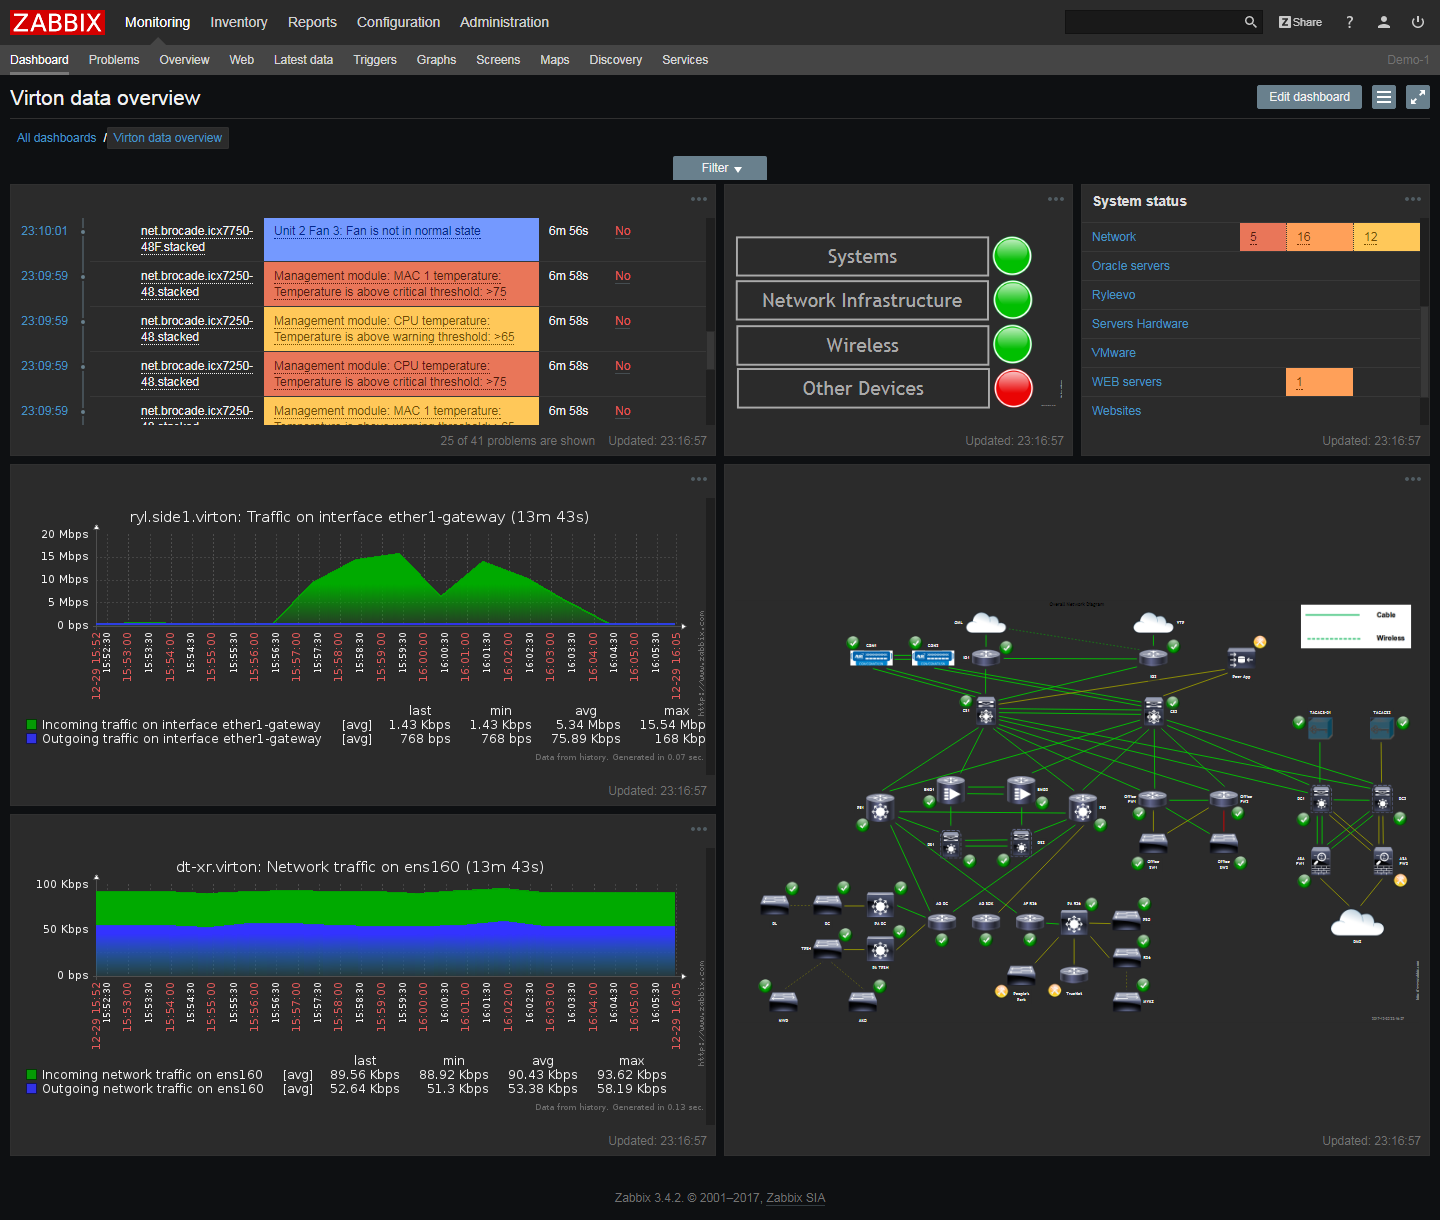
Key Zabbix modules monitor CPU load, memory usage, I / O error rate, free disk space, fan status, temperature and power system characteristics. The network module checks traffic, network availability, packet loss rate, quality of TCP connections and throughput of routers.
Zabbix maintains a list of installed software and firmware versions to signal unauthorized software installations.

The system administrator can program notifications in Zabbix for arbitrary conditions, as well as change the importance of active notifications. On the control panel, you can add users - and send each of them certain types of notifications, and automation scripts allow you to automatically start tasks and assign them to employees.
Thanks to the remote access and management function, Zabbix can be called a good server administration tool.
The only drawback of this system is that if you have added about 1000 servers or more for monitoring, then due to the large number of messages and encryption procedures, Zabbix starts to respond slowly to commands, so this tool is not very suitable for very large companies.
Server monitoring systems differ in functionality ... Not everyone can monitor the health of individual applications, server performance, and response times. But these shortcomings can be corrected with additional tools: for example, analytics and log monitoring systems.
A reliable server for rent and the right choice of a tariff plan will allow you to be less distracted by unpleasant monitoring notifications - everything will work smoothly and with a very high uptime!