
about the project
The client's product is SaaS in the B2B sphere, which operates on a subscription fee format. The user registers, passes authorization, refills his account and uses the service.
Our task is to help the client "collect" analytics. To do this, it was necessary to build call center processes, implement CRM, and “bring together” end-to-end analytics by key indicators.
Process structure
Before doing analytics, you need to prepare a landscape for collecting it: structure sales processes and set up integrations with services. We found several problems in the processes:
- Managers were distracted by unnecessary stages of the sales funnel, and their work was not monitored in any way;
- Sales reports were manually downloaded from the admin panel every day;
- There were few conversion events to collect analytics.
Next, we made a map with the structure of the interaction of all systems.
 It shows what logic the events should follow and at what stages the analyst is going. We take the basic data from the CRM and correlate it with the data on advertising and conversions. Putting it together in myBI, rendering it in Power BI.
Sales funnels
Customer sales were conducted in Enybox CRM, we transferred them to amoCRM for ease of integration. We managed to collect the sales logic into three funnels.
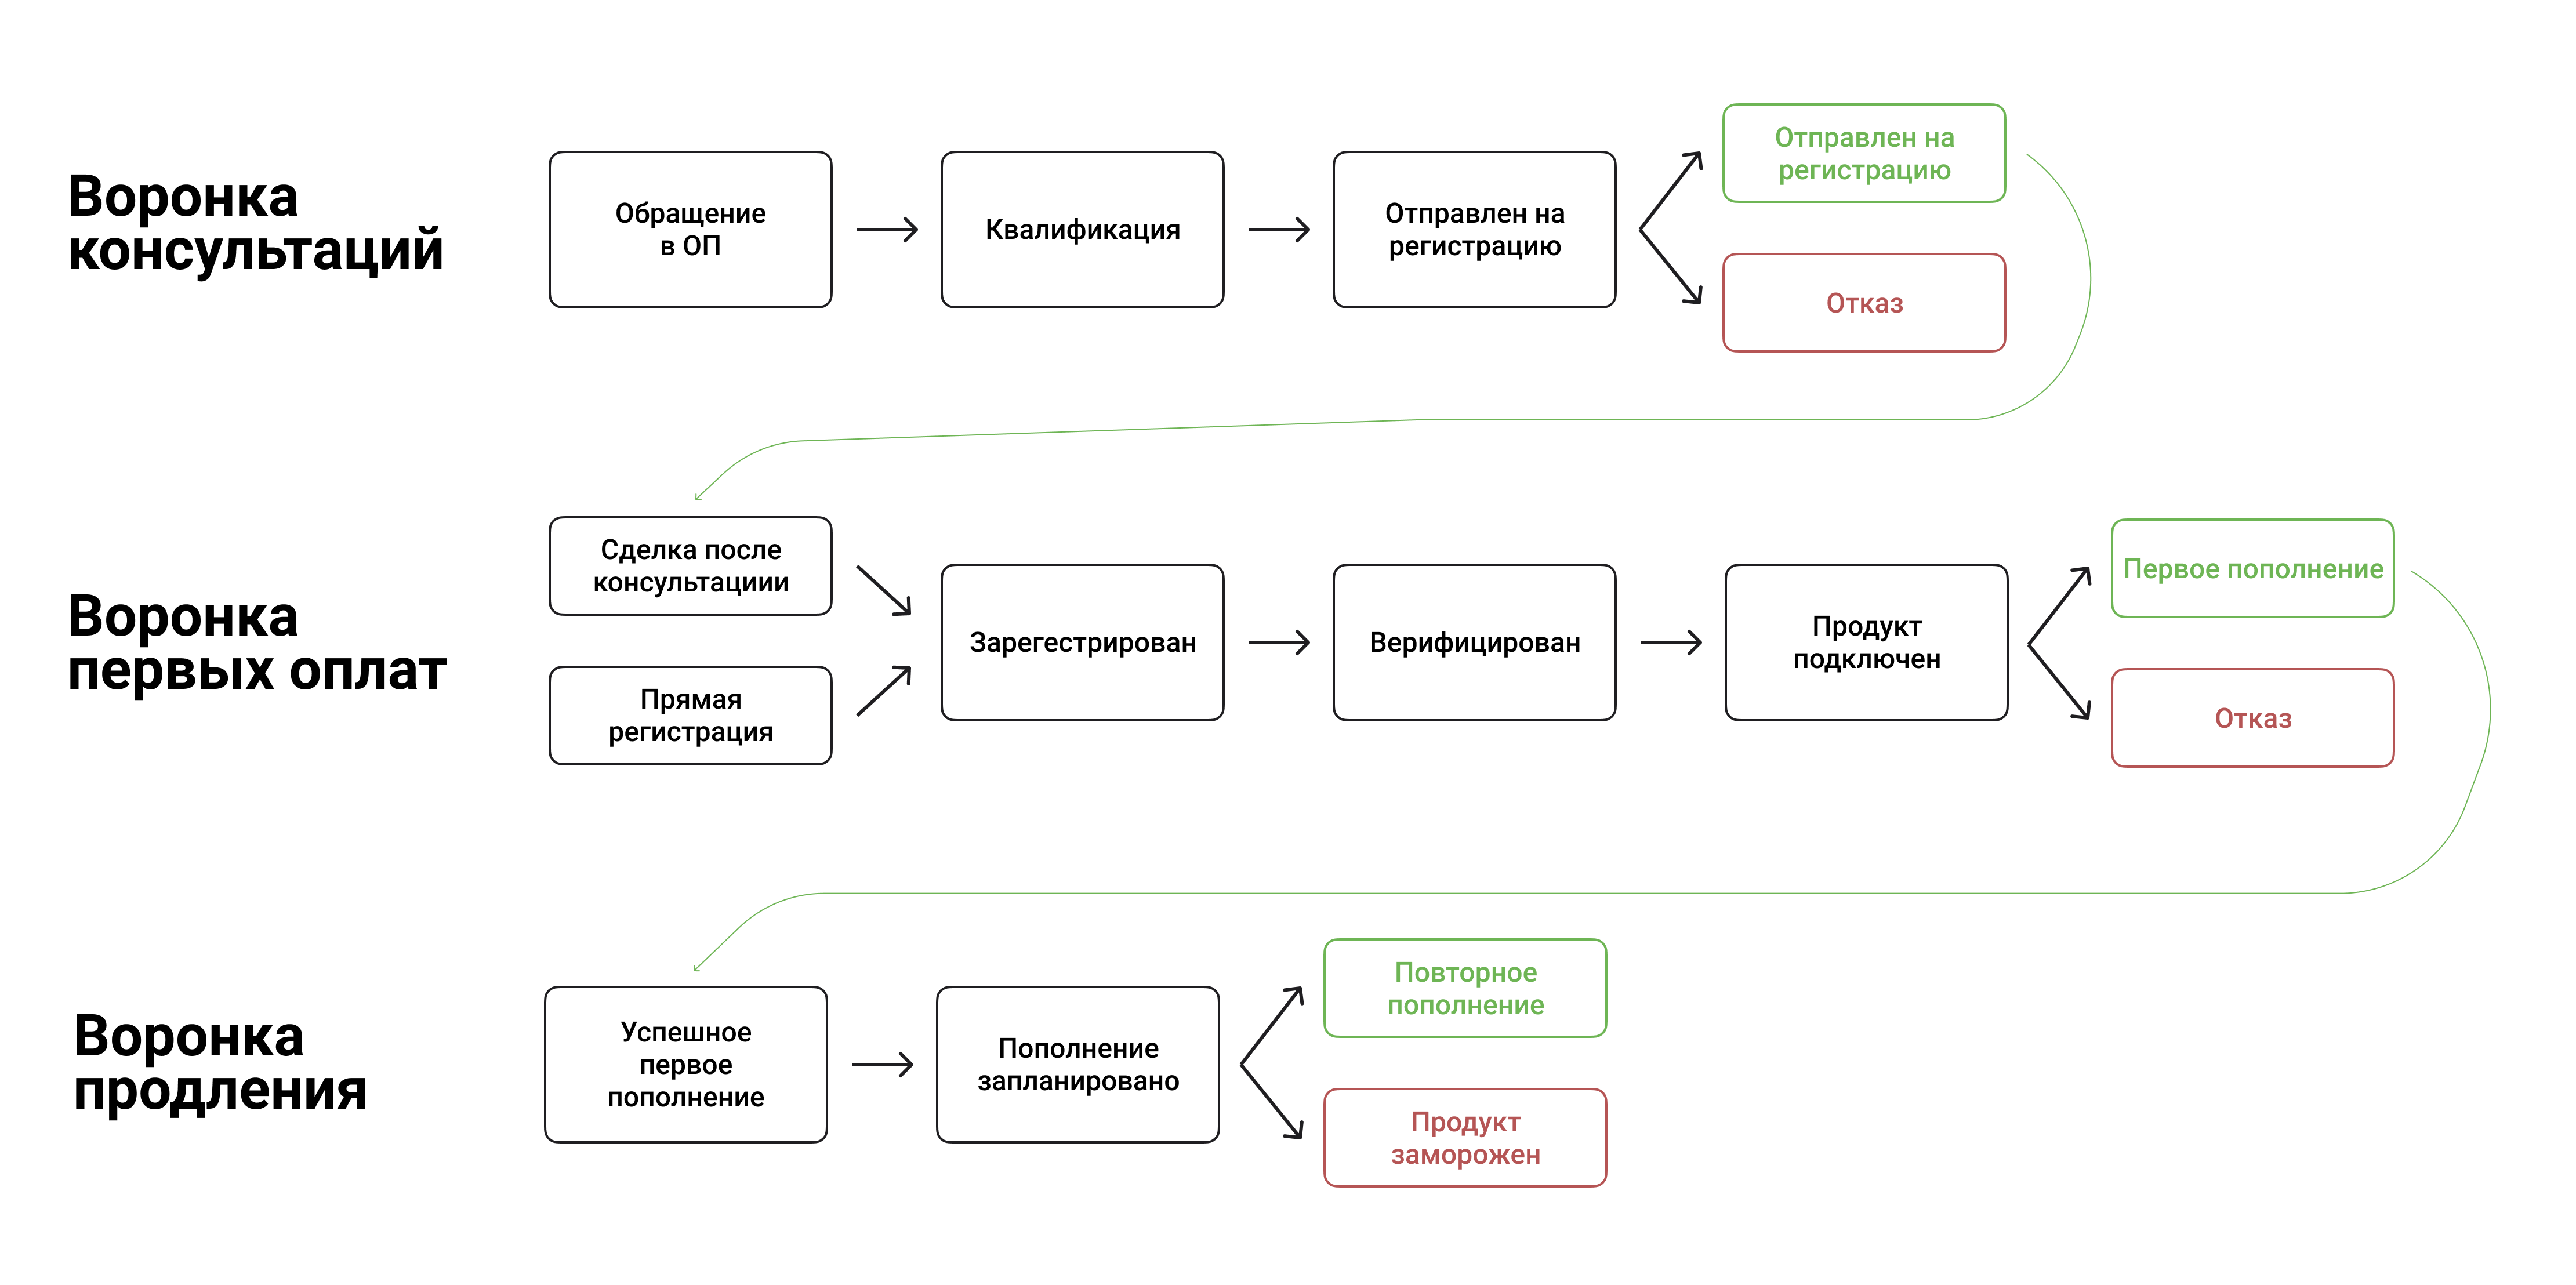
Three successive funnels
The first funnel is consultation. I needed to bring the client to register on the platform. The second funnel is fixing the first payments. Then the user confirmed his registration. And we, in turn, celebrated the moment of payment and each new replenishment.
How analytics was supposed to work
| Initial "events" | Final "events" |
|---|---|
| Feedback form | Feedback form |
| Registration in the service | Registration in the service |
| First deposit | |
| Testing (optional with a small replenishment) | |
| Repeated top-ups | |
| Refusal to use (warming up through the OP) |
For the analytics system to work normally, you need to collect all events = mark conversion actions. Events have already entered the analytics system, but initially there were only two types of them, which is not enough for reports.
Displaying data
 Example dashboard
After collecting data on conversions, it was necessary to make a report from them. The main data visualization tool is Microsoft Power BI.
At the time of conversion, a separate ID was generated on the site to synchronize advertising systems and CRM. By this ID, we linked the data of expenses and income. So we correlated the data and could build reports on it.
Unit economics. Retention
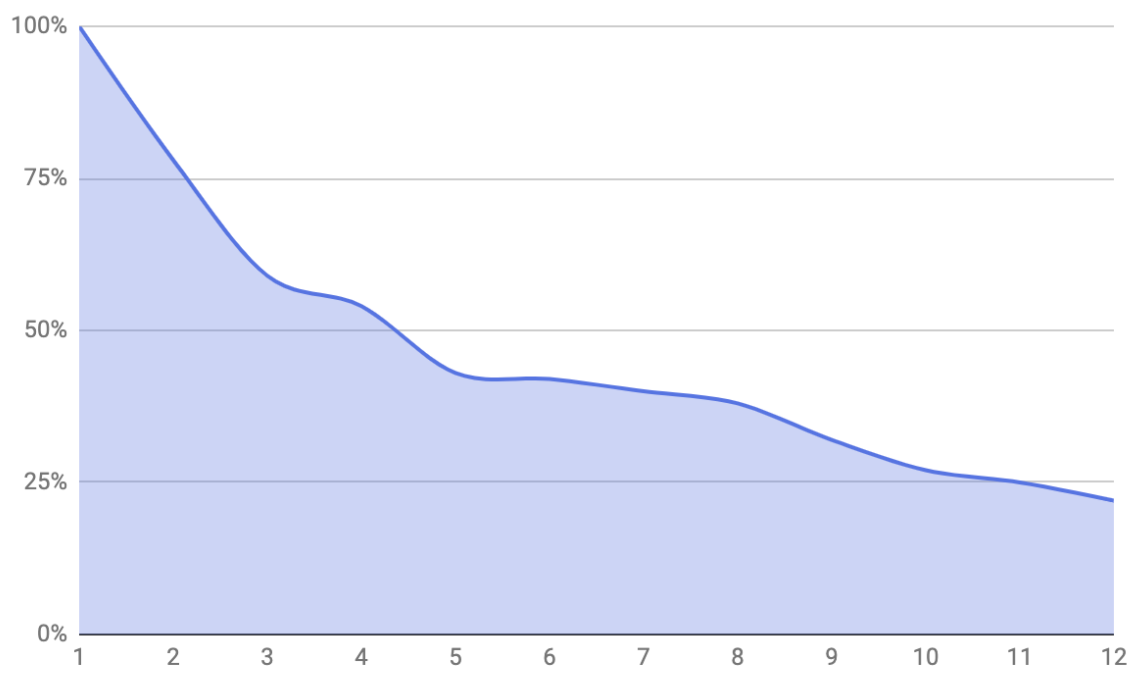
The rolling retention graph of the service from 1 to 12 months of
Retention shows how much users are engaged in the application and how often they return to it. But due to the fact that the service works in the form of replenishment, I had to change this indicator to rolling-retention. It shows the same as retention, but it means that all the time that the user did not replenish the account, he also used the service.
Conversion to the first deposit

The conversion was highly dependent on the number of new customers and the start of their payments. For the first 9 months, we received about 430 new registrations and 90 payments from new users every month. Conversion to purchase per month of registration was 20%, according to data for 12 months.
In addition to standard indicators
There was an opportunity to see analytics on the client's touches both at the moment of a simple transition to the site, and at the time of registration and further payments. We accumulated data to find the most conversion chains: The
user saw the advertisement → went to the site → after a while came in and searched in the context → registered, but did not pay → warmed up with a letter → offered a test drive → tested → the OP “gave the first payment” → 3 years stable payments.
Something went wrong
At the very beginning, the initiators of the project postponed the start until autumn (they applied in the spring). Such "gaps" in the work occurred more than once. But we did not think about it and took it for granted. The main problems were communication and bureaucracy in our client's processes. This is how you can depict the entire time period of work on a project:
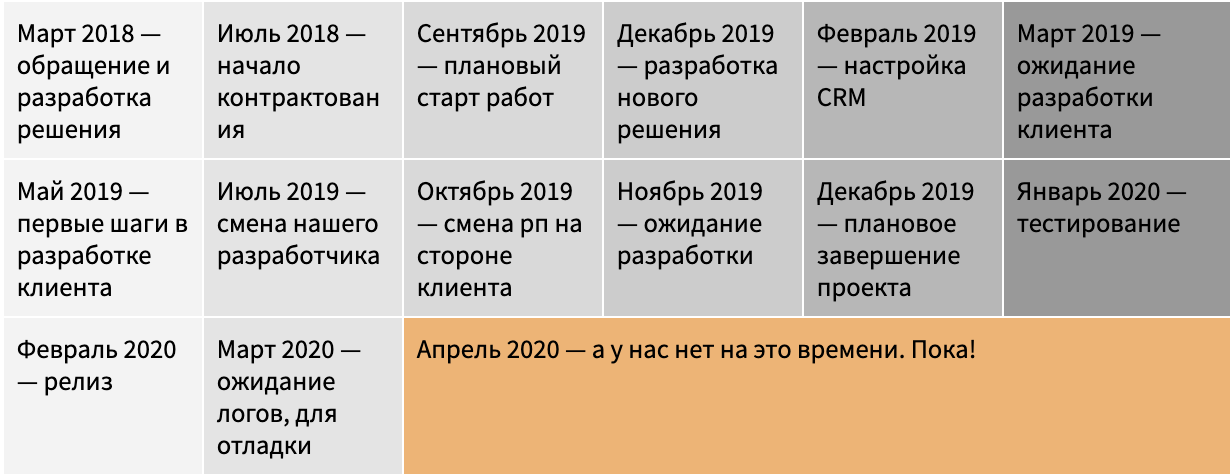
Slow development
The reason for the design gaps was the client's work structure. We worked together with the client's team and some of the tasks could only be performed on his side due to the high security of the processes.
Missed two sprints - lost a month
All the managers and developers on their side worked in two-week iterations. But they constantly put our project last in priority and often our tasks did not fall into the "sprint".
Poor communication and lack of expertise
During the project, the client's manager (stakeholder) has changed five times. Probably everyone knows that feeling when the project you are working on suddenly becomes not interesting to the client. But even that can be solved.
It was more difficult to deal with the incompetence of the stakeholders. One of them was a great executive who knew his product well. But he didn't even understand the basic principles of building sales processes. We spent several meetings to persuade him to remove the stage with the status "How are you?" From the sales funnel.

Imagine a sales funnel like the picture above. At one of the stages, managers need to find out "how the client is doing." What do you think will happen to the conversion analytics of such a funnel?
Managers will find out “how are you” from the client instead of moving him through the funnel, the status is not trivial. It is not obvious when to put it: after the first contact or after qualification. As a result, deals "jump" back and forth along the funnel or just stand, instead of sequential movement.
During the sale process, it is impossible to set intermediate stages in which deals will accumulate. Otherwise, all analytics will turn into a mess, and managers will lose a lot of contacts.
Fakapas from our side
We did not take into account the system bandwidth. For one platform event at the peak, we sent up to 10 requests to amoCRM to execute the logic of business processes.
100,000 events per day * 10 requests to amoCRM = 1,000,000 requests per day
1,000,000 requests per day / 10 requests per second (AMO limit) = 100,000 seconds = ± 27 hours
Result: synchronization will never end
Initially selected amoCRM, as "pass" the limit of requests to the system. But over the course of the development of the project, the requirements and functions have increased and we "ran into" the limit.
We have chosen the wrong tool. AmoCRM is not physically suited to handle a large number of requests.Also, the mistake was that we developed everything on GO, and one specialist was responsible for this. When he left, there was a mountain of legacy code that no one could understand. But, unfortunately, or fortunately, this was not necessary.
All broke again
This case is another example of a project that has been buried in approvals and a heap of unnecessary management.
We lacked technical expertise. To the client - stability in management and desire to bring the project to completion.
But this is experience. Thanks to him, now such tasks look as trivial as possible, and we have already reproduced a similar solution in another project.
How could failure be avoided
In order not to repeat such cases in the future, we have highlighted the aspects that must be observed when working with enterprise clients.
- : ; . , .
- . — . — . . .
- . KPI — .
- Think ahead. Even when developing an MVP, you need to look at the bottlenecks that may arise in the future. The project is always expanding and it is important to provide a structure so as not to rewrite all the code from scratch.
The author of the article is Fyodor Anisimov, LAND PRO marketer.