Journaling is one of those things that is only remembered when they break. And this is not criticism at all. The point is that logs do not make money as such. They provide insight into what programs are (or have been doing), helping to keep things that make us money running. On a small scale (or during development), the necessary information can be obtained simply by displaying messages in
stdout... But as soon as you go to a distributed system, and immediately there is a need to aggregate these messages and send them to some central repository, where they will bring the greatest benefit. This need is even more relevant if you are dealing with containers on a platform like Kubernetes, where processes and local storage are ephemeral.
A familiar approach to processing logs
Since the early days of containers and the publication of the Twelve-Factor manifest , a certain general pattern has formed in the processing of logs generated by containers:
- processes output messages to
stdoutorstderr, -
containerd(Docker) redirects standard streams to files outside of containers, - and the log forwarder tail reads those files (i.e. gets the last lines from them) and sends the data to the database.
The popular log forwarder fluentd is a CNCF project (like containerd). Over time, it became the de facto standard for reading, transforming, transferring, and indexing logs. When you create a Kubernetes cluster on GKE with Cloud Logging (formerly Stackdriver) connected, you will get almost the same pattern - only with Google's fluentd flavor .
It was this pattern that emerged when Olark (the company the author of the article works for - approx. Transl.)first started migrating services to K8s as GKE four years ago. And when we outgrew logging-as-a-service, this pattern was followed, creating our own log aggregation system capable of processing 15-20 thousand lines per second at peak load.
There are reasons why this approach works well and why the 12-Factor principles directly recommend outputting logs to standard streams . The fact is that it allows the application not to worry about log routing and makes containers easily "observable" (we are talking about observability) during development or in production. And if your logging system gets screwed up, at least there is some possibility that the logs will remain on the host disks of the cluster node.
The disadvantage of this approach is that tailing logs is relatively expensive in terms of CPU usage . We began to pay attention to this after, during the next optimization of the logging system, it turned out that fluentd consumes 1/8 of the entire quota of CPU requests in production:
- This is partly due to the cluster topology: fluentd is hosted on each node for tailing local files (like DaemonSet , in K8s language), you have quad-core nodes and you have to reserve 50% of the core for processing logs, and ... well, you get the idea.
- Another part of the resources is spent on word processing, which we also assign to fluentd. Indeed, who would pass up the opportunity to clean up obfuscated log entries?
- The remainder goes to inotifywait , which monitors files on disk, processes reads, and keeps track of.
We wanted to know how much it all costs: there are other ways to send logs to fluentd. For example, you can use forward-port (it is about the use of the type of
forwardin source-. Ca. Perevi.). Will it be cheaper?
Practical experiment
To isolate the cost of fetching log lines using tailing, I put together a small test bed . It includes the following components:
- Python program for creating a certain number of log writers with configurable message frequency and size;
- file for docker compose running:
- fluentd for processing logs,
- cAdvisor for monitoring the fluentd container,
- Prometheus for collecting cAdvisor metrics,
- Grafana for data visualization in Prometheus.
Notes on this diagram:
- Log writers generate messages in a uniform JSON format (which containerd also uses) and can either write them to files or forward them to the fluentd forward port.
- When writing to files, a class is used
RotatingFileHandlerto better simulate cluster conditions. - Fluentd is configured to "throw" all records through
nulland not process regular expressions or check records against tags. Thus, his main job will be to get the log lines. - , Prometheus cAdvisor, fluentd.
The selection of parameters for comparison was carried out rather subjectively. I wrote another utility for estimating the volume of logs that are generated by nodes from our cluster. Not surprisingly, it varies widely: from several tens of lines per second to 500 or more at the busiest nodes.
This is another source of problems: if using a DaemonSet, then fluentd must be configured to handle the busiest nodes in the cluster. In principle, the imbalance can be avoided by assigning appropriate labels to the main log generators and using soft anti-affinity rules to distribute them evenly, but this is beyond the scope of this article. Initially, I planned to compare different mechanisms of "delivery" of logsat a load of 500/1000 lines per second using 1 to 10 log writers.
Test results
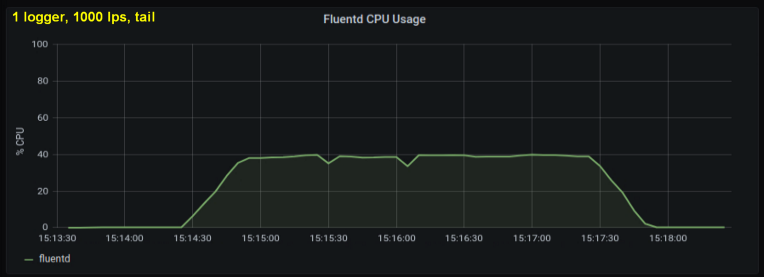
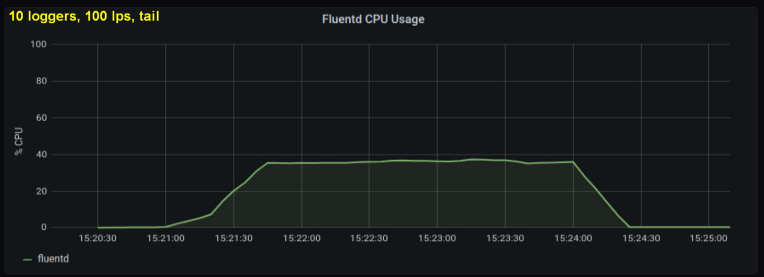
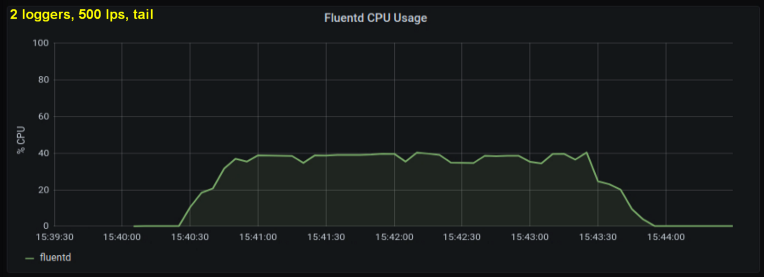
Early tests showed that lines per second were the main contributor to CPU utilization in tailing , regardless of how many log files we observed. The two graphs below compare the load at 1000 p / s from one log writer and from 10. It can be seen that they are almost the same:
A small digression: I did not include the corresponding graph here, but on my machine it turned out that ten log processes writing 100 lines per second has a higher aggregate throughput than a single process writing 1000 lines per second. This may be due to the specifics of my code - I did not deliberately delve into this issue.
In any case, I expected the number of open log files to be a significant factor, but it turned out that it does not really affect the results. Another such insignificant variable is the length of the string. The test above used a standard string length of 100 characters. I made runs with lines ten times longer, but this did not have a noticeable effect on the processor load during the test, which in all cases was 180 seconds.
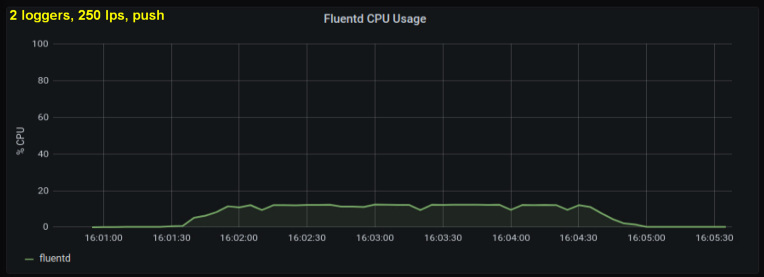
Considering the above, I decided to test 2 writers, since one process, as it seemed to me, was hitting some internal limit. On the other hand, more processes were not needed either. Did tests with 500 and 1000 lines per second. The following set of plots shows the results for both tailing files and the forward port:


conclusions
Over the course of a week, I ran these tests in many different ways and ended up with two key conclusions:
- The forward socket method consumes 30-50% less CPU power than reading lines from log files with the same size. One possible explanation (for at least part of the observed difference) is that by serializing the data in the messagepack - fluentd. fluentd , messagepack. , Python- forward-, . , : , fluentd, .
- , CPU , . tailing', forward-. , (1000 writer' 10 writer'), forward-:


Do these results mean that we should all write logs to the socket instead of files? Obviously, it's not that simple ...
If we could change the way we collect logs so easily, then most of the existing problems would not be problems. Outputting logs
stdoutmakes it much easier to monitor and work with containers during development. Outputting logs in both ways, depending on the context, will greatly increase the complexity - similarly, setting up fluentd to render logs during development (for example, using the output plugin stdout) will increase it .
Perhaps a more practical interpretation of these results would be a recommendation to enlarge the nodes... Since fluentd has to be configured to work with the busiest (noisiest) nodes, it is logical to reduce their number. Combined with an anti-affinity mechanism that would distribute the main log generators evenly, it would be a great strategy. Alas, resizing nodes involves many nuances and tradeoffs that go far beyond the needs of the logging system.
Scale obviously matters too... On a small scale, the inconvenience and added complexity is perhaps not practical. In addition, there are usually more pressing problems. If you're just getting started and the "fresh paint" smell hasn't faded from the engineering process, you can standardize your logging format ahead of time and cut costs by using the socket method without overwhelming developers.
For those who work with large-scale projects, the conclusions of this article are inappropriate, because companies like Google have done a much more thorough and knowledge-intensive analysis of the problem (compared to mine). At this scale, obviously you are deploying your own clusters and can do whatever you want with the logging pipeline (in other words, take advantage of both approaches).
In conclusion, let me anticipate a couple of questions and answer them in advance. First, “Isn't this article about fluentd really? And what does it have to do with Kubernetes in general ? " ... The answer to both sides of this question is: "Well, perhaps ."
- In my general understanding and experience, this tool is a common occurrence when tailing files in Linux in situations where you have a lot of disk I / O. I haven't done tests with another log forwarder like Logstash , but it would be interesting to see the results.
- Kubernetes, CPU, , . , , . , Kubernetes, tailing' Kubernetes-as-a-Service.
Finally, a few words about another consumable resource - memory . Initially, I was going to include it in the article: a specially prepared dashboard for it shows the memory usage of fluentd. But in the end it turned out that this factor is not important. According to the test results, the maximum amount of memory used did not exceed 85 MB, with the difference between individual tests rarely exceeding 10 MB. This rather low memory consumption is obviously due to the fact that I have not used buffered output plugins . More importantly, it turned out to be almost the same for both methods. And the article was already becoming too voluminous ...
It should be noted that there are many more "corners" that you can look into if you want to do more in-depth testing. For example, you can find out in which processor states and system calls fluentd spends the most time, but to do this you have to make the appropriate wrapper for it.
PS from translator
Read also on our blog:
- " Logs in Kubernetes (and not only) today: expectations and reality ";
- " Loghouse 0.3 - a long-awaited update to our Kubernetes logging system ";
- " 7 best practices for operating containers according to Google ."