
As a matter of fact, if you write in any modern language, then, without even knowing it, you passed it through a static analyzer. The point is that any modern compiler provides a tiny set of warnings about potential problems in the code. For example, compiling C ++ code in Visual Studio, you can see the following:
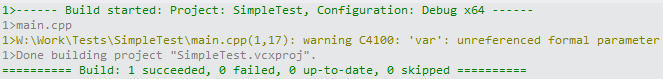
In this output, we see that the var variable was never used anywhere in the function. So in fact, you've almost always used a simple static code analyzer. However, unlike professional analyzers such as Coverity, Klocwork, or PVS-Studio, the warnings provided by the compiler can indicate only a small range of problems.
If you don't know for sure what static analysis is and how to implement it, read this article to learn more about this methodology.
Why static analysis is needed?
In a nutshell: acceleration and simplification.
Static analysis allows you to find a lot of different problems in your code: from misuse of language constructs to typos. For example, instead of
auto x = obj.x;
auto y = obj.y;
auto z = obj.z;
You wrote the following code:
auto x = obj.x;
auto y = obj.y;
auto z = obj.y;
As you can see, there is a typo on the last line. For example, PVS-Studio issues the following warning:
V537 Consider reviewing the correctness of 'y' item's usage.
If you want to poke your hands into this error, then try a ready-made example on the Compiler Explorer: * click *.
And as you understand, it is not always possible to pay attention to such parts of the code right away and because of this you can sit down for debugging for a good hour, wondering why everything works so strangely.
However, this is a clear mistake. But what if the developer wrote sub-optimal code due to the fact that he forgot some subtlety of the language? Or even allowed undefined behavior in the code? Unfortunately, such cases are completely commonplace, and the lion's share of the time is spent debugging specific working code that contains typos, typical errors or undefined behavior.
It is for these situations that static analysis appeared. This is an assistant for the developer who will point out various problems in the code and explain in the documentation why it is not necessary to write this way, what it can lead to and how to fix it. Here's an example of how it might look: * click *.
You can find more interesting errors that the analyzer can detect in the articles:
- Top 10 errors in C ++ projects in 2019
- Top 10 mistakes in C # projects of 2019
- Top 10 bugs in Java projects of 2019
Now, after reading this material and convinced of the usefulness of static analysis, you might want to put it to the test. But where do you start? How do I integrate a new tool into an ongoing project? And how to introduce the team to him? You will find answers to these questions below.
Note. Static analysis does not replace or negate such a useful thing as code reviews. It complements this process by helping to notice and correct typos, inaccuracies, and dangerous constructions in advance. It's much more productive to focus on algorithms and code clarity when reviewing code, rather than looking for a misplaced parenthesis or reading boring comparison functions .
0. Getting to know the instrument
It all starts with a trial version. Indeed, it is difficult to decide to implement something in the development process if you have never seen the tool live before. Therefore, the first step is to download the trial version .
What you will learn at this stage:
- What are the ways to interact with the analyzer;
- Is the analyzer compatible with your development environment;
- What problems are there in your projects now.
After you have installed everything you need, the first step is to run an analysis of the entire project ( Windows , Linux , macOS ). In the case of PVS-Studio in Visual Studio, you will see a similar picture:
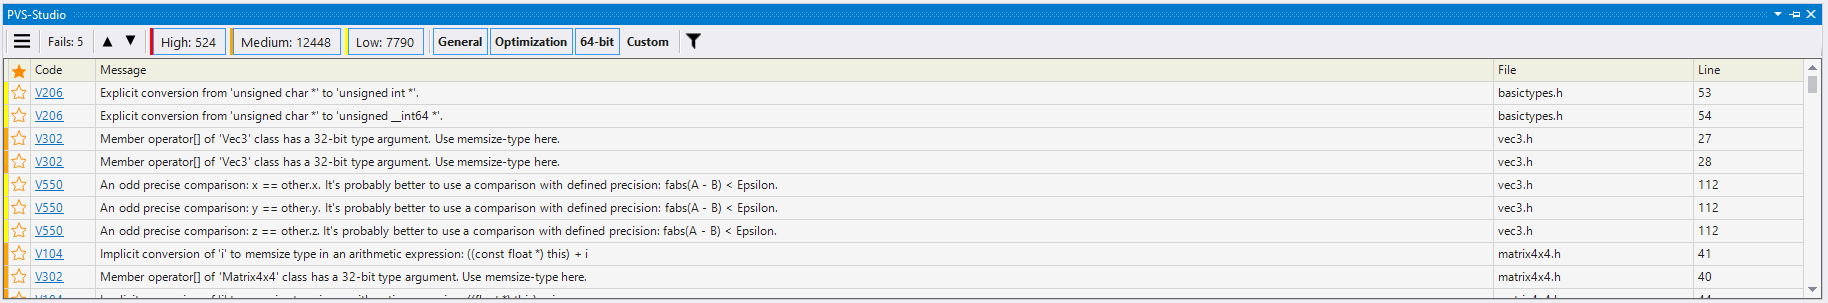
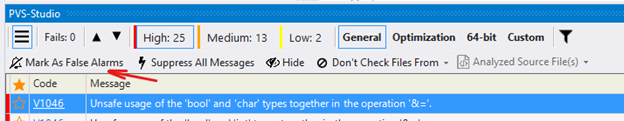
The point is that usually static analyzers issue a huge number of warnings for projects with a large code base. There is no need to fix all of them, since your project is already working, which means these problems are not critical. However, you can look at the most interesting warningsand fix them if necessary. To do this, you need to filter the output and leave only the most reliable messages. In the PVS-Studio plugin for Visual Studio, this is done by filtering by error levels and categories. For the most accurate output, leave only High and General enabled :
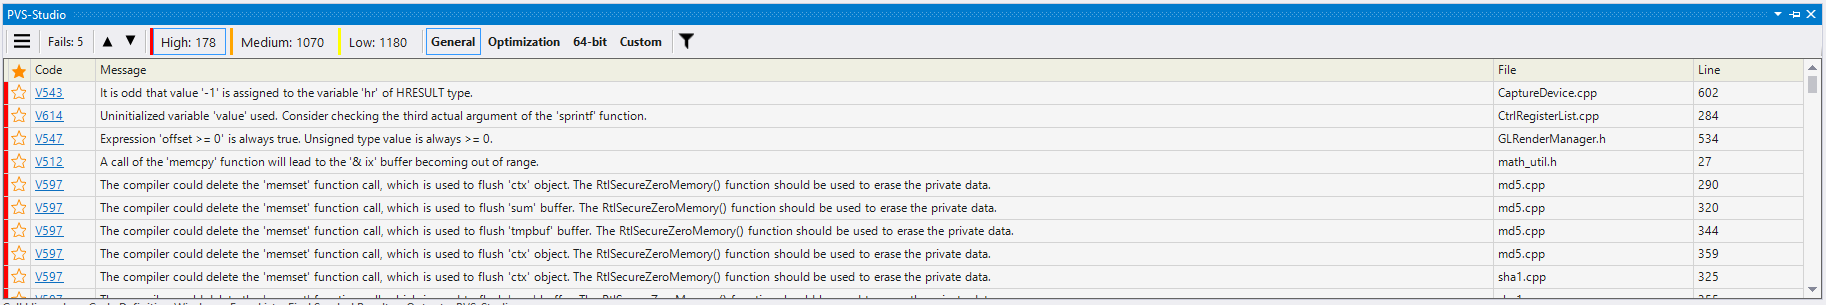
Indeed, 178 warnings are much easier to view than several thousand ... Good warnings are often found in the Medium and Low
tabs , however, these categories include those diagnostics that have less accuracy (reliability). More information about warning levels and options for working under Windows can be found here: * click *.
After successfully reviewing the most interesting errors (and successfully fixing them), it is worth suppressing the remaining warnings . This is to ensure that new warnings are not lost among old ones. Moreover, a static analyzer is a programmer's helper, not a list for bugs. :)
1. Automation
After meeting, it's time to configure plugins and integrate into CI. This must be done before programmers start using the static analyzer. The point is that a programmer may forget to turn on analysis or not want to at all. To do this, you need to do some final verification of everything so that unverified code cannot get into the general development branch.
What you will learn at this stage:
- What automation options does the tool provide;
- Is the analyzer compatible with your build system?
Since there is no perfect documentation, sometimes you have to write to support . This is fine and we are happy to help you. :)
Now let's get down to continuous integration (CI) services. Any analyzer can be embedded in them without any major problems. To do this, you need to create a separate stage in the pipeline, which is usually found after assembly and unit tests. This is done using various console utilities. For example, PVS-Studio provides the following utilities:
- PVS-Studio_Cmd.exe (analysis of solutions, C #, C ++ projects on Windows)
- CLMonitor.exe (compilation monitoring)
- pvs-studio-analyzer (analysis of C ++ projects on Linux / macOS)
- pvs-studio-dotnet (analysis of solutions, C # projects on Linux / macOS)
- pvs-studio.jar (analysis of Java projects)
- PlogConverter (log file converter)
To integrate analysis into CI, you need to do three things:
- Install the analyzer;
- Run analysis;
- Deliver results.
For example, to install PVS-Studio on Linux (Debian-base), you need to run the following commands:
wget -q -O - https://files.viva64.com/etc/pubkey.txt \
    | sudo apt-key add -
sudo wget -O /etc/apt/sources.list.d/viva64.list \
  https://files.viva64.com/etc/viva64.list

sudo apt-get update -qq
sudo apt-get install -qq pvs-studio
On Windows systems, it is not possible to install the analyzer from the package manager, but it is possible to deploy the analyzer from the command line:
PVS-Studio_setup.exe /verysilent /suppressmsgboxes
/norestart /nocloseapplications
You can read more about deploying PVS-Studio on Windows systems * here *.
After installation, you need to run the analysis directly. However, it is recommended to do this only after compilation and tests have passed. This is because static analysis usually takes twice as long as compilation.
Since the launch method depends on the platform and the specifics of the project, I will show the C ++ (Linux) option as an example:
pvs-studio-analyzer analyze -j8 \
                            -o PVS-Studio.log
plog-converter -t errorfile PVS-Studio.log --cerr -w
The first command will perform the analysis, and the second will convert the report into text format, display it on the screen and return a return code other than 0 in case of warnings. This mechanism is useful for blocking an assembly in the presence of error messages. However, you can always remove the -w flag and not block the assembly containing the warnings.
Note. Text format is inconvenient. It is just an example. Pay attention to the more interesting report format - FullHtml. It allows you to navigate through your code.
You can read more about setting up analysis on CI in the article " PVS-Studio and Continuous Integration " (Windows) or " How to set up PVS-Studio in Travis CI"(Linux).
Okay, you have configured the analyzer to work on the build server. Now, if someone has uploaded unverified code, the verification stage will fall and you will be able to detect the problem, but this is not very convenient, since it is more efficient to check the project not after how the branches were merged, and before it, at the pull request stage.
In general, setting up the analysis of a pull request does not differ much from the usual launch of analysis on CI. Except for the need to get a list of changed files. Usually they can be obtained by requesting the difference between branches using git:
git diff --name-only HEAD origin/$MERGE_BASE > .pvs-pr.listNow you need to pass this list of files to the analyzer. For example, in PVS-Studio this is implemented using the -S flag :
pvs-studio-analyzer analyze -j8 \
                            -o PVS-Studio.log \
                            -S .pvs-pr.list
You can learn more about the analysis of pull requests * here *. Even if your CI is not in the list of services mentioned in the article, the general section on the theory of this type of analysis will be useful to you.
By configuring the analysis of pull requests, you can block commits containing warnings, thereby creating a boundary that unverified code cannot cross.
This is all well and good, but I would like to be able to view all warnings in one place. Not only from a static analyzer, but also from unit tests or from a dynamic analyzer. There are various services and plugins for this. PVS-Studio, for example, has a plugin for integration into SonarQube .
2. Integration on developers' machines
Now it's time to install and configure the analyzer for everyday development use. At this point, you have already become familiar with most of the ways of working, so this can be called the easiest part.
As the simplest option, the developers can install the required analyzer themselves. However, this will take a long time and distract them from development, so you can automate this process using the installer and the necessary flags. There are various flags for PVS-Studio for automated installation . However, there are always package managers like Chocolatey (Windows), Homebrew (macOS) or dozens of options for Linux.
Then you will need to install the necessary plugins, for example, for Visual Studio , IDEA ,Rider etc.
3. Daily use
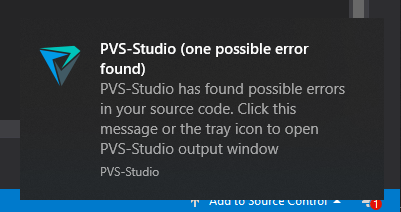
At this stage, it's time to say a few words about ways to speed up the analyzer's work in daily use. A complete analysis of the entire project takes a very long time, but how often do we change the code at once in the whole project? There is hardly such a large-scale refactoring that it will immediately affect the entire codebase. The number of files being changed at a time rarely exceeds ten, so it makes sense to analyze them. For such a situation, there is an incremental analysis mode . Just don't be alarmed, this is not another tool. This is a special mode that allows you to analyze only changed files and their dependencies, and this happens automatically after building, if you are working in the IDE with the plugin installed.
If the analyzer detects problems in the recently changed code, it will report it on its own. For example, PVS-Studio will tell you about this using a notification: It
goes without saying that it is not enough to tell the developers to use the tool. We need to somehow tell them what it is and how it is. For example, here are articles about quick start for PVS-Studio, but you can find similar tutorials for any tool you prefer:
- How to run PVS-Studio on Windows (C, C ++, C #)
- How to run PVS-Studio on Linux and macOS (C, C ++)
- How to start PVS-Studio Java
Such articles provide all the information necessary for everyday use and do not take much time. :)
Even at the stage of getting to know the tool, we suppressed a lot of warnings during one of the first launches. Alas, static analyzers are not ideal, so they give false positives from time to time. It is usually easy to suppress them, for example, in the PVS-Studio plugin for Visual Studio, it is enough to click one button:
However, you can not only suppress them. For example, you can report a problem to support. If it is possible to fix false positives, then in future updates you may notice that every time there are fewer and fewer false positives specific to your codebase.
After integration
So we went through all the stages of integrating static analysis into the development process. Despite the importance of setting up such tools in CI, the developer's computer is the most important place to start. After all, a static analyzer is not a judge who says somewhere far from you that the code is worthless. On the contrary, it is an assistant who prompts you if you are tired and reminds you if you have forgotten about something.
However, without regular use, static analysis is unlikely to greatly simplify development. After all, its most important benefit for the developer lies not so much in finding complex and controversial code sections, but in their early detection. Agree that it is not only unpleasant to find a problem when the edits have gone for testing, but also very long. Static analysis, when used regularly, looks at every change right on your computer and reports suspicious places while working on the code.
And if you or your colleagues are still not sure whether it is worth implementing the analyzer, then I suggest that you proceed to reading the article " Reasons to Implement the PVS-Studio Static Code Analyzer in the Development Process". It addresses the typical concerns of developers that static analysis will take their time, and so on.

If you want to share this article with an English-speaking audience, please use the translation link: Maxim Zvyagintsev. Static Analysis: From Getting Started to Integration .