Therefore, within each separate process there are no traditional "strange" problems with parallel code execution, locks, race conditions , ... And the development of the DBMS itself is pleasant and simple.
But the same simplicity imposes a significant limitation. Since there is only one worker thread inside the process, then it can use no more than one CPU core to execute a request - which means that the server's speed directly depends on the frequency and architecture of a separate core.
In our age of the ended "race of megahertz" and the victorious multicore and multiprocessor systems, such behavior is an impermissible luxury and wastefulness. Therefore, starting with PostgreSQL 9.6, when processing a query, some operations can be performed by several processes simultaneously.
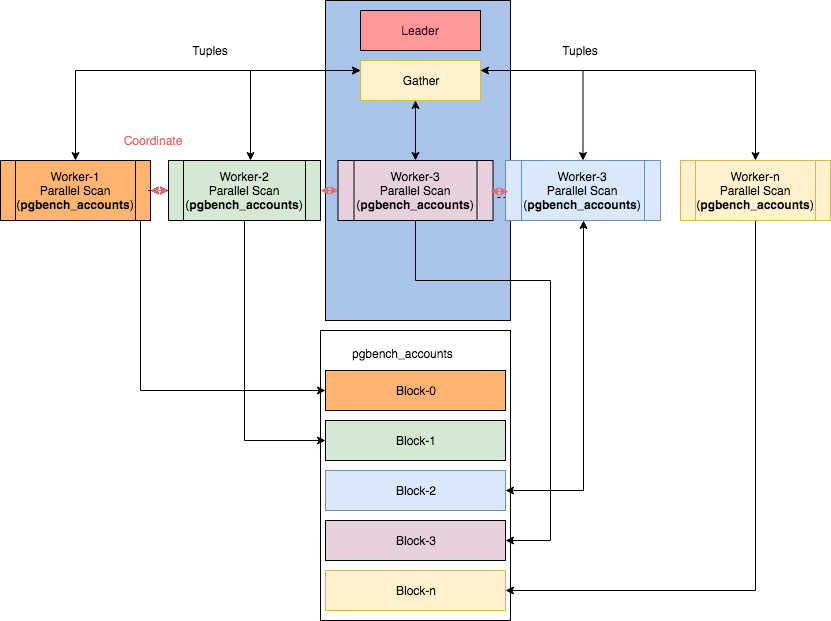
Some parallel nodes can be found in the article "Parallelism in PostgreSQL" by Ibrar Ahmed, where this image is taken from.However, in this case it becomes ... not trivial to read the plans.
Briefly, the chronology of the implementation of parallel execution of plan operations looks like this:
- 9.6 - basic functionality: Seq Scan , Join, Aggregate
- 10 - Index Scan (for btree), Bitmap Heap Scan, Hash Join, Merge Join, Subquery Scan
- 11 - group operations : Hash Join with shared hash table, Append (UNION)
- 12 - basic per-worker statistics on plan nodes
- 13 - detailed per-worker statistics
Therefore, if you are using one of the latest PostgreSQL versions, the chances of seeing it in the plan are
Parallel ...very high. And with him they come and ...
Oddities over time
Let's take a plan from PostgreSQL 9.6 :
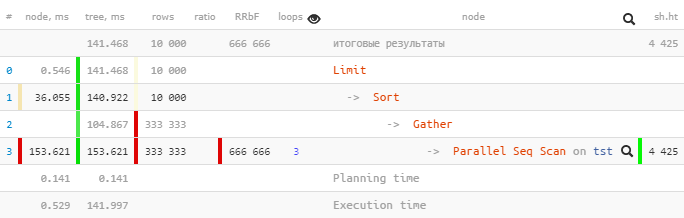
[look at explain.tensor.ru]
Only one was
Parallel Seq Scanexecuted 153.621 ms within a subtree, and Gathertogether with all subnodes - only 104.867 ms.
How so? Has the total time "upstairs" become less? ..
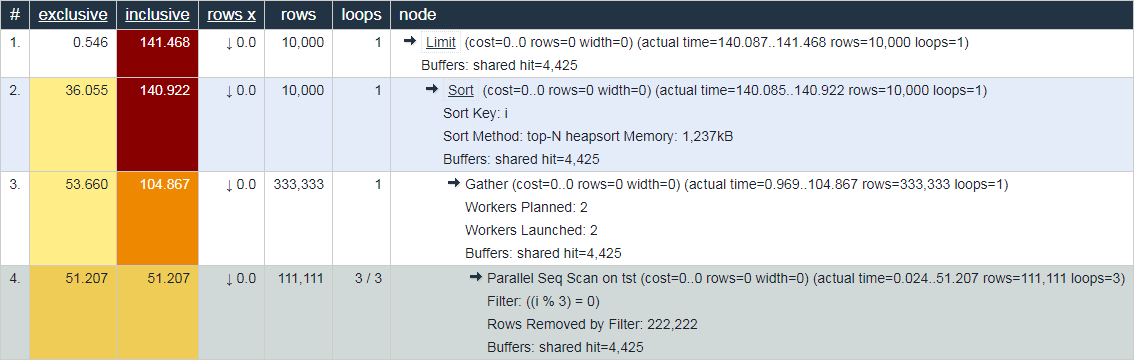
Let's take a look at the
Gather-node in more detail:
Gather (actual time=0.969..104.867 rows=333333 loops=1)
  Workers Planned: 2
  Workers Launched: 2
  Buffers: shared hit=4425
Workers Launched: 2tells us that, in addition to the main process down the tree, 2 more additional ones were involved - a total of 3. Therefore, everything that happened inside the Gathersubtree is the total creativity of all 3 processes at once.
Now let's see what's in there
Parallel Seq Scan:
Parallel Seq Scan on tst (actual time=0.024..51.207 rows=111111 loops=3)
  Filter: ((i % 3) = 0)
  Rows Removed by Filter: 222222
  Buffers: shared hit=4425
Aha!
loops=3Is a summary of all 3 processes. And, on average, each such cycle took 51.207ms. That is, it took the server 51.207 x 3 = 153.621milliseconds of processor time to complete this node . That is, if we want to understand "what the server was doing" - this number will help us understand.
Note that to understand the "real" execution time , you need to divide the total time by the number of workers - that is [actual time] x [loops] / [Workers Launched].
In our example, each worker performed only one cycle through the node, therefore
153.621 / 3 = 51.207. And yes, now there is nothing strange that the only one Gatherin the head process was completed in "as it were, in less time."
Total: look at explain.tensor.ru the total (for all processes) node time to understand what kind of load your server was busy with, and to optimize which part of the query it is worth spending time on.
In this sense, the behavior of the same explain.depesz.com , showing the "real average" time at once, looks less useful for debugging purposes:
Don't agree? Welcome to comments!
Gather Merge loses everything
Now let's execute the same query on PostgreSQL 10 versions :
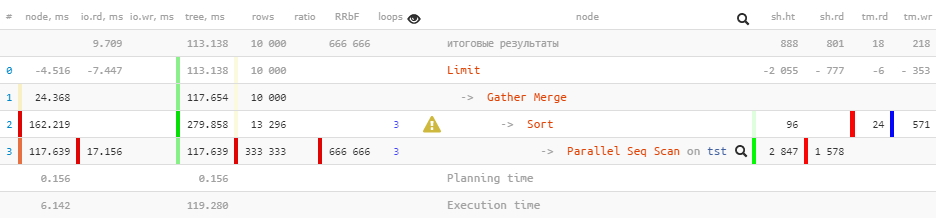
[look at explain.tensor.ru]
Note that we
Gathernow have a node instead of a node in the plan Gather Merge. Here's what the manual says about this :
When a node is above the parallel part of the planGather Merge, instead ofGather, it means that all processes executing the parts of the parallel plan are outputting tuples in sorted order, and that the leading process is performing an order-preserving merge. The nodeGather, on the other hand, receives tuples from subordinate processes in an arbitrary order that is convenient for it, violating the sort order that could exist.
But not all is well in the Danish kingdom:
Limit (actual time=110.740..113.138 rows=10000 loops=1)
  Buffers: shared hit=888 read=801, temp read=18 written=218
  I/O Timings: read=9.709
  ->  Gather Merge (actual time=110.739..117.654 rows=10000 loops=1)
        Workers Planned: 2
        Workers Launched: 2
        Buffers: shared hit=2943 read=1578, temp read=24 written=571
        I/O Timings: read=17.156
While passing attributes
Buffersand I/O Timingsup the tree, some of the data was untimely lost . We can estimate the size of this loss as just about 2/3 , which are formed by auxiliary processes.
Alas, in the plan itself, there is nowhere to get this information - hence the "minuses" on the overlying node. And if you look at the further evolution of this plan in PostgreSQL 12 , then it does not fundamentally change, except that some statistics are added for each worker on the
Sort-node:
Limit (actual time=77.063..80.480 rows=10000 loops=1)
  Buffers: shared hit=1764, temp read=223 written=355
  ->  Gather Merge (actual time=77.060..81.892 rows=10000 loops=1)
        Workers Planned: 2
        Workers Launched: 2
        Buffers: shared hit=4519, temp read=575 written=856
        ->  Sort (actual time=72.630..73.252 rows=4278 loops=3)
              Sort Key: i
              Sort Method: external merge  Disk: 1832kB
              Worker 0:  Sort Method: external merge  Disk: 1512kB
              Worker 1:  Sort Method: external merge  Disk: 1248kB
              Buffers: shared hit=4519, temp read=575 written=856
              ->  Parallel Seq Scan on tst (actual time=0.014..44.970 rows=111111 loops=3)
                    Filter: ((i % 3) = 0)
                    Rows Removed by Filter: 222222
                    Buffers: shared hit=4425
Planning Time: 0.142 ms
Execution Time: 83.884 ms
Total: don't trust the node data above
Gather Merge.