Data on more than one million building permits (records in two datasets) from the San Francisco Department of Buildings - allows you to analyze not only building activity in the city, but also critically examine the latest trends and history of the development of the construction sectors and real estate demand over the past 30 years ...
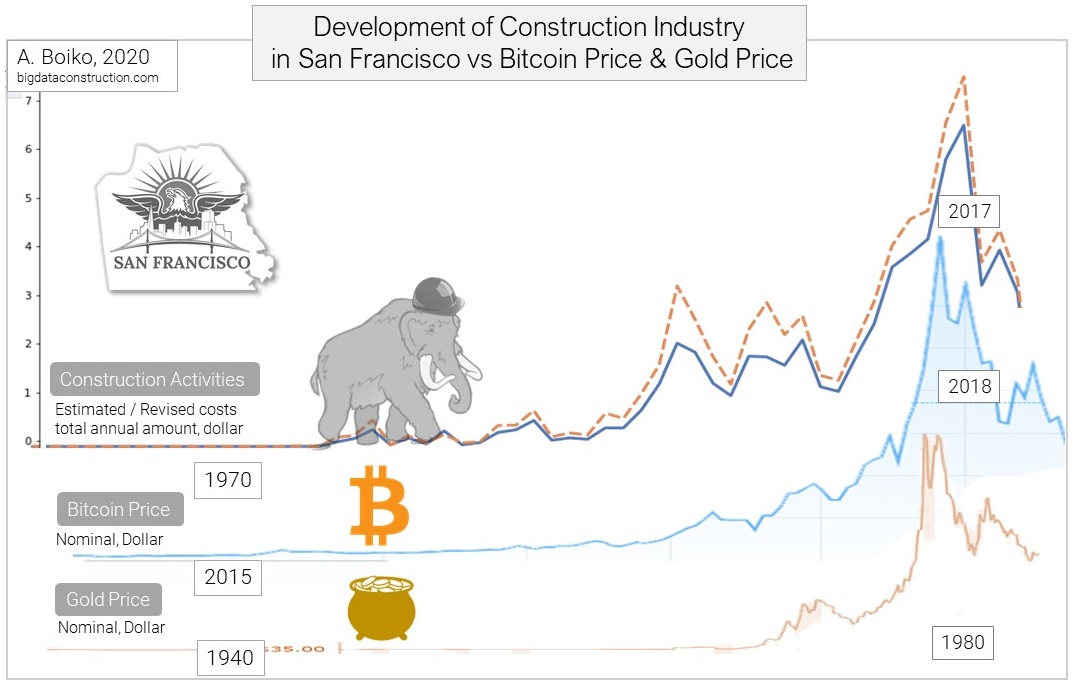
In the last articleThe total annual construction (investment) in San Francisco between 1980 and 2018 was considered. The difference between the expected (estimated) and actual (revised) construction costs was used to track the movement of investor sentiment during periods of economic booms and crises in the region.
The ups and downs of the San Francisco construction industry. Trends and history of the development of construction activity
In this article, we will take a closer look at individual sectors of construction: repair of roofs, kitchens, stairs and bathrooms. After that, let's compare inflation for individual types of work with data on official inflation and other economic indicators.
Content:
The Ups and Downs of Construction Sectors by Housing Type
Average cost of kitchen and bathroom renovations in San Francisco.
-.
.
-.
-.
.
, :
- .
- .
- ( 10 ) (Apartments) - (2016 )
- (Retail) 16 (2001 ).
- 30 3 .
- 1980 2019 5 .
- 30 .
- 4 (, , , ) - - 15%.
- 4 15-20 — , , , - $ 54 000 - — $ 61 000.
- - 30 .
- , — ( 10 ) .
- If you observe multiple growth in a short time, in the next two years you can expect the same rapid decline in intensity.
- If you need to know how much the average repair price will rise, keep an eye on the rate on 10-year government bonds.
Plotting and calculations were carried out in Jupyter Notebook (on the Kaggle.com platform).
The Ups and Downs of San Francisco's Construction Sectors by Housing Type
The San Francisco tech industry is one of the culprits behind the soaring prices. Six-figure tech workers move to the city to work at startups and more established companies (such as Google, Facebook, Twitter and Apple) are dramatically increasing the cost of living and increasing demand for housing. Programmers with pockets full of "tech" money can afford to outbid most of the locals in the real estate market.
At the same time, from the point of view of legislation in the field of urban planning - San Francisco is one of the most regulated cities in America. These and many other factors severely limit construction volumes and affect prices and demand in San Francisco.
thereforedemand for different types of housing changes its leader in each new economic cycle. Each type of housing has had and will have its "ups and downs" in the construction market in San Francisco , such as an explosion in demand for apartments from 2012 to 2015, almost 10 times, or a hype, more than 16 times growth in demand from 1997 to 1999 to the retail space.
In the article on the annual total amount of construction work, the traffic schedule for the period from 1980 to 2018 was divided into two components:
- Estimated (estimated) cost of work (blue line)
- Actual (revised) cost of work (yellow line)

Let's take a deeper look at the total cost data and move on to the “next layer” of data.
We divide the total total cost of work into categories of work according to the parameter “type of housing” (“Existing Use”):
- Apartaments (apartments)
- Retail (retail space)
- Office (office spaces and bureaus)
- Residential real estate (one- and two-family houses)
dfn = df.dropna(subset=['description'])
dfn.description.isnull().values.any()
#dfn = dfn[dfn['description'].str.match('kitchen')]
df_unit = dfn.loc[:,['revised_cost','existing_use', 'existing_units', 'zipcode','permit_creation_date']]

df_unit = df_unit.dropna()
#keys = ["hotel","appartments"]
df_unit = df_unit[df_unit.existing_use.str.contains("apartments")]

#data_loc = df_unit.loc[['estimated_cost', 'revised_cost','permit_creation_date']]
data_cost = df_unit
data_cost.permit_creation_date = pd.to_datetime(data_cost.permit_creation_date)
data_cost = data_cost.set_index('permit_creation_date')

data_cost = data_cost[data_cost.index > "1985-8-01"]
data_cost = data_cost[data_cost.index < "2019-8-31"]


data_cost = data_cost.dropna()
data_cost_m = data_cost.groupby(pd.Grouper(freq='300d')).sum()
#data_cost_m.head()
plt.figure(figsize=(19,8))

ax = sns.lineplot(data=data_cost_m.revised_cost, linewidth=3, size = 17)
ax.set(xlabel='retail')
major_ticks = np.arange(0, 1500000000, 200000000)
ax.set_yticks(major_ticks)
ax.set(ylim=(0, 1500000000))
plt.savefig('plotname.png', transparent=True)

It can be seen that all types of real estate in different economic periods went through rapid parabolic (hype) growth and the same rapid decline.
- The peak of construction of apartments (Apartments) fell on the last high-tech boom, which was associated with the influx of large numbers of new technical workers from all over the world to the fast-growing Silicon Valley firms. The demand for apartments from 2012 to 2015 increased 10 times. from $ 133 million in 2012 to $ 1.4 billion invested only in apartments in 2015.
- (Retail) . 1997 1999 16 . c $ 22 1997 $ 350 . 1999 . , . 90- .
- The growth in demand for office real estate (Office) is also associated with the development of the giants of Silicon Valley. But here, since 2000, in contrast to retail real estate and apartments, there has been a steady growth in demand - which is accompanied by numerous, small ups and downs.
- The growth in investment in residential real estate coincides in terms of growth dynamics with office real estate, but differs from the growth in office space - smooth growth and the absence of large fluctuations in demand.
If we combine these 4 main categories in one graph, we get the general rise and fall of all investments in construction in the city of San Francisco, familiar from the first article.

Average cost of kitchen and bathroom renovations in San Francisco
Taking data from the Feature - Description, we can additionally select data for individual categories of work and see how much it costs on average to renovate a kitchen or bathroom in San Francisco for various types of housing.
fam1 = df_unit[df_unit['existing_use']=='1 family dwelling']['estimated_cost'].mean()
fam2 = df_unit[df_unit['existing_use']=='2 family dwelling']['estimated_cost'].mean()
office = df_unit[df_unit['existing_use']=='office']['estimated_cost'].mean()
apartments = df_unit[df_unit['existing_use']=='apartments']['estimated_cost'].mean()
data = {'1 family dwelling':fam1,'2 family dwelling':fam2,'Apartments':apartments}
typedf = pd.DataFrame(data = data,index=['redevelopment of the bathroom'])
typedf.plot(kind='barh', title="Average estimated cost by type", figsize=(8,6));
The cost of renovating a kitchen in San Francisco is almost double the cost of renovating a bathroom. It is logical that the average cost of a bathroom renovation is $ 2,000 more for a two-family home ($ 16,000) than for a single-family home ($ 14,000).
At the same time, the average cost of renovating a kitchen for a two-family home ($ 25,000) is almost $ 3,000 less than for a single-family home ($ 28,000).
Average cost of roof and stair repairs in San Francisco
For the same Feature - Description, select only the lines that contain the words “reroofing” (roof re-laying) and “stairs” (stair repair).

Based on the average cost of roof repairs, it is logical that roof repairs (due to the larger roof area of two-family houses) are on average $ 2000 more than single-family houses.
The cost of repairing a staircase is also twice as much for a two-family home, because in a single-family home there is either no staircase (or a single-span staircase).
The cost of a planned home renovation in San Francisco
It is recommended to renovate the kitchen and bathroom on average once every 10-15 years. Roof and stairs repair - once every 15-20 years.

In general, if "theoretically" 15 years after the construction of the house - to repair the kitchen, bathroom, roof and stairs in one year - then in a single-family house you will need to save up $ 54,000 for this, whereas for a two-family house this amount will be - $ 61,000. The difference in the total cost of work in these four categories is only 15%.
Thus, after the construction of a new house, in order to make repairs in the house in four categories (kitchen, bath, roof, stairs), it is necessary to save $ 350 monthly, in order to accumulate the necessary $ 60,000 for repairs in 15 years.
The rise in construction costs in San Francisco
By taking the data by job category and grouping it by year, we can observe the growth (and inflation) of the average cost of repairs by type of housing.
years = list(range(1980, 2020))
keywords = ['1 family dwelling','2 family dwelling','apartments']
val_data = []
for year in years:
    iss_data = []
    for word in keywords:
        v = df_unit[(df_unit['existing_use']==word) & (df_unit['issued_date']== year)]['estimated_cost'].mean()
        iss_data.append(v)
    val_data.append(iss_data)
#print(val_data)
In the following graph, data on the average cost by type of housing is presented, as in the previous paragraph, in a columnar form.

The same graph, for visual display, but already in the form of lines, gives a clearer (“inflationary”) picture.
dfnew.plot.bar(figsize=(20, 8))
plt.xlabel("Years")
plt.ylabel("Estimated cost of reroofing")
plt.title("Estimated cost of reroofing by year");
dfnew.plot.line(figsize=(12, 6))
The average cost of roof repairs has been showing a gradual increase since 1990.
In contrast to residential buildings, the average cost of renovating an apartment roof during the same period experienced numerous ups and downs.

In the cost of renovating the roofs of the apartments, there are short-term 3-year cycles.
In contrast to the flat dynamics of growth in the average cost of roof repairs, the average cost of kitchen renovation is more volatile.

In the renovation of kitchens, as well as in the renovation of apartment roofs, short-term 2x-3-year cycles can be traced.
In the repair of bathrooms, such cycles are not traced, and the increase in the average cost of construction is more gentle. Only the increased average cost of apartment bathtub repairs before the dot-com boom stands out ?!

Inflation in the cost of construction work in San Francisco.
In order to find the inflation of the average cost of repairs for the entire period from 1980 to 2019, we supplement the data with a trend line. When calculating inflation (taking the starting and ending points of the trend line), we find that the maximum inflation in value for the period from 1990 to 2018 occurred in the bathroom sector.
The average cost of bathroom renovation over the past 30 years has increased almost 5 times (perhaps the cost of renovation has increased due to the appearance of new finishing materials and expensive (and affordable) ceramics and sanitary ware on the market ?!).
sns.regplot(y=dfnew_2['2 family dwelling'],x=dfnew_2['index'],data=dfnew_2, fit_reg=True)
#sns.jointplot(dfnew_2['index'], dfnew_2['2 family dwelling'], data=dfnew_2, fit_reg=True, stat_func=stats.pearsonr)
lines = plt.gca().lines
lower1990 = [line.get_ydata().min() for line in lines]
upper2019 = [line.get_ydata().max() for line in lines]
plt.scatter(1990, lower1990, marker='x', color='C3', zorder=3)
plt.scatter(2019, upper2019, marker='x', color='C3', zorder=3)
print("In 1990 it cost = $" + str(lower1990[0].round()) + "; In 2019 it cost = $ " + str(upper2019[0].round()))
print("Inflation for the period 1980-2019 = " + str(((upper2019[0]-lower1990[0])/lower1990[0]*100).round())+"%")
all2 = [line.get_ydata() for line in lines]
The smallest deviations in terms of values are in the category “roof repairs”, where inflation was 250% over the past 30 years (the average price increased more than 3 times). The cost of kitchen renovations has also tripled over the past 30 years.
In the same period, the cost of stair repairs from 1980 to 2019 remained almost unchanged and the average cost inflation in this construction sector was only 85%.

Imagine now the development of inflation growth for greater clarity on a single scale, where inflation varies from 0 to 9%, and look at the fall in annual inflation cost of repairs by category in the period from 1980 to 2019.

It is noticeable that annual inflation over the past 30 years has decreased in all categories by almost 2-4 times (for example, in roof repairs from 8% in 1990 to almost 2% in 2019). This completely coincides with the economic policy during this period (from 1980 to 2019).
If we compare the official data on inflation and the data on inflation in the construction sector, it will be seen that only in one sector the official inflation coincided with the inflation of the cost of work.

The rise in the cost of repairing stairs completely coincided with the official inflation. In other categories of work, the annual growth in the cost of construction work over the past 30 years has outpaced official inflation by almost 2 times.
The movement of inflation in such categories as roof renovation, bathroom and kitchen renovation almost completely coincided with the movement of the interest rate on 30-year loans (and, accordingly, with the yield of 10-year Treasury bonds).

A 30-year fixed mortgage is a loan whose interest rate remains unchanged throughout the entire loan term.For example, with a 30-year mortgage of $ 300,000 with a 20% down payment and an interest rate of 3.75%, monthly payments would be about $ 1,111 (excluding taxes and insurance). Thus, the interest rate of 3.75% (and monthly payment) remains the same throughout the entire loan term.
The 10-year Treasury rate is the income earned from an investment in US government-issued Treasury securities with a maturity of 10 years.
Real rates and profitability in construction
It can be seen that the change in the cost of works coincides with the interest rate on government bonds. Paul Schmelzing's (Harvard professor) chart shows how global real interest rates have changed over the past eight centuries.

Collecting data on real interest rates in advanced economies, Schmelzing shows that real indicators show a negative interest rate trend since the 14th century.
For comparison, the period considered in the article is marked in yellow.

Starting in 1311, data from the report shows how average real rates have changed from 5.1% in the 1300s to an average of 2% in the 1900s.
The average real rate for the period 2000-2018 is 1.3%.

Along with the real rate, of course, the profitability of industries also decreases , which correlates with this rate. These are primarily such ancient industries as the agrarian industry and the construction industry.Most likely, in the period from 2020 to 2030, we will see new record lows in real rates and, accordingly, a decrease in profitability in the construction industry. But if profitability declines, perhaps this means that productivity will increase by the same "missing" percent.
If earlier in construction there was a large margin of 10-15%, and companies did not need to think about introducing new technologies (which, in principle, there were not many), now we are entering a new era of low real rates and low margins of 2-5%. where the main role in the construction company will be played by the availability of new tools and processes in the company's work.There is an abundance of tools and new technologies that can already be used in construction at the moment.
It will take decades for construction companies for these new technologies to find their way into the laborious and resilient construction industry.Around the same time that self-driving taxis start operating in Moscow, Russian construction companies, in order to maintain margins, will gradually begin replacing planners at the lower levels with automated scripts and tools that use big data and machine learning technologies.
Links to previous publications on this topic:
- The ups and downs of the San Francisco construction industry. Trends and history of development of construction activity
- The construction sector is dying out. COVID-19 crisis, growing challenges and new opportunities
Link to Jupyter Notebook: San Francisco. Building sector 1980-2019.
If you like my content please consider buying me a coffee. Thank you for your support! Buy coffee for the author