
In this article, we'll talk about the implementation details and operation of various JIT compilers, as well as optimization strategies. We will discuss in sufficient detail, but we will omit many important concepts. That is, there will not be enough information in this article to reach reasonable conclusions in any comparison of implementations and languages.
To get a basic understanding of JIT compilers, read this article .
A small note:
, , , - . , JIT ( ), , . , , , , . - , , .
- Pypy
- GraalVM C
- OSR
- JIT
()
LuaJIT uses what is called tracing. Pypy performs metatracing, that is, it uses the system to generate trace and JIT interpreters. Pypy and LuaJIT are not exemplary Python and Lua implementations, but stand alone projects. I would characterize LuaJIT as shockingly fast, and it describes itself as one of the fastest dynamic language implementations - and I absolutely believe that.
To understand when to start tracing, the interpreter loop looks for hot loops (the concept of hot code is universal for all JIT compilers!). The compiler then "traces" the loop, recording executable operations to compile well-optimized machine code. In LuaJIT, compilation is based on traces with an instruction-like intermediate representation that is unique to LuaJIT.
How tracing is implemented in Pypy
Pypy starts tracing the function after 1619 executions and compiles after 1039 executions, that is, it takes about 3000 executions of the function for it to start working faster. These values were carefully chosen by the Pypy team, and in general in the world of compilers, many constants are carefully chosen.
Dynamic languages make optimization difficult. The code below can be statically removed in stricter language because it
Falsewill always be false. However, in Python 2, this cannot be guaranteed until runtime.
if False:
  print("FALSE")
For any intelligent program, this condition will always be false. Unfortunately, the value
Falsecan be redefined, and the expression will be in a loop, it can be redefined somewhere else. Therefore Pypy can create a "guard". If the defender fails, JIT falls back to the interpretation loop. Pypy then uses another constant (200) called trace eagerness to decide whether to compile the rest of the new path before the end of the loop. This subpath is called a bridge .
In addition, Pypy provides these constants as arguments that you can customize at runtime along with unrolling configuration, i.e. loop expansion, and inlining! And in addition, it provides hooks that we can see after compilation is complete.
def print_compiler_info(i):
  print(i.type)
pypyjit.set_compile_hook(print_compiler_info)

for i in range(10000):
  if False:
    pass

print(pypyjit.get_stats_snapshot().counters)
Above, I wrote a pure Python program with a compiling hook to display the type of compilation applied. The code also outputs data at the end, which shows the number of defenders. For this program, I got one loop compilation and 66 defenders. When I replaced the expression with a
ifsimple out-of-loop pass for, there were only 59 defenders left.
for i in range(10000):
  pass # removing the `if False` saved 7 guards!
By adding these two lines to the loop
for, I got two compilations, one of which was of the "bridge" type!
if random.randint(1, 100) < 20:
  False = True
Wait, you were talking about metatracing!
The idea of metatracing can be described as "write an interpreter and get a compiler for free!" Or "turn your interpreter into a JIT compiler!" Writing a compiler is difficult, and if you can get it for free, then the idea is cool. Pypy "contains" an interpreter and a compiler, but it does not explicitly implement a traditional compiler.
Pypy has an RPython tool (built for Pypy). It is a framework for writing interpreters. Its language is a kind of Python and is statically typed. It is in this language that you need to write an interpreter. The language is not designed for typed Python programming because it does not contain standard libraries or packages. Any RPython program is a valid Python program. RPython code is transpiled to C and then compiled. Thus, a meta-compiler in this language exists as a compiled C program.
The prefix "meta" in the word metatraces means that tracing is performed when the interpreter is running, not the program. It behaves more or less like any other interpreter, but it can track its operations and is designed to optimize traces by updating its path. With further tracing, the interpreter path becomes more optimized. A well-optimized interpreter follows a specific path. And the machine code used in this path, obtained by compiling RPython, can be used in the final compilation.
In short, the "compiler" in Pypy compiles your interpreter, which is why Pypy is sometimes called the meta-compiler. It does not compile so much the program you are executing as the path of an optimized interpreter.
The concept of metatracing may seem confusing, so for illustration purposes I wrote a very poor program that only understands
a = 0and a++to.
# interpreter written with RPython
for line in code:
  if line == "a = 0":
    alloc(a, 0)
  elif line == "a++":
    guard(a, "is_int") # notice how in Python, the type is unknown, but after being interpreted by RPython, the type is known
    guard(a, "> 0")
    int_add(a, 1)
If I run this hot cycle:
a = 0
a++
a++
The tracks might look like this:
# Trace from numerous logs of the hot loop
a = alloc(0) # guards can go away
a = int_add(a, 1)
a = int_add(a, 2)

# optimize trace to be compiled
a = alloc(2) # the section of code that executes this trace _is_ the compiled code
But the compiler is not some special separate module, it is built into the interpreter. Therefore, the interpretation cycle will look like this:
for line in code:
  if traces.is_compiled(line):
    run_compiled(traces.compiled(line))
    continue
  elif traces.is_optimized(line):
    compile(traces.optimized(line))
    continue
  elif line == "a = 0"
  # ....
Introduction to JVM
I wrote in Graal-based TruffleRuby for four months and fell in love with it.
Hotspot (so named because it searches for hot spots) is a virtual machine that comes with standard Java installations. It contains several compilers for implementing multilevel compilation. Hotspot's 250,000 line codebase is open and has three garbage collectors. Dev copes with JIT-compilation, in some benchmarks, it works better than C ++ impls (on this occasion as
The strategies used in Hotspot have inspired many authors of subsequent JIT compilers, language virtual machine frameworks, and especially Javascript engines. Hotspot also spawned a wave of JVM languages like Scala, Kotlin, JRuby, and Jython. JRuby and Jython are fun Ruby and Python implementations that compile source code to JVM bytecode, which Hotspot then executes. All of these projects are relatively successful in speeding up the Python and Ruby languages (Ruby more than Python) without implementing all the tooling, as is the case with Pypy. Hotspot is also unique in that it is a JIT for less dynamic languages (although it is technically a JIT for JVM bytecode, not Java).

GraalVM is a JavaVM with a Java piece of code. It can run any JVM language (Java, Scala, Kotlin, etc.). It also supports Native Image to work with AOT compiled code through the Substrate VM. A significant proportion of Twitter's Scala services run on Graal, which speaks of the quality of the virtual machine, and in some ways it is better than the JVM, although it is written in Java.
And that is not all! GraalVM also provides Truffle: a framework for implementing languages by creating AST (Abstract Syntax Tree) interpreters. There is no explicit step in Truffle when the JVM bytecode is generated as in a regular JVM language. Rather, Truffle will simply use the interpreter and talk to Graal to generate machine code directly with profiling and so-called partial scoring. Partial evaluation is beyond the scope of this article, in a nutshell: this method adheres to the "write an interpreter, get a compiler for free!" Philosophy of metatracking, but approaches it differently.
TruffleJS — Truffle- Javascript, V8 , , V8 , Google , . TruffleJS «» V8 ( JS-) , Graal.
JIT-
C
JIT implementations often have a problem supporting C extensions. Standard interpreters such as Lua, Python, Ruby, and PHP have a C API that allows users to build packages in that language, significantly speeding up execution. Many packages are written in C, for example numpy, standard library functions like
rand. All of these C extensions are critical to making interpreted languages fast.
C extensions are difficult to maintain for a number of reasons. The most obvious reason is that the API is designed with internal implementation in mind. Moreover, it is easier to support C extensions when the interpreter is written in C, so JRuby cannot support C extensions, but it does have an API for Java extensions. Pypy recently released a beta version of support for C extensions, although I'm not sure if it works due to Hyrum's Law . LuaJIT supports C extensions, including additional features in its C extensions (LuaJIT is just awesome!)
Graal solves this problem with Sulong, an engine that executes LLVM bytecode on GraalVM, converting it to Truffle. LLVM is a toolbox, and we only need to know that C can be compiled to LLVM bytecode (Julia has an LLVM backend too!). It's strange, but the solution is to take a good compiled language with over forty years of history and interpret it! Of course, it doesn't run nearly as fast as properly compiled C, but it does get several benefits.
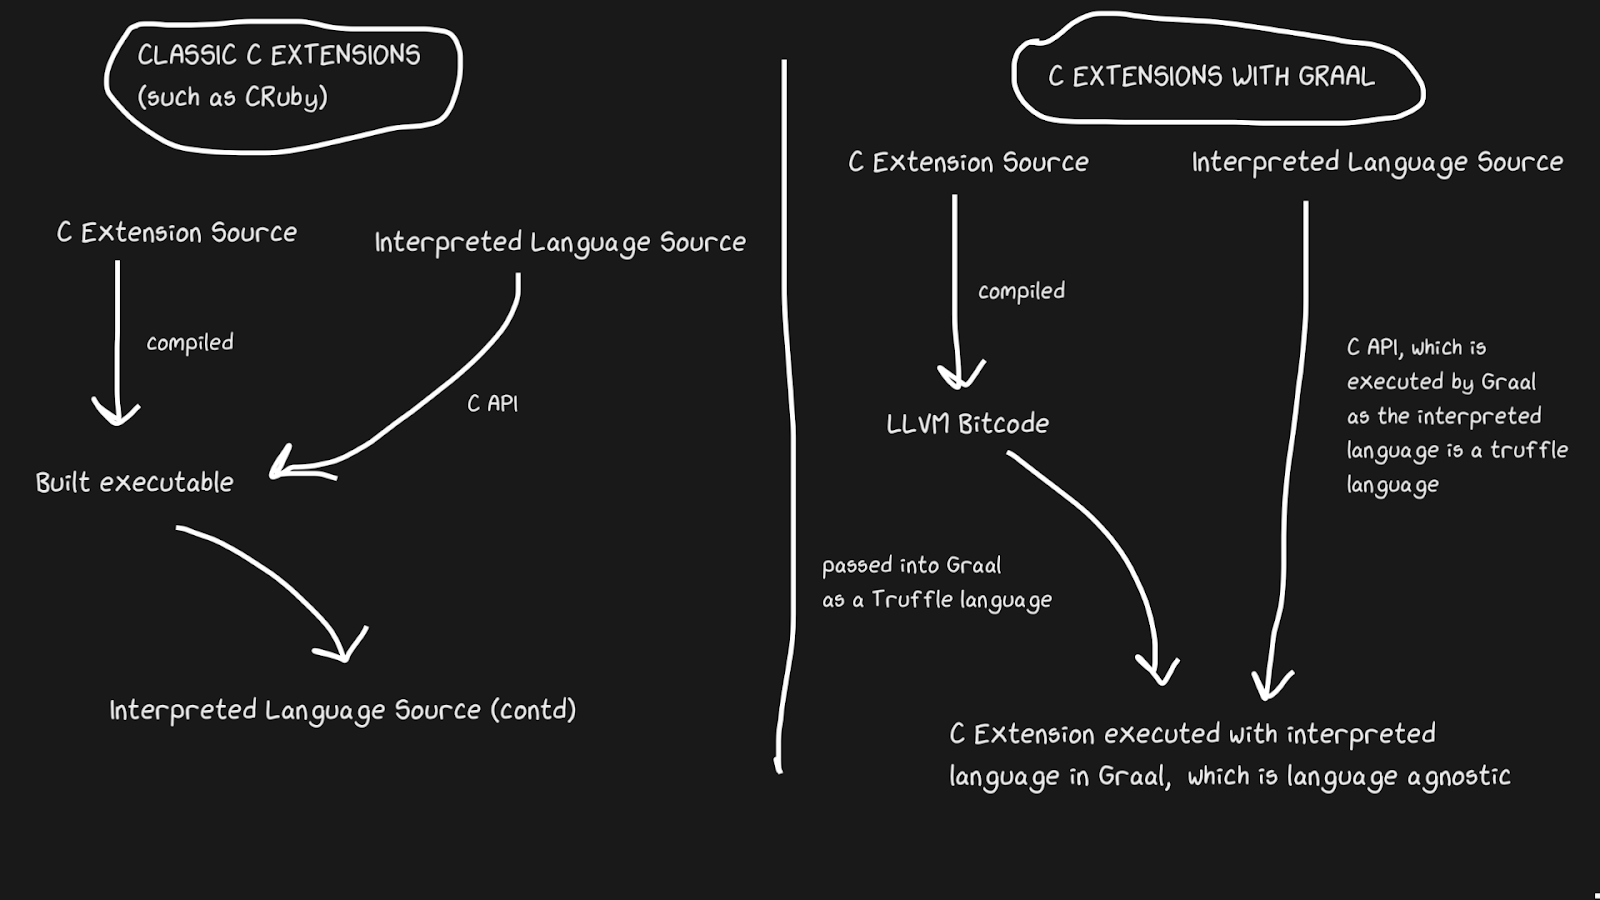
LLVM bytecode is already quite low-level, that is, it is not as inefficient to apply JIT to this intermediate representation as to C. Part of the cost is compensated for by the fact that the bytecode can be optimized along with the rest of the Ruby program, but we cannot optimize the compiled C program ... All of these memory strips, inlining, dead code strips, and more can be applied to C and Ruby code, instead of calling the C binary from Ruby code. TruffleRuby C extensions are faster than CRuby C extensions in some respects.
For this system to work, you need to know that Truffle is completely language independent and the overhead of switching between C, Java, or any other language within Graal will be minimal.
Graal's ability to work with Sulong is part of their polyglot capabilities, which allows for high language interchangeability. This is not only good for the compiler, but it also proves that you can easily use multiple languages in one "application".
Back to the interpreted code, it's faster
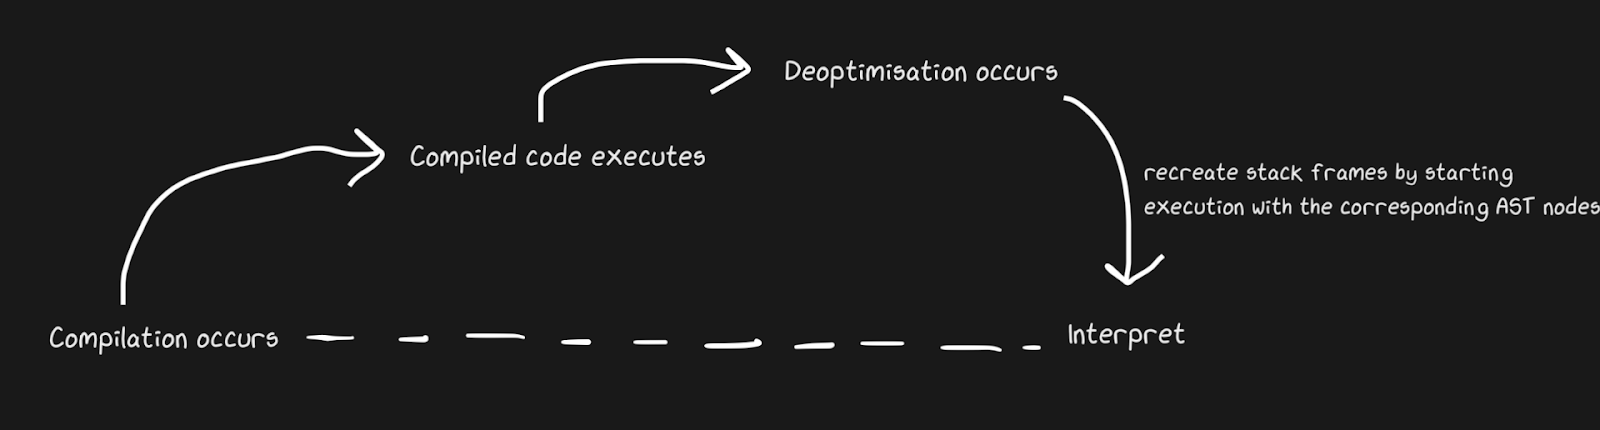
We know that JITs contain an interpreter and a compiler, and that they move from interpreter to compiler to speed things up. Pypy creates bridges for the return path, although from the point of view of Graal and Hotspot, this is de-optimization . We are not talking about completely different concepts, but by de-optimization we mean a return to the interpreter as a conscious optimization, and not a solution to the inevitability of a dynamic language. Hotspot and Graal make heavy use of de-optimization, especially Graal, because developers have tight control over compilation and need even more control over compilation for the sake of optimizations (compared to, say, Pypy). Deoptimization is also used in JS engines, which I will talk about a lot, since JavaScript in Chrome and Node.js depends on it.
To quickly apply de-optimization, it is important to make sure you switch between compiler and interpreter as quickly as possible. With the most naive implementation, the interpreter will have to “catch up” with the compiler to perform de-optimization. Additional complications are associated with de-optimization of asynchronous streams. Graal creates a set of frames and matches it against the generated code to return to the interpreter. With safepoints, you can make a Java thread pause and say, "Hello, garbage collector, do I need to stop?" So that thread processing does not require a lot of overhead. It turned out to be rather crude, but it works fast enough for de-optimization to be a good strategy.
Similar to the Pypy bridging example, monkey patching of functions can also be deoptimized. It's more elegant because we add de-optimization code not when the defender fails, but when guerrilla patching is applied.
A great example of JIT de-optimization: conversion overflow is an unofficial term. We are talking about a situation when a certain type (for example,
int32) is internally represented / allocated , but it needs to be converted to int64. TruffleRuby does this with de-optimizations, just like the V8.
For example, if you ask in Ruby
var = 0, you get int32(Ruby calls it Fixnumand Bignum, but I will use the notation int32and int64). Performing an operation withvar, you need to check if a value overflow occurs. But it is one thing to check, and compiling code that handles overflows is expensive, especially given the frequency of numeric operations.
Without even looking at the compiled instructions, you can see how this de-optimization reduces the amount of code.
int a, b;
int sum = a + b;
if (overflowed) {
  long bigSum = a + b;
  return bigSum;
} else {
  return sum;
}

int a, b;
int sum = a + b;
if (overflowed) {
  Deoptimize!
}
In TruffleRuby, only the first run of a particular operation is de-optimized, so we don't waste resources on it every time an operation overflows.
WET code is fast code. Inlining and OSR
function foo(a, b) {
 return a + b;
}
for (var i = 0; i < 1000000; i++) {
 foo(i, i + 1);
}
foo(1, 2);
Even trivialities like these triggers are deoptimized in V8! With options like
--trace-deoptand, --trace-optyou can collect a lot of information about the JIT and also modify the behavior. Graal has some very useful tools, but I will use V8 because many have it installed.
Deoptimization is started by the last line (
foo(1, 2)), which is puzzling, because this call was made in the loop! We will receive a message "Insufficient type feedback for call" (the full list of reasons for de-optimization is here , and there is a funny reason for "no reason" in it). This creates an input frame displaying the literals 1and 2.
So why de-optimize? V8 is smart enough to perform typecasting: when it
iis typeinteger, literals are passed as well integer.
To understand this, let's replace the last line with
foo(i, i +1). But de-optimization is still applied, only this time the message is different: "Insufficient type feedback for binary operation". WHY?! After all, this is exactly the same operation that is performed in a loop, with the same variables!
The answer, my friend, lies in on-stack replacement (OSR). Inlining is a powerful compiler optimization (not just JIT) in which functions cease to be functions, and content is passed to the place of calls. JIT compilers can inline to increase speed by changing the code at runtime (compiled languages can only inline statically).
// partial output from printing inlining details

[compiling method 0x04a0439f3751 <JSFunction (sfi = 0x4a06ab56121)> using TurboFan OSR]
0x04a06ab561e9 <SharedFunctionInfo foo>: IsInlineable? true
Inlining small function(s) at call site #49:JSCall
So V8 will compile
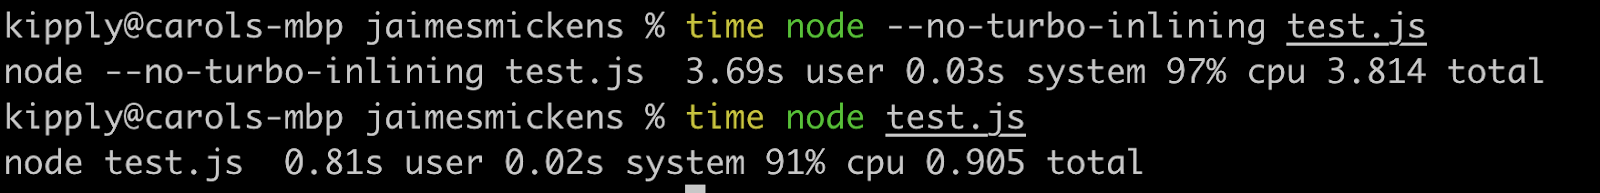
foo, determine that it can be inline, and inline with OSR. However, the engine does this only for the code inside the loop, because this is a hot path, and the last line is not yet in the interpreter at the time of inlining. Therefore, V8 does not yet have enough feedback on the type of the function foo, because not it is used in the loop, but its inline version. If applied --no-use-osr, then there will be no deoptimization, no matter what we pass, literal or i. However, without inlining, even a tiny million iterations will run noticeably slower. JIT compilers really embody the no-solution-only-trade-off principle. Deoptimizations are expensive, but they don't compare to the cost of finding methods and inlining, which is preferred in this case.
Inlining is incredibly effective! I ran the above code with a couple of extra zeros, and with inlining turned off, it ran four times slower.
Although this article is about JIT, inlining is effective in compiled languages as well. All LLVM languages actively use inlining, because LLVM will also do this, although Julia is inline without LLVM, this is in her nature. JITs can be inlined using runtime heuristics and are able to switch between non-inlining and inlining modes using OSR.
A note on JIT and LLVM
LLVM provides a bunch of compilation-related tools. Julia works with LLVM (note that this is a large toolbox and each language uses it differently), just like Rust, Swift and Crystal. Suffice it to say that this is a large and wonderful project that also supports JITs, although LLVM does not have significant built-in dynamic JITs. The fourth level of JavaScriptCore compilation used the LLVM backend for a while, but it was replaced less than two years ago. Since then, this toolkit has not been very well suited for dynamic JITs, mainly because it is not designed to work in a dynamic environment. Pypy tried it 5-6 times, but settled on JSC. With LLVM, allocation sinking and code motion were limited.It was also impossible to use powerful JIT features like range-inferencing (it's like casting, but with a known range of values). But more importantly, with LLVM, a lot of resources are spent on compiling.
What if instead of an instruction-based intermediate representation, we have a large graph that modifies itself?
We talked about LLVM bytecode and Python / Ruby / Java bytecode as an intermediate representation. They all look like some kind of language in the form of instructions. Hotspot, Graal, and V8 use the "Sea of Nodes" intermediate representation (introduced in Hotspot), which is a lower-level AST. This is an effective view because a significant part of profiling is based on the notion of a certain path that is rarely used (or crossed in the case of some pattern). Note that these AST compilers are different from the AST parsers.
Usually I adhere to the position “try to do it at home!”, But it is quite difficult to consider graphs, although very interesting, and often extremely useful for understanding the work of the compiler. For example, I cannot read all the graphs not only due to lack of knowledge, but also because of the computational capabilities of my brain (compiler options can help get rid of behavior that I am not interested in).
In the case of the V8, we will use the D8 tool with a flag
--print-ast. For Graal it will be --vm.Dgraal.Dump=Truffle:2. The text will be displayed on the screen (formatted to get a graph). I don’t know how the V8 developers generate visual graphs, but Oracle has an “Ideal Graph Visualizer” which is used in the previous illustration. I didn't have the strength to reinstall IGV, so I took the graphs from Chris Seaton, generated with Seafoam, whose source is now closed.
Okay, let's take a look at the JavaScript AST!
function accumulate(n, a) {
  var x = 0;
  for (var i = 0; i < n; i++) {
    x += a;
  }
  return x;
}

accumulate(1, 1)
I ran this code through
d8 --print-ast test.js, although we are only interested in the function accumulate. See that I only called it once, that is, I don't have to wait for compilation to get the AST.
This is how the AST looks like (I removed some unimportant lines):
FUNC at 19
. NAME "accumulate"
. PARAMS
. . VAR (0x7ff5358156f0) (mode = VAR, assigned = false) "n"
. . VAR (0x7ff535815798) (mode = VAR, assigned = false) "a"
. DECLS
. . VARIABLE (0x7ff5358156f0) (mode = VAR, assigned = false) "n"
. . VARIABLE (0x7ff535815798) (mode = VAR, assigned = false) "a"
. . VARIABLE (0x7ff535815840) (mode = VAR, assigned = true) "x"
. . VARIABLE (0x7ff535815930) (mode = VAR, assigned = true) "i"
. BLOCK NOCOMPLETIONS at -1
. . EXPRESSION STATEMENT at 38
. . . INIT at 38
. . . . VAR PROXY local[0] (0x7ff535815840) (mode = VAR, assigned = true) "x"
. . . . LITERAL 0
. FOR at 43
. . INIT at -1
. . . BLOCK NOCOMPLETIONS at -1
. . . . EXPRESSION STATEMENT at 56
. . . . . INIT at 56
. . . . . . VAR PROXY local[1] (0x7ff535815930) (mode = VAR, assigned = true) "i"
. . . . . . LITERAL 0
. . COND at 61
. . . LT at 61
. . . . VAR PROXY local[1] (0x7ff535815930) (mode = VAR, assigned = true) "i"
. . . . VAR PROXY parameter[0] (0x7ff5358156f0) (mode = VAR, assigned = false) "n"
. . BODY at -1
. . . BLOCK at -1
. . . . EXPRESSION STATEMENT at 77
. . . . . ASSIGN_ADD at 79
. . . . . . VAR PROXY local[0] (0x7ff535815840) (mode = VAR, assigned = true) "x"
. . . . . . VAR PROXY parameter[1] (0x7ff535815798) (mode = VAR, assigned = false) "a"
. . NEXT at 67
. . . EXPRESSION STATEMENT at 67
. . . . POST INC at 67
. . . . . VAR PROXY local[1] (0x7ff535815930) (mode = VAR, assigned = true) "i"
. RETURN at 91
. . VAR PROXY local[0] (0x7ff535815840) (mode = VAR, assigned = true) "x"
It is difficult to parse this, but it is similar to the AST of the parser (not true for all programs). And the next AST is generated using Acorn.js.
A noticeable difference is the definition of variables. In the AST of the parser, there is no explicit definition of parameters, and the loop declaration is hidden in the node
ForStatement. In a compiler-level AST, all declarations are grouped with addresses and metadata.
The compiler AST also uses this stupid expression
VAR PROXY. The parser's AST cannot determine the relationship between names and variables (by addresses) due to hoisting of variables (hoisting), evaluation (eval) and others. So the compiler's AST uses variables PROXYthat are later associated with the actual variable.
// This chunk is the declarations and the assignment of `x = 0`
. DECLS
. . VARIABLE (0x7ff5358156f0) (mode = VAR, assigned = false) "n"
. . VARIABLE (0x7ff535815798) (mode = VAR, assigned = false) "a"
. . VARIABLE (0x7ff535815840) (mode = VAR, assigned = true) "x"
. . VARIABLE (0x7ff535815930) (mode = VAR, assigned = true) "i"
. BLOCK NOCOMPLETIONS at -1
. . EXPRESSION STATEMENT at 38
. . . INIT at 38
. . . . VAR PROXY local[0] (0x7ff535815840) (mode = VAR, assigned = true) "x"
. . . . LITERAL 0
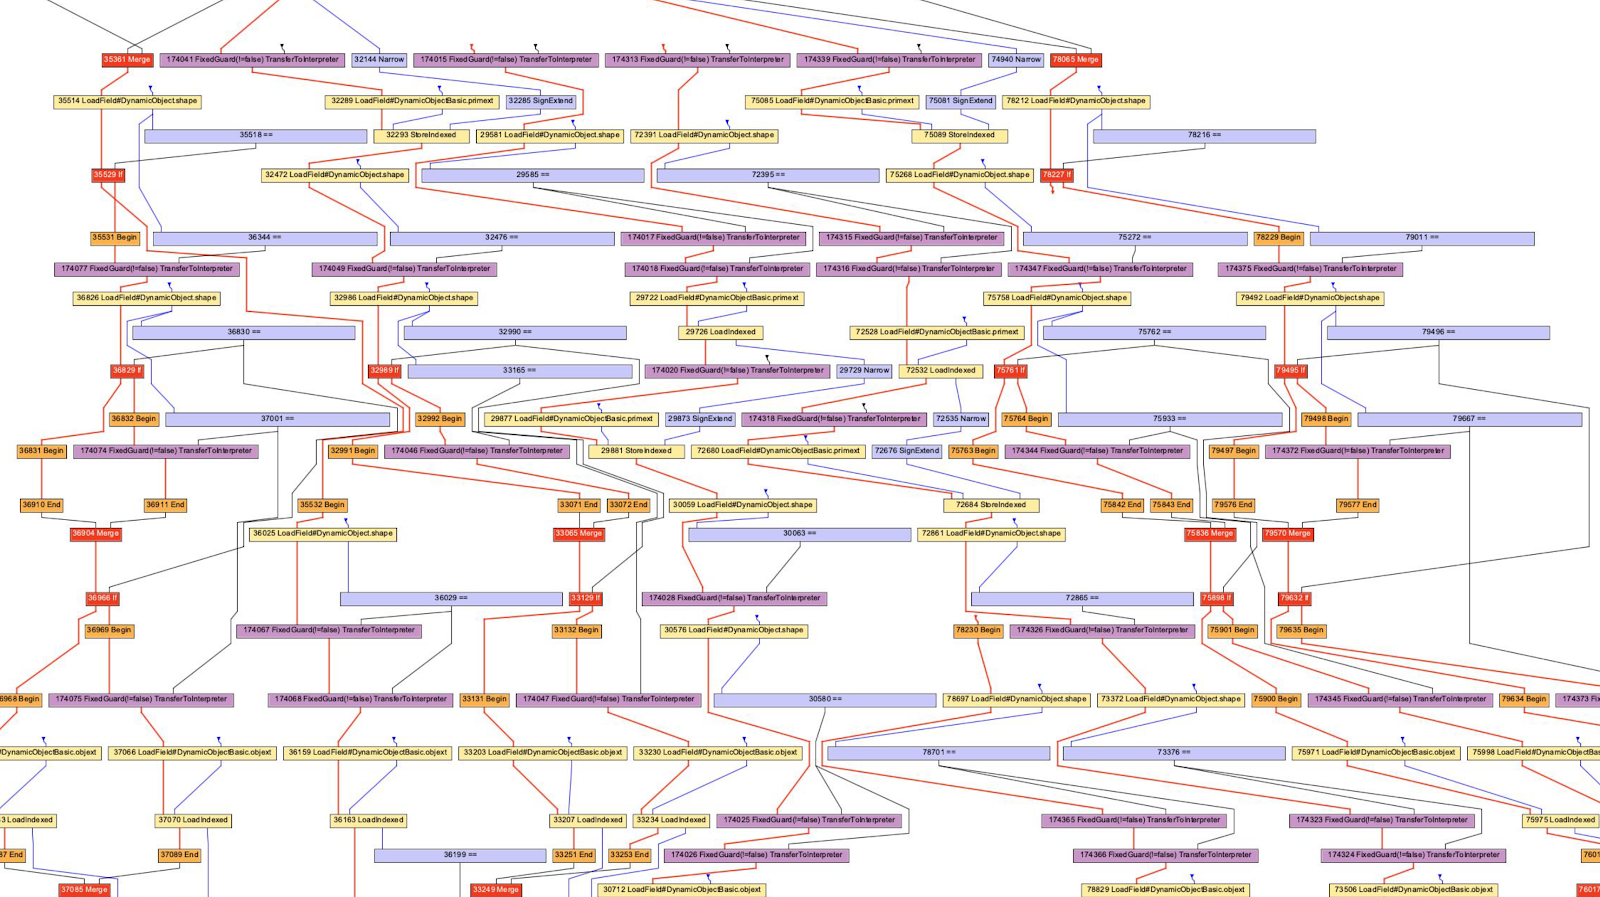
And this is how the AST of the same program, obtained using Graal, looks like!
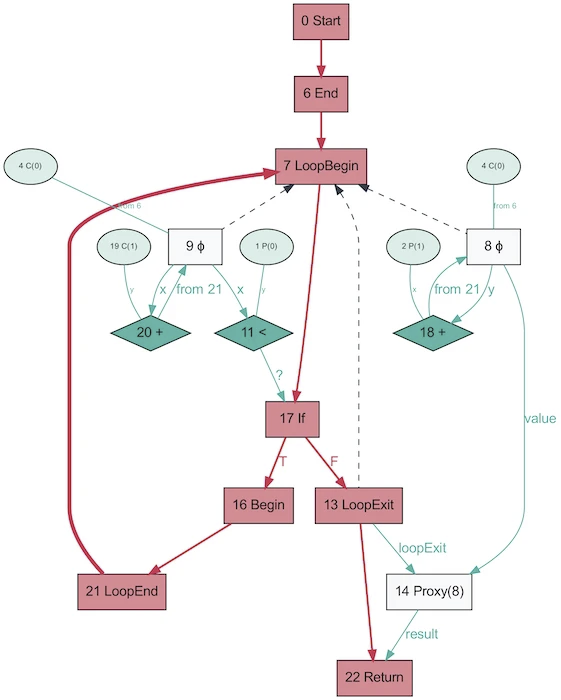
It looks much simpler. Red indicates control flow, blue indicates data flow, arrows indicate directions. Note that while this graph is simpler than the AST from V8, this does not mean that Graal is better at simplifying the program. It's just generated based on Java, which is much less dynamic. The same Graal graph generated from Ruby will be closer to the first version.
It's funny that AST in Graal will change depending on the execution of the code. This graph is generated with OSR disabled and inlining, when the function is repeatedly called with random parameters so that it is not optimized. And the dump will provide you with a whole bunch of graphs! Graal uses a specialized AST to optimize programs (V8 does similar optimizations, but not at the AST level). When you save graphs in Graal, you get more than ten schemes with different optimization levels. When rewriting nodes, they replace themselves (specialize) with other nodes.
The above graph is an excellent example of specialization in a dynamically typed language (picture taken from One VM to Rule Them All, 2013). The reason this process exists is closely related to how partial assessment works - it's all about specialization.
Hooray JIT compiled the code! Let's compile again! And again!
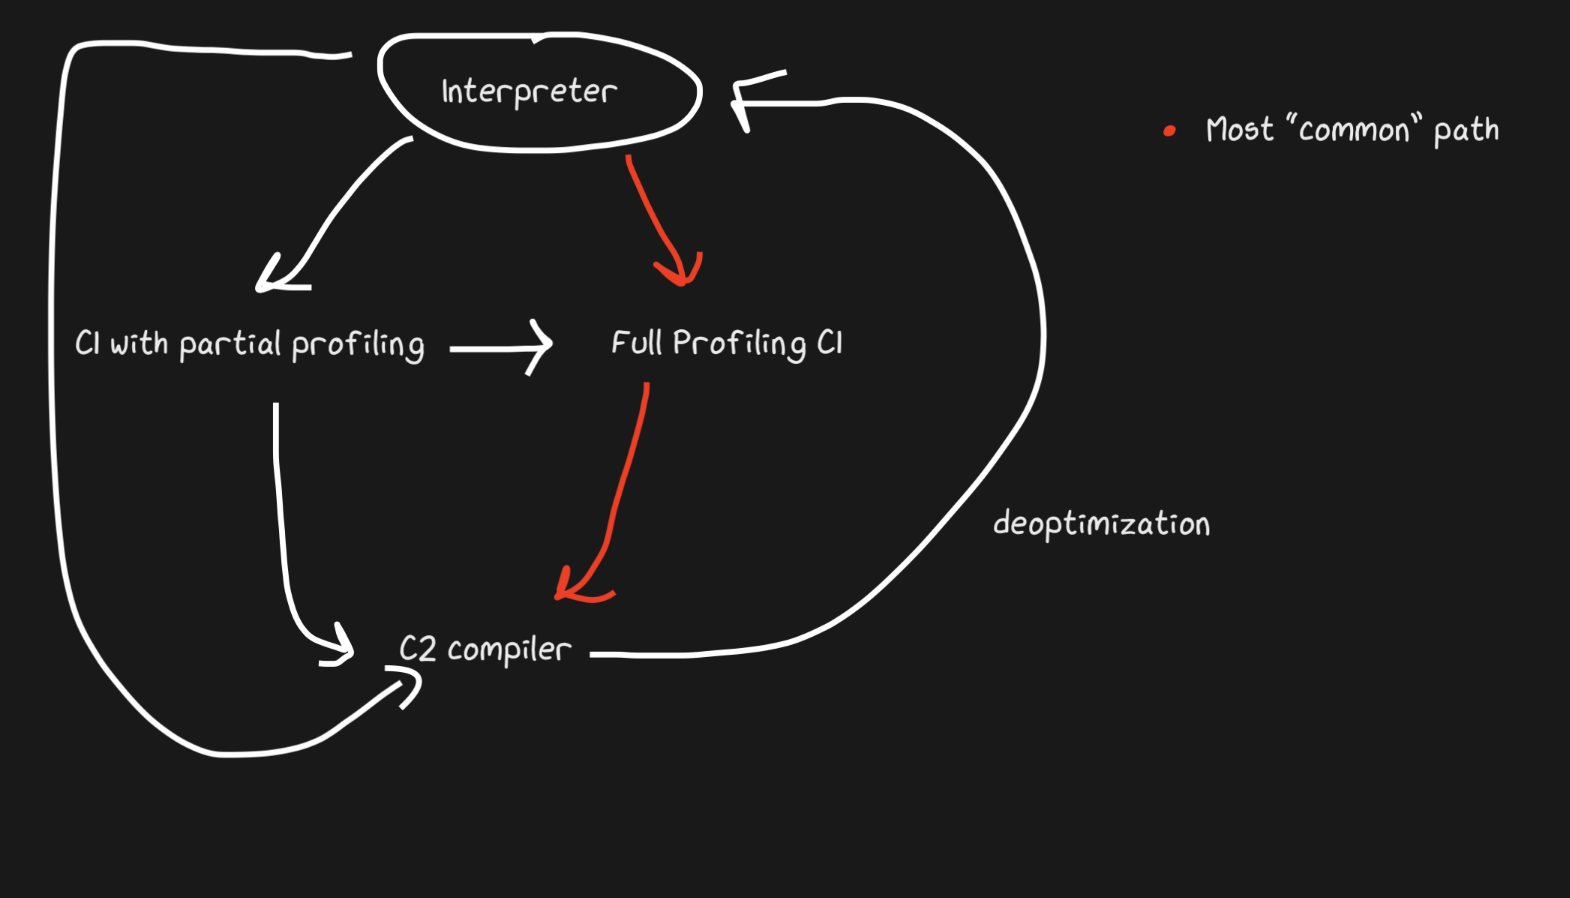
Above I mentioned about "multilevel", let's talk about it. The idea is simple: if we are not yet ready to create fully optimized code, but interpretation is still expensive, we can pre-compile and then final compile when we are ready to generate more optimized code.
Hotspot is a layered JIT with two compilers, C1 and C2. C1 does a quick compile and runs the code, then does a full profiling to get the code compiled with C2. This can help solve many warm-up problems. Non-optimized compiled code is faster than interpretation anyway. Also, C1 and C2 do not compile all of the code. If the function looks simple enough, it is highly likely that C2 will not help us and will not even run (we will also save time on profiling!). If C1 is busy compiling, then profiling can continue, C1's work will be interrupted and compilation with C2 starts.
JavaScript Core has even more levels! In fact, there are three JITs . The JSC interpreter does some light profiling, then goes to Baseline JIT, then DFG (Data Flow Graph) JIT, and finally FTL (Faster than Light) JIT. With so many levels, the meaning of de-optimization is no longer limited to the transition from compiler to interpreter, de-optimization can be performed starting with DFG and ending with Baseline JIT (this is not the case in the case of Hotspot C2-> C1). All de-optimizations and transitions to the next level are performed using OSR (Stack Override).
Baseline JIT connects after about 100 executions, and DFG JIT after about 1000 (with some exceptions). This means that the JIT gets the compiled code much faster than the same Pypy (which takes about 3000 executions). Layering allows the JIT to try to correlate the duration of code execution with the duration of its optimization. There are a bunch of tricks about what kind of optimization (inlining, casting, etc.) to perform at each of the levels, and therefore this strategy is optimal.
Helpful Sources
- How LuaJIT's Trace Compiler Works from Mike Pall
- Impact of Meta-tracing on VMs by Laurie Tratt
- Pypy Escape Analysis
- Why Users aren't More Happy with VMs by Laurie Tratt
- About JS engines:
- List of V8 Compiler Options
- JSCore Replacing their LLVM Backend for a "Faster Than Light" JIT
- About deoptimization:
- Deoptimizing TruffleRuby Lazy Initialization by me
- Deoptimizing Ruby by Chris Seaton
- V8 Lazy Deopts
- Graal:
- One VM to Rule Them All (a paper)
- High Performance C Extensions by Chris Seaton
- Understanding Graal Graphs by Chris Seaton
- Top 10 Things to do with GraalVM by Chris Seaton
- :
- Partial Evaluation vs Meta-tracing
- Paper that introduces partial evaluation for Graal
- :
- Benchmarking correctly is hard by Julia Evans