I often say: if you believe that technology is magic, then we risk becoming its hostages . I recently got into this situation, but luckily I was saved by open source.
As of this writing, Garmin is suffering from a massive ransomware attack . It affected me because I own a Garmin Instinct watch . I am very pleased with them and in many ways they are just magical, so many possibilities are packed into such a tiny gadget.
In addition, I have a hobby - rowing on an outrigger [outrigger canoe - approx. per.]
I believe a GPS watch is an indispensable safety feature, especially in navigation, because it is difficult to judge the speed of the water when you are more than a few hundred meters from the ground. If you are caught in a bad current, without understanding the situation, you risk being thrown into the sea or even worse.
There can be extreme currents around Singapore. As the tides change, the South China Sea eventually finds its way into the Andaman Sea through the Singapore Strait, triggering treacherous currents that change over time. So after every stroke, my GPS data is uploaded to the Garmin Connect cloud for route review to flag dangerous changes in tidal currents.
While uploading such data to Garmin's cloud presents a clear and real privacy risk, we all understand the trade-off: there is little time to worry about such things, and the service worked well out of the box.
Until yesterday.
We were just hitting some particularly unusual currents, and my rowing partner wanted to see the speeds in some difficult places. I went into the app to get the data and ... well, I found out that Garmin was under attack.
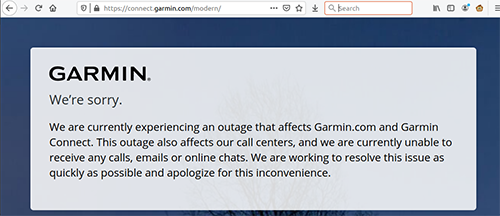
Garmin data has been taken hostage, including my personal rowing data: a small part of my life has become hostage to technology.
A bunch of friends told me to try Strava. The good news is Garmin allows you to extract data files from your Instinct watch for uploading to third-party services. You just need to connect the watch to a regular USB port, and it will appear as a mass storage device.
The bad news is, when I tried to create a Strava account, all the red flags went off. The website is full of dark templates, and after clicking the Deny Strava Access to My Health Data button, a whole series of dialog boxes appeared:

Click

Deny ... Click Deny Permission ...

Click OK ...
Three clicks to deny access, and if you relaxedly continue to press the lower button, then you will make another choice - by accident. After that, I was greeted with an eerie list of people to follow ( did they learn so much about me from the same email address? ) And then a tricky dialog box where if you answer incorrectly, you will be prompted to enter your credit card information as part of the “free trial version ".
Since Garmin has already made more than $ 200 selling the device, collecting my personal data is just dessert; but for Strava, my data is the main course. Personally, it's pretty clear to me that Strava is making it clear to its investors that they will make a big profit by monetizing my personal data, including my health information.
This is absolutely unacceptable to me. Rather than freeing data from collateral, going from Garmin to Strava is like going from a frying pan into a fire.
I plan to go out on the boat again the day after tomorrow and it would be great to get some speed analytics. But I was so angry with Strava that I no longer looked for another option, but decided to develop my own alternative with reliable protection of personal data.
I happily discovered an open source utility calledgpsbabel ( thanks to the developers! I'm annoying! ), which converts data from the semi - (?) proprietary Garmin format to a compatible .GPX format. From there, I was able to extract the XML parsing chunks and combine it with OpenStreetMaps via the Folium API to create custom maps with my data.
Even though I got "lost" trying to use the Google Maps API, which puts horrible "development-only" watermarks on all map tiles, it only took one evening. Not the best waste of my time, all things considered, but it was mostly a matter of finding the right open source pieces and gluing them together in Python (by the way, Python is a great glue, but terrible structural stuff. Don't make big projects out of it). The quality of the code is pretty shitty, but Python allows it, and it does its job. With these caveats in mind, you can use it as a starting point for looking for something better.
Now I have complete control over my data and can visualize it meaningfully. For instance,display the speed as a heat map throughout the course with circles proportional to the speed at the moment, and text that, when hovering the cursor, shows the specific speed and heart rate at the moment: This is the data I specifically need in the required format, no more and no less ... In addition, the issue is a single html file that can be directly linked to . No analytics, no cookies. Only the data that I decided to share with you. Here is the piece of code that I am using to plot the map data:

def plot_osm_map(track, output='speed-map.html', hr=None):
    for i in range(len(track['speed'])):
        track['speed'][i] = speed_conversion(track['speed'][i])
    speeds = track['speed']
    minima = min(speeds)
    maxima = max(speeds)

    norm = matplotlib.colors.Normalize(vmin=minima, vmax=maxima, clip=True)
    mapper = cm.ScalarMappable(norm=norm, cmap=cm.plasma)
    m = folium.Map(location=[track['lat'][0], track['lon'][0]], zoom_start=15)
    for index in range(len(track['lat'])):
        if track['speed'][index] == 0:
            track['speed'][index] = 0.01
        else:
            track['speed'][index] = track['speed'][index]
        if hr:
            try:
                tooltip=str(track['speed'][index]) + ' ' + str(hr['hr'][index]) +'bpm'
            except:
                tooltip=str(track['speed'][index])
        else:
            tooltip=str(track['speed'][index])
        folium.CircleMarker(
            location=(track['lat'][index], track['lon'][index]),
            radius=track['speed'][index]**2 / 8,
            tooltip=tooltip,
            fill_color=matplotlib.colors.to_hex(mapper.to_rgba(track['speed'][index])),
            fill=True,
            fill_opacity=0.2,
            weight=0,
        ).add_to(m)

    m.save(output)
As I said, the code isn't the best quality, but it works and was quick to write.
Better yet, I don't upload any more data to the cloud - there is a certain intangible pleasure in removing another surveillance channel from my life without losing anything in quality or convenience.
It's also an interesting metahistory about how well the open source ecosystem is doing today. When the Garmin cloud went down, I was able to replace the most important features in just one day by putting together various open source frameworks.
The point of open source is not to ritually compile material. The point is realizing that technology is not magic: that there is an alternative that anyone can choose for themselves in order to free themselves from a potential hostage situation. If we want it, open source makes it possible to create and run our own tools and services.
See also: