Continuing the cycle of notes about real problems in Data Science, today we will deal with a living problem and see what problems await us along the way.
For example, in addition to Data Science, I have been fond of athletics for a long time and one of the goals in running for me, of course, is a marathon. And where is the marathon there and the question is - how much to run? Often the answer to this question is given by eye - "well, on average, they are running" or "this is X good time"!
And today we will get down to an important matter - we will apply Data Science in real life and answer the question:
What do the data about the Moscow marathon tell us?
More precisely, as is already clear from the table at the beginning - we will collect data, figure out who ran and how. And at the same time it will help us understand whether we should meddle and allow us to sensibly assess our strengths!
TL; DR: I collected data on the Moscow marathon races for 2018/2019, analyzed the time and performance of the participants, and made the code and data publicly available.
Data collection
Through quick googling, we found the results of the past couple of years, 2019 and 2018 .
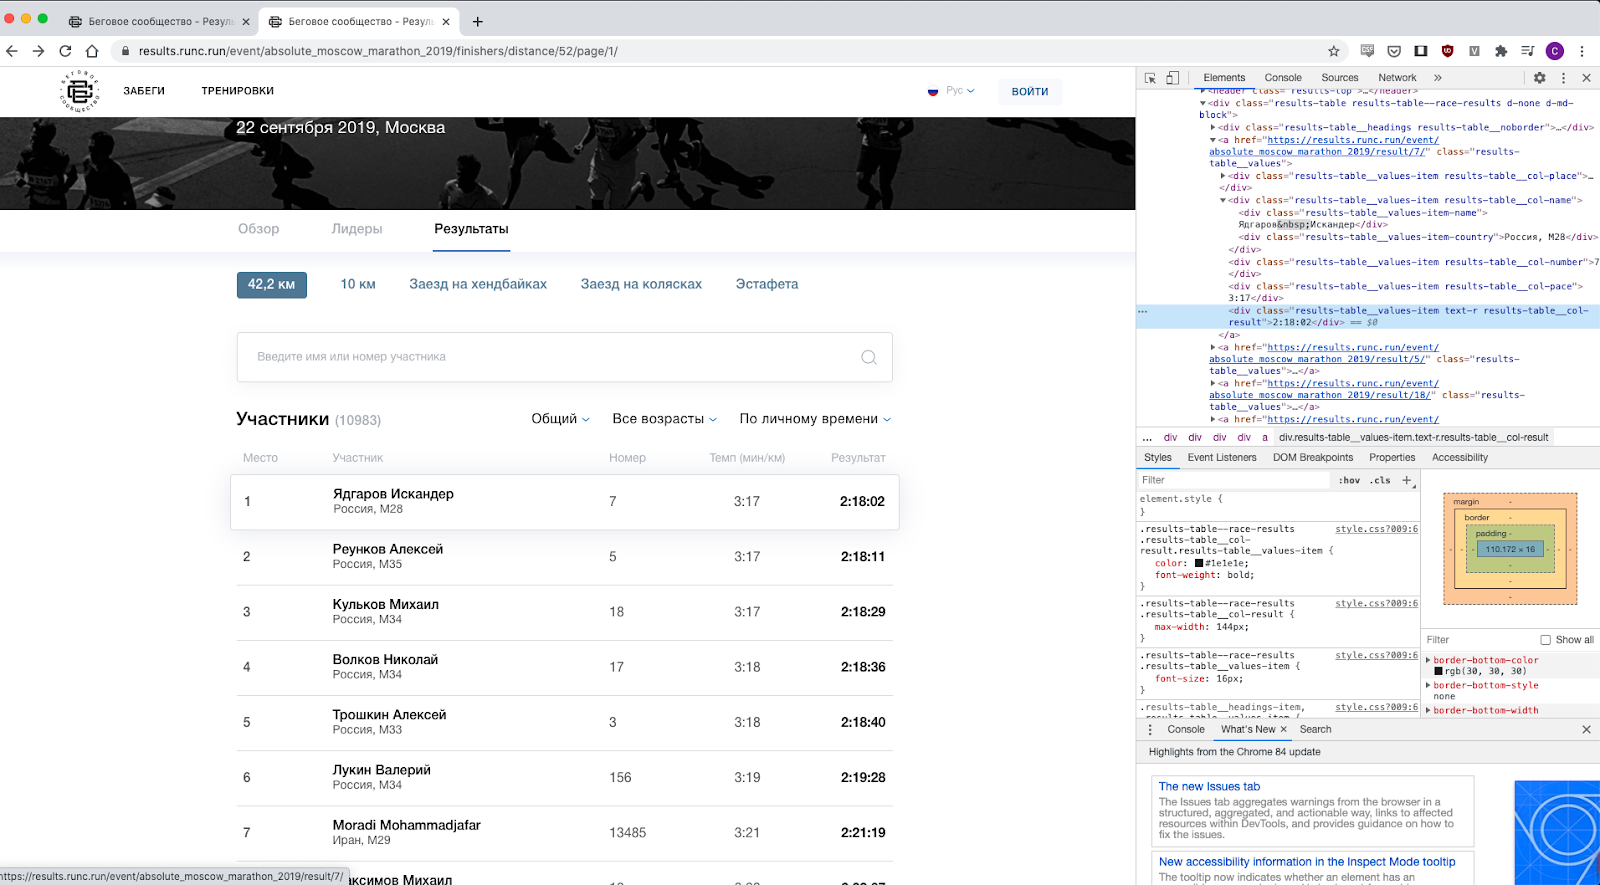
I looked carefully at the web page, it became clear that the data is quite easy to get - you just need to figure out which classes are responsible for what, for example, the class “results-table__col-result”, of course, for the result, etc.
It remains to understand how to get all the data from there.
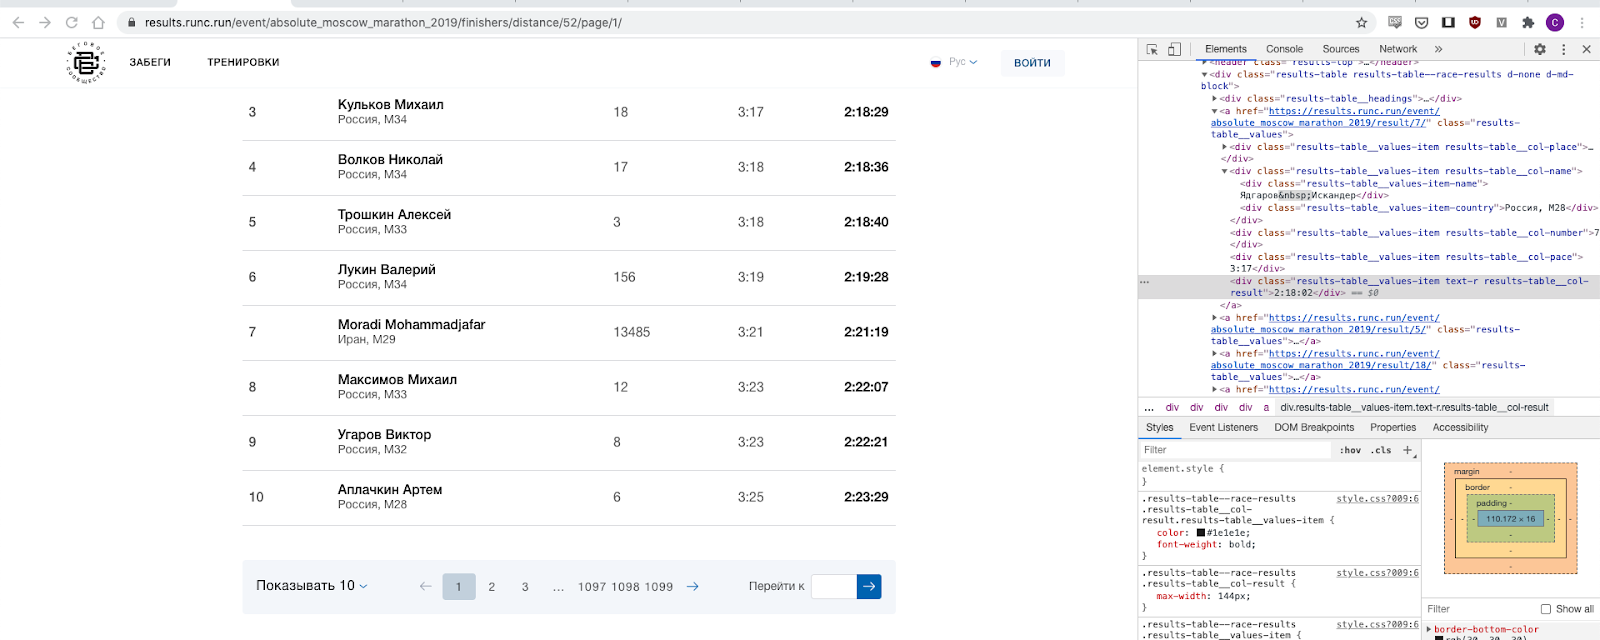
And this, it turns out, is not difficult, because there is direct pagination and we actually iterate over the entire segment of numbers. Bingo, I post the collected data for 2019 and 2018 here, if someone is interested in further analysis, then the data itself can be downloaded here: here and here .
What did I have to tinker with?
- — - , , - (, ).
- - , — « ».
- Url- — - , url — , — .
- — — 2016, 2017… , 2019 — , — , — , , .
- NA: DNF, DQ, "-" — , , .
- Data types: time here is a timedelta, but due to restarts and invalid values, we have to work with filters and clearing time values so that we operate on pure time results to calculate averages - all the results here are averaging over those who finished and who has a valid time.
And here is the spoiler code in case anyone decides to continue collecting interesting running data.
Parser code
from bs4 import BeautifulSoup
import requests
from tqdm import tqdm

def main():
    for year in [2018]:
        print(f"processing year: {year}")
        crawl_year(year)


def crawl_year(year):
    outfilename = f"results_{year}.txt"
    with open(outfilename, "a") as fout:
        print("name,result,place,country,category", file=fout)
    # parametorize year
    for i in tqdm(range(1, 1100)):
        url = f"https://results.runc.run/event/absolute_moscow_marathon_2018/finishers/distance/1/page/{i}/"
        html = requests.get(url)
        soup = BeautifulSoup(html.text)
        names = list(
            map(
                lambda x: x.text.strip(),
                soup.find_all("div", {"class": "results-table__values-item-name"}),
            )
        )
        results = list(
            map(
                lambda x: x.text.strip(),
                soup.find_all("div", {"class": "results-table__col-result"}),
            )
        )[1:]
        categories = list(
            map(
                lambda x: x.text.strip().replace(" ",""),
                soup.find_all("div", {"class": "results-table__values-item-country"}),
            )
        )
        places = list(
            map(
                lambda x: x.text.strip(),
                soup.find_all("div", {"class": "results-table__col-place"}),
            )
        )[1:]
        for name, result, place, category in zip(names, results, places, categories):
            with open(outfilename, "a") as fout:
                print(name, result, place, category, sep=",", file=fout)


if __name__ == "__main__":
    main()
```
Analysis of time and results
Let's move on to analyzing the data and the actual race results.
Used pandas, numpy, matplotlib and seaborn - all in the classics.
In addition to the average values for all arrays, we will separately consider the following groups:
- Men - since I belong to this group, these results are interesting to me.
- Women are for symmetry.
- 35 — «» , — .
- 2018 2019 — ?.
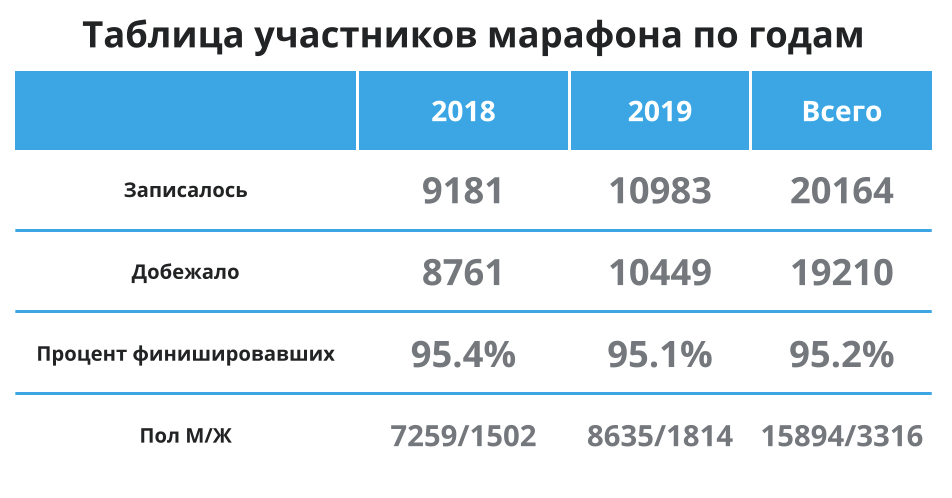
First, let's take a quick glance at the table below - here again, so as not to scroll: there are more participants, 95% on average reach the finish line and most of the participants are men. Okay, this means that on average I am in the main group and the data on average should represent the average time well for me. Let's continue.
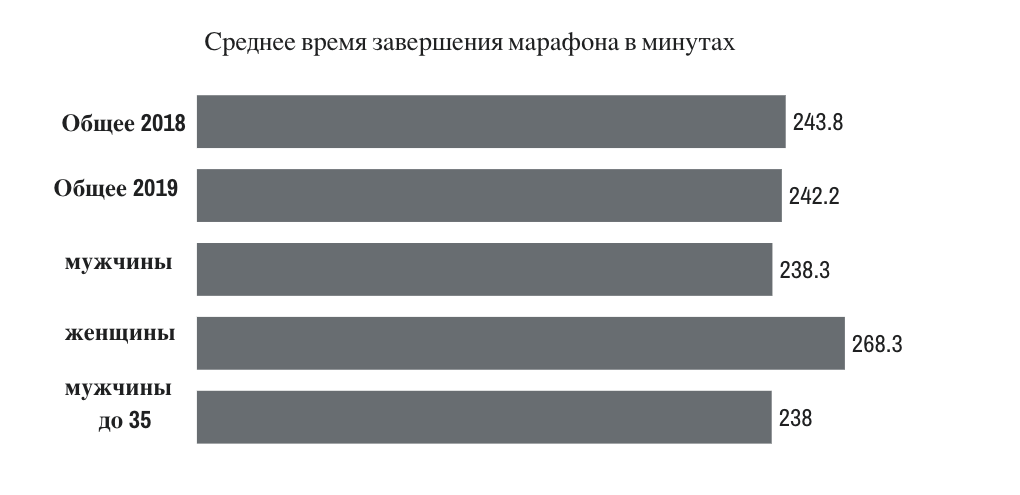
As we can see, the averages for 2018 and 2019 practically did not change - about 1.5 minutes were faster for runners in 2019. The difference between the groups of interest to me is negligible.
Let's move on to distributions as a whole. And first to the total time of the race.
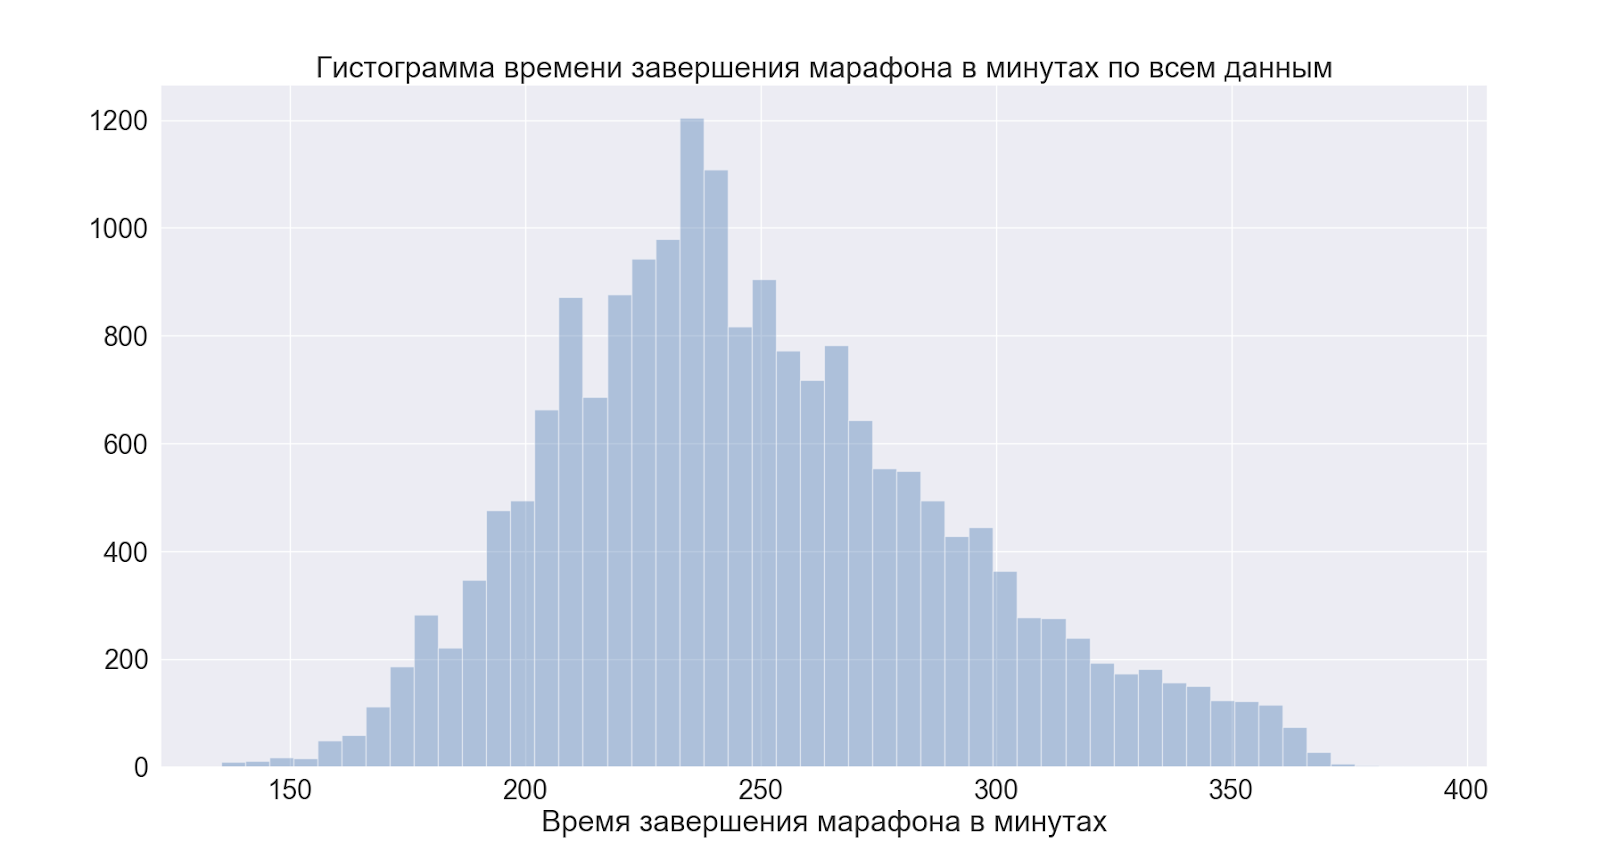
As we see the peak just before 4 o'clock - this is a conditional mark for those who like to run well = run out of 4 o'clock, the data confirms popular rumor.
Next, let's see how the situation has changed on average over the year.
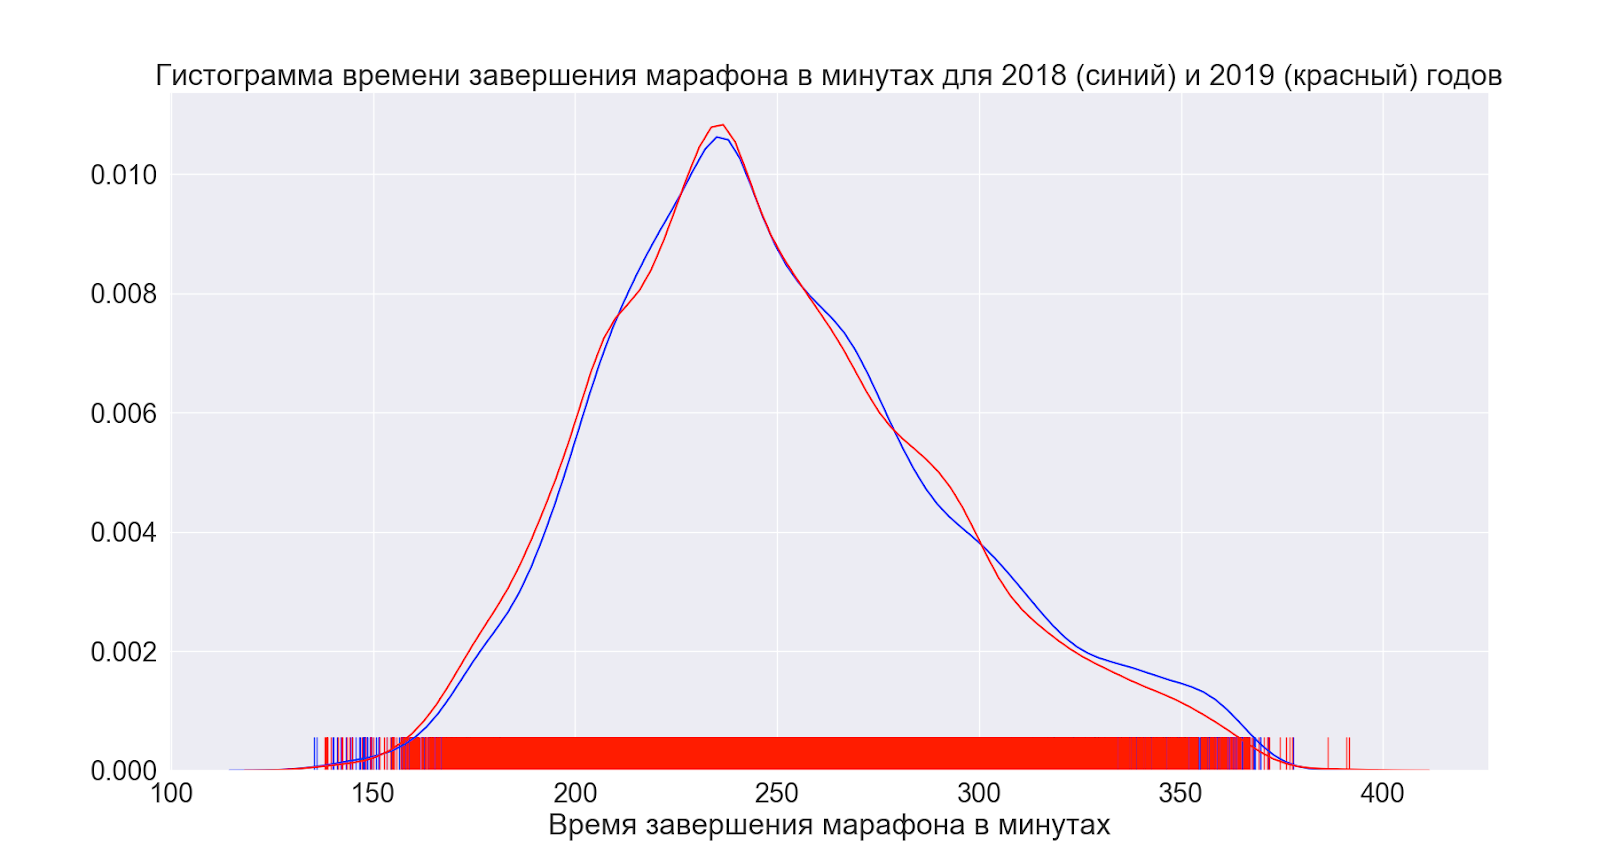
As we can see, in fact, nothing has changed at all - the distributions look virtually identical.
Next, consider the distributions by gender:

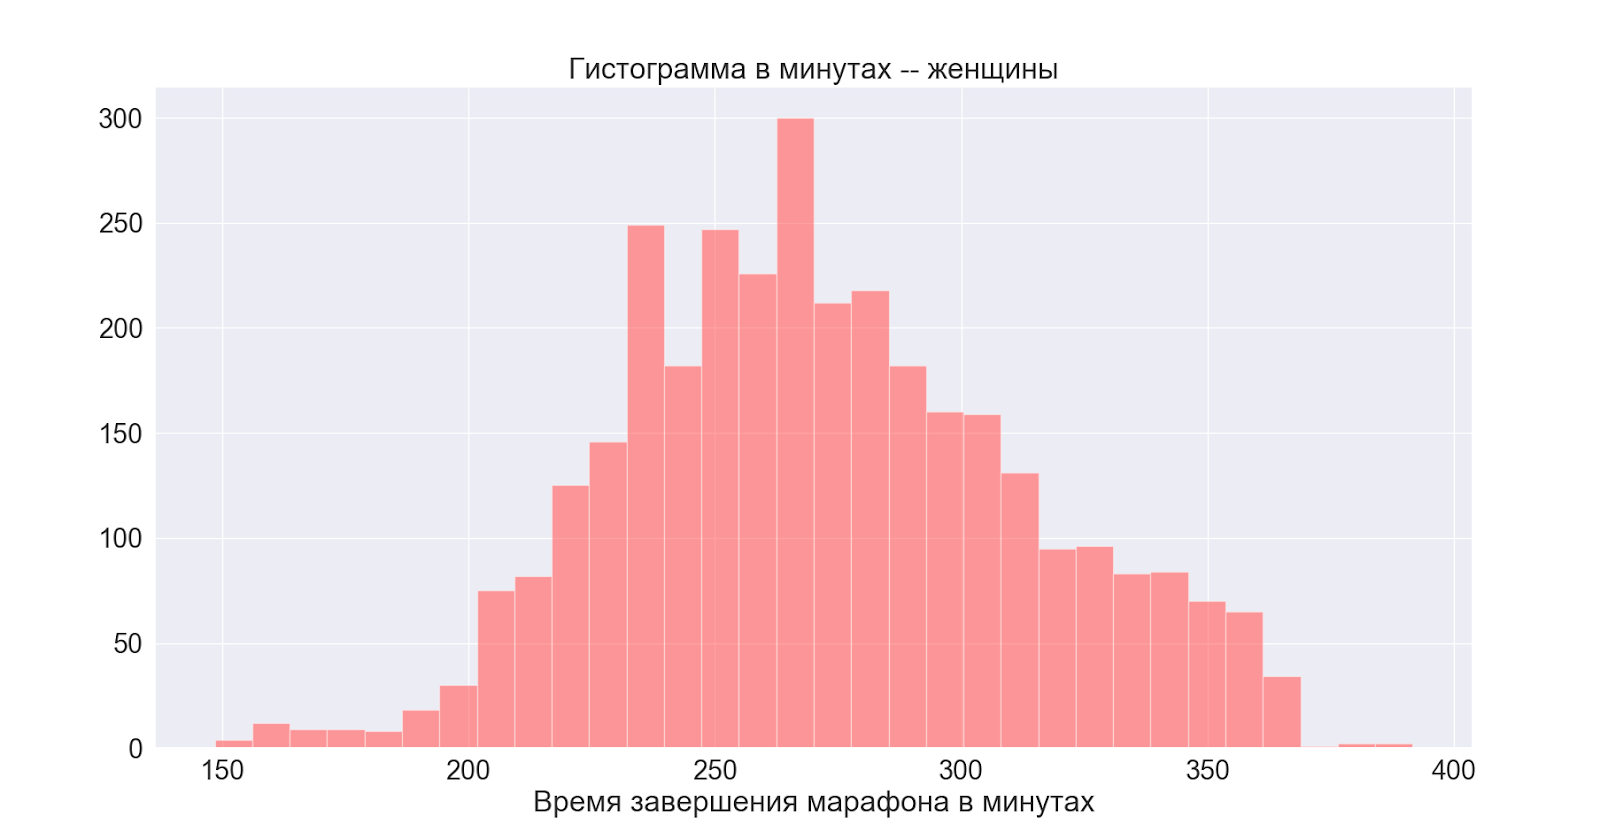
In general, both distributions are normal with slightly different centers - we see that the peak in the male also manifests itself on the main (general) distribution.
Separately, let's move on to the group that is most interesting to me:
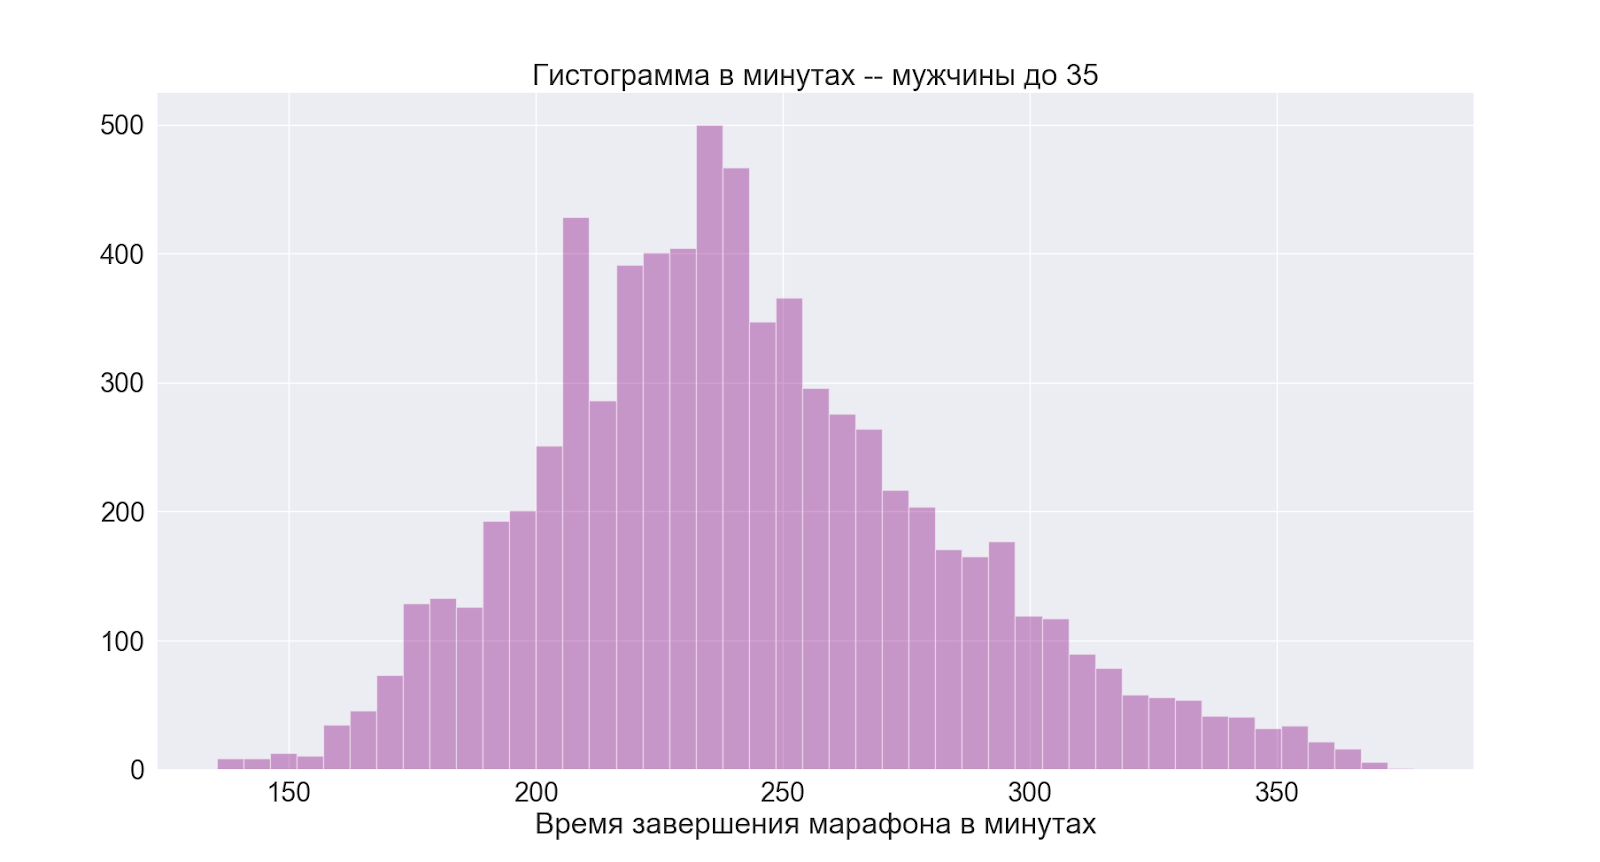
As we can see, the picture is basically the same as in the male group as a whole.
From this we conclude that 4 hours is also a good average time for me.
Studying the improvements of the participants 2018 → 2019
Of the interesting things: for some reason I thought that now I would quickly collect data and I could go deeper into the analysis, look for patterns there for hours, and so on. It turned out to be the other way around, data collection turned out to be more difficult than the analysis itself - according to the classics, working with the network, raw data, cleaning, formatting, casting, etc., took much longer than analysis and visualization. Do not forget that little things take up a little time - but there are quite a few of them [little things], and in the end they will eat up your whole evening.
Separately, I wanted to see how the people who participated both times improved their results, by comparing the data between the years, I was able to establish the following:
- 14 people participated both years and never finished
- 89 people ran at 18 m, but failed at 19
- 124 vice versa
- Those who were able to run both times improved their result by 4 minutes on average
But here everything turned out to be quite interesting:
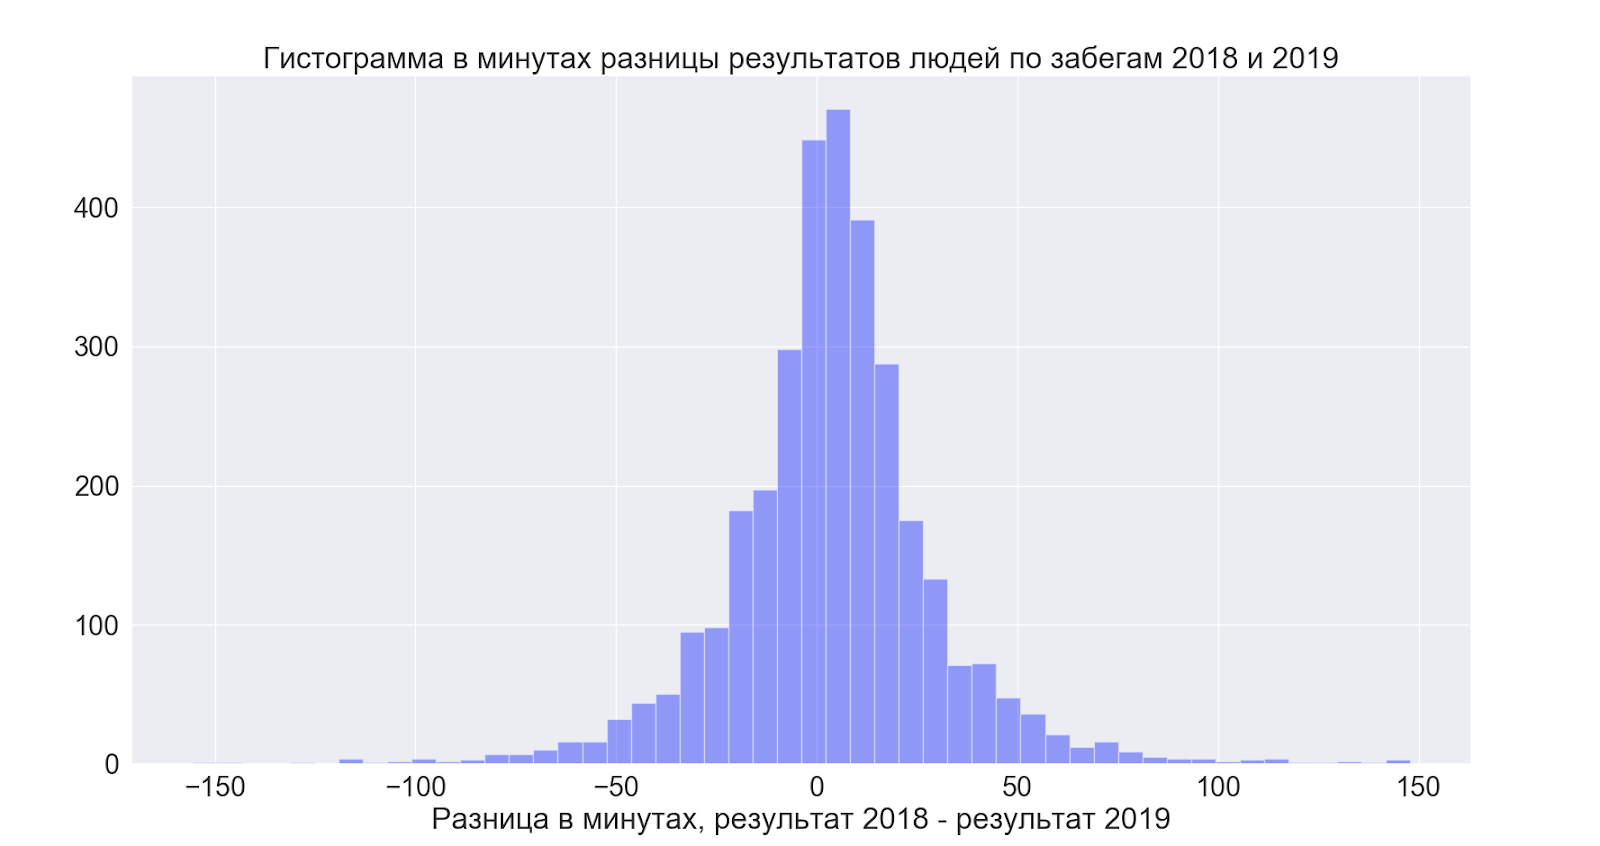
That is, on average, people slightly improve the results - but in general the spread is incredible and in both directions - that is, it is good to hope that it will be better - but judging by the data, it turns out in general as you like!
conclusions
I made the following conclusions for myself from the analyzed data
- Overall, 4 hours is a good average target.
- The main group of runners is already at the very competitive age (and in the same group with me).
- On average, people slightly improve their results, but in general, judging by the data, how they get there at all.
- The average results for the entire race are about the same for both years.
- It is very comfortable to talk about the marathon from the couch.
