
General information
You use the Chrome developer tools to debug your code.
The command to open developer tools
Sometimes you go into the Console to use the console's capabilities to examine the data your program outputs. Sometimes you look at the Elements panel to look at the CSS used to style the DOM elements.
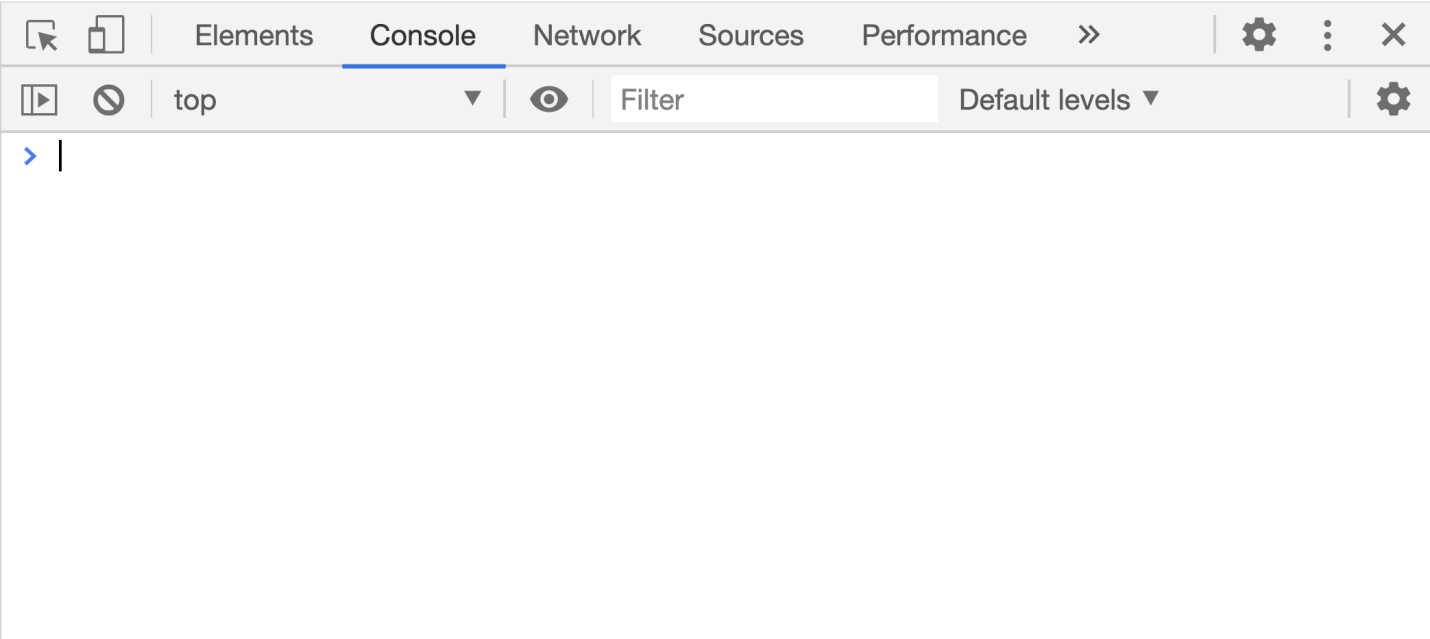
Console Panel
But do you know Chrome developer tools well? In fact, there are many powerful, but not well-known features that can significantly improve your productivity.
Here I am going to talk about the most useful such features that I hope you will find useful.
1. Menu item Run command
To begin with, I would like to briefly tell you about the developer tools menu item called Run command. This menu item for Chrome is like a shell for Linux. It allows you to enter commands to control Chrome.
In order to get to this menu item, open the developer tools, after which you can immediately use the appropriate keyboard shortcut:
- On Windows -
Ctrl + Shift + P. - In MacOS -
Cmd + Shift + P.
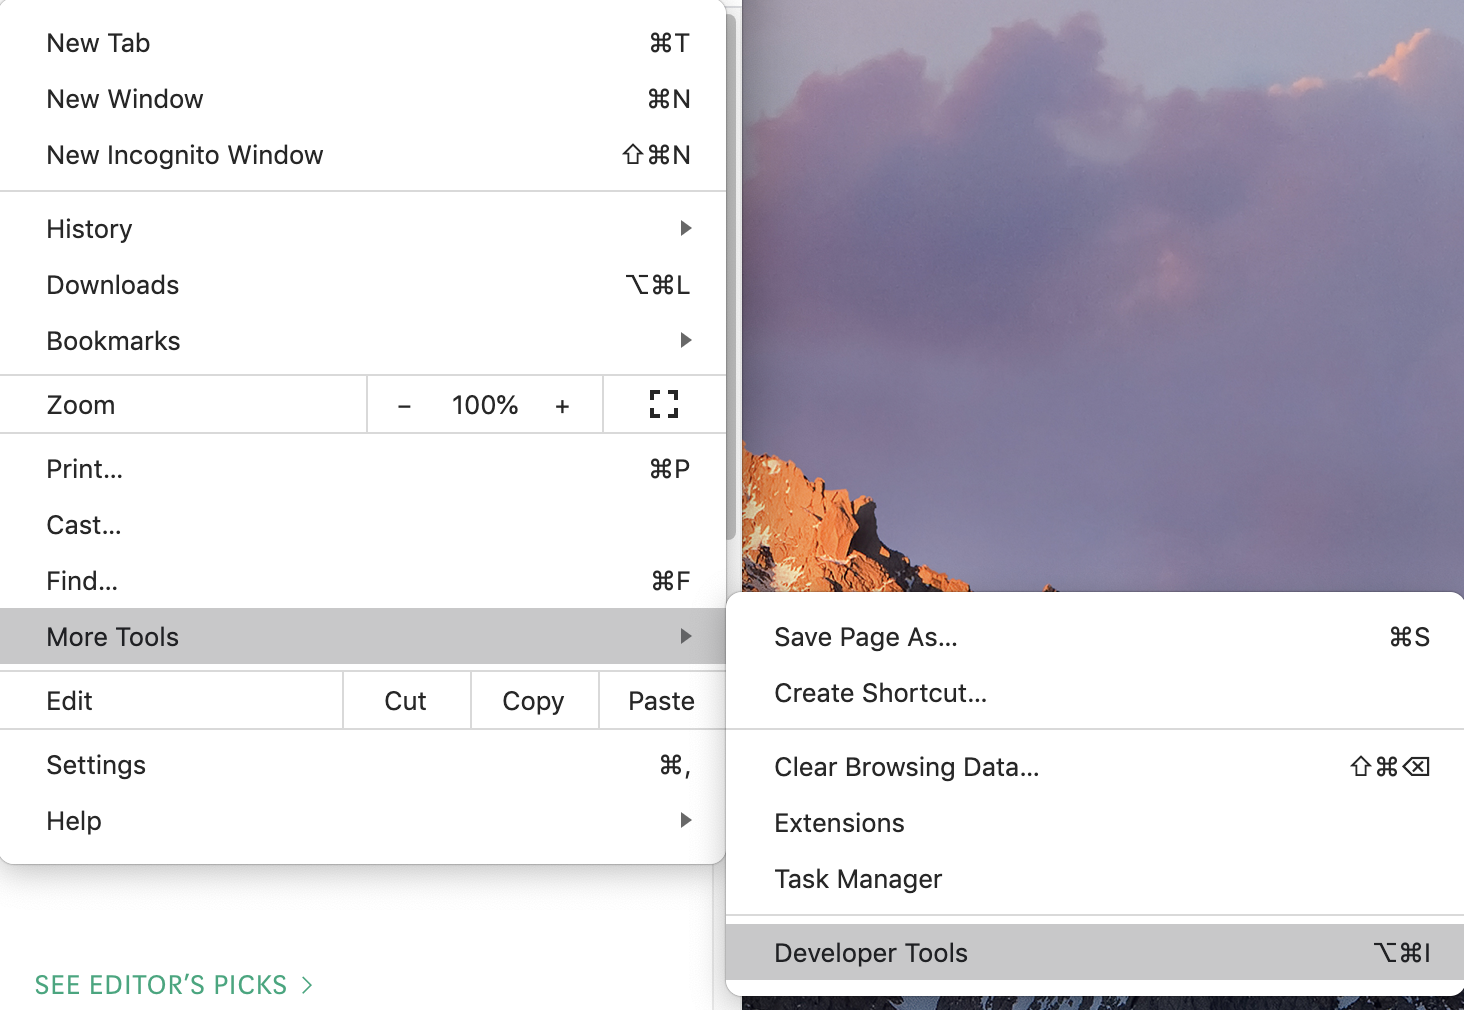
Or, you can simply click on the three dots on the right side of the developer tools header area and select Run command from the menu that appears.

Run command menu item
After that, the command panel will open, in which you can find a lot of commands that allow you to perform a lot of interesting things.

Command Panel
Let's talk about some commands from this panel.
2. Advanced mechanisms for creating screenshots
A web developer sometimes needs to take a screenshot of a portion of the screen. I am sure you already have a very convenient program for solving this problem. Here are some of the typical tasks for taking screenshots:
- Taking screenshots of entire pages, even those parts of them that are not visible in the browser window.
- Capture a copy of an area of the screen that is specific to a specific DOM element.
These are common tasks, but they are not easy to accomplish with all sorts of screenshot software. In order to deal with them, we can use the capabilities of the above-described Run command menu command. In particular, we are talking about the following commands:
- Screenshot Capture full size screenshot
- Screenshot Capture node screenshot
▍ Example
Open a page, such as the Medium section of the most popular JavaScript content.
Now open the command bar and select a command in it
Screenshot Capture full size screenshot.

The command to take a screenshot of the entire page
We will have a screenshot of the entire page, which will go to the downloads folder.
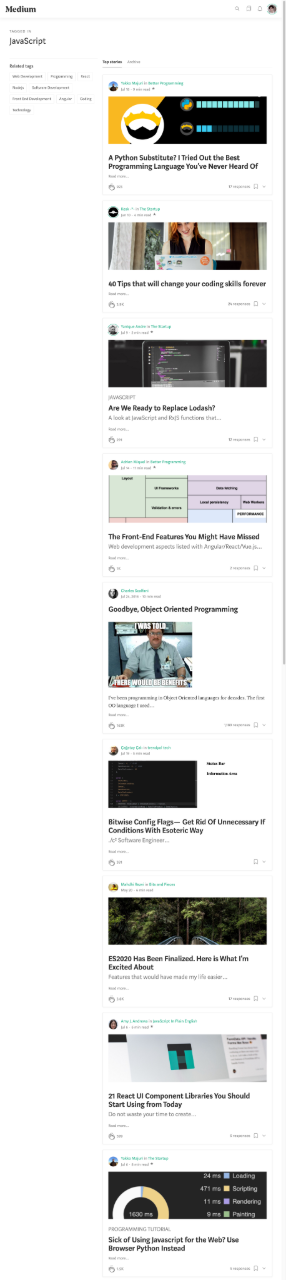
Screenshot of the whole page
As you can see, the image is very high. I have reduced it here, for convenience. In fact, this is a large quality image.
Likewise, if you need to take a screenshot of a DOM element, you can use a third-party program, which, however, will not allow you to get an image that relates exactly to the desired element. The team will help us to solve this problem
Screenshot Capture node screenshot.
They use it like this: first, they select the desired element in the Elements panel, and then execute the command.
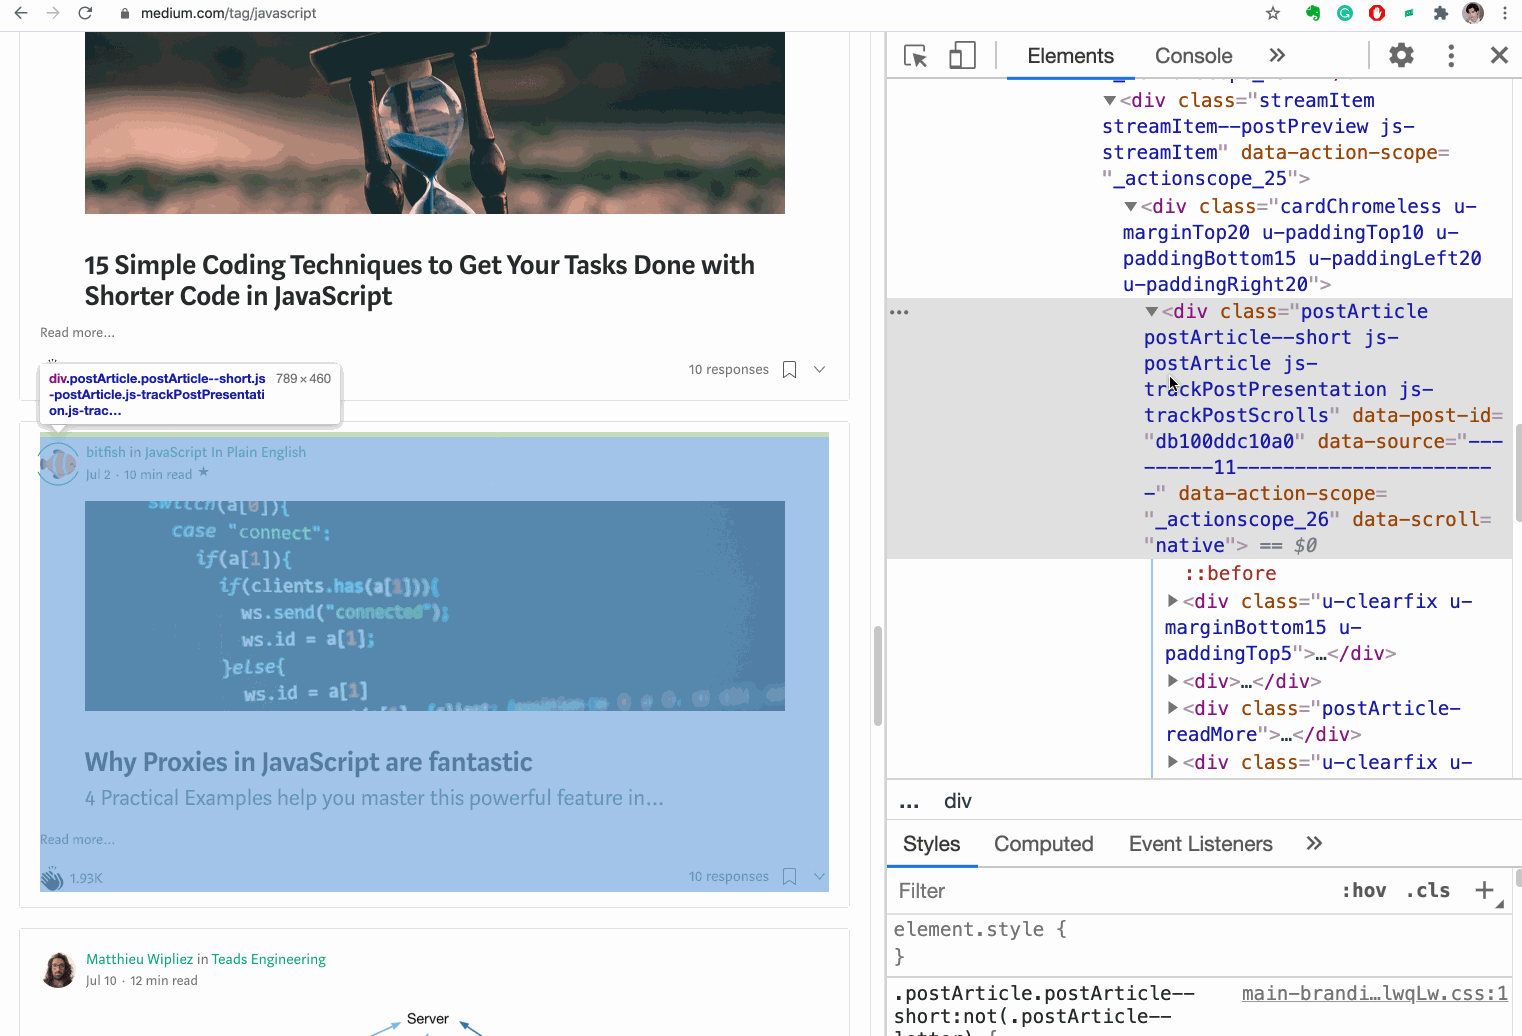
Capturing a screenshot of an area of the screen associated with a specific DOM element
This is what the screenshot looks like when taken in the previous animated image.

DOM element screenshot
3. Referring to the results of the last operation in the console
The console is often used for debugging code. Imagine you need to learn how to reverse a string using JavaScript. You searched the Internet and found this piece of code:
'abcde'.split('').reverse().join('')
You tried running this code in the console and it appears to work correctly.

Checking the code in the console
So, this code "turns" the line. However, you are confused about how the
split(),reverse()andmethods workjoin(). You do not know what exactly they work with in the intermediate stages of "flipping" the line. Therefore, you decide to step through this code. You start with the first method, get its result, run the second method on this result, and so on.

Exploring the Code
After completing these experiments, it is quite possible to understand exactly how the original piece of code works.
But working in this style involves a lot of unnecessary actions. You can make mistakes here, and it all looks pretty messy. In order to improve the situation, it is enough to know that in the developer tools console you can use a "magic" variable
$_that allows you to refer to the result of the last operation performed.
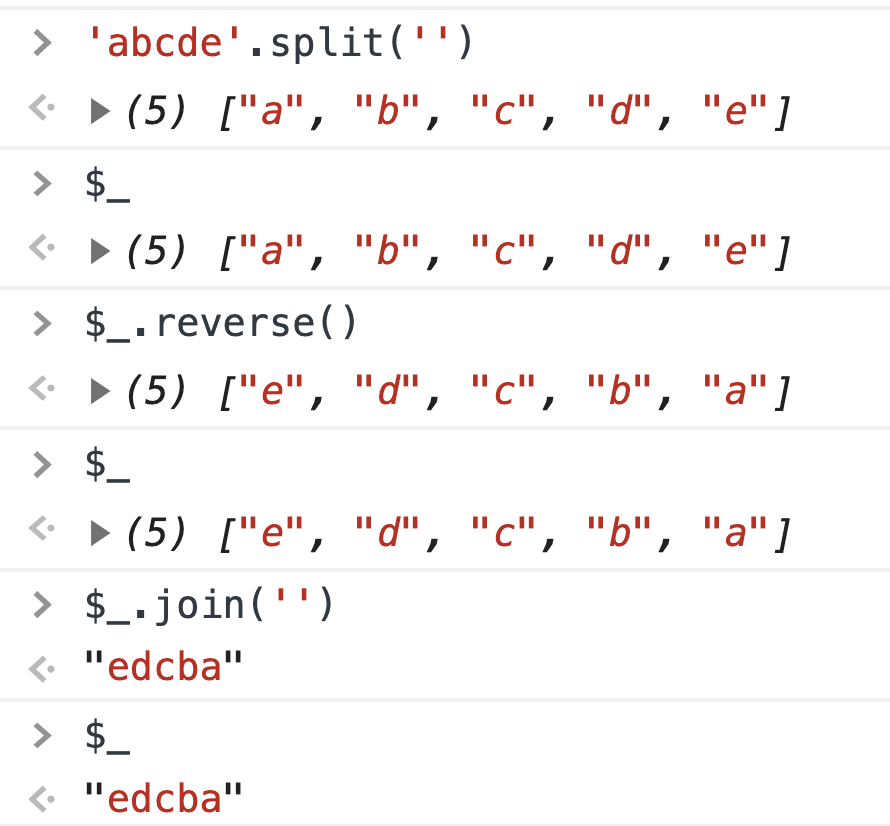
Using $ _
As you can see,
$_this is a special variable, the value of which always equals the result of the last operation performed in the console. This variable can help you very well when debugging your code.

Example of using $ _
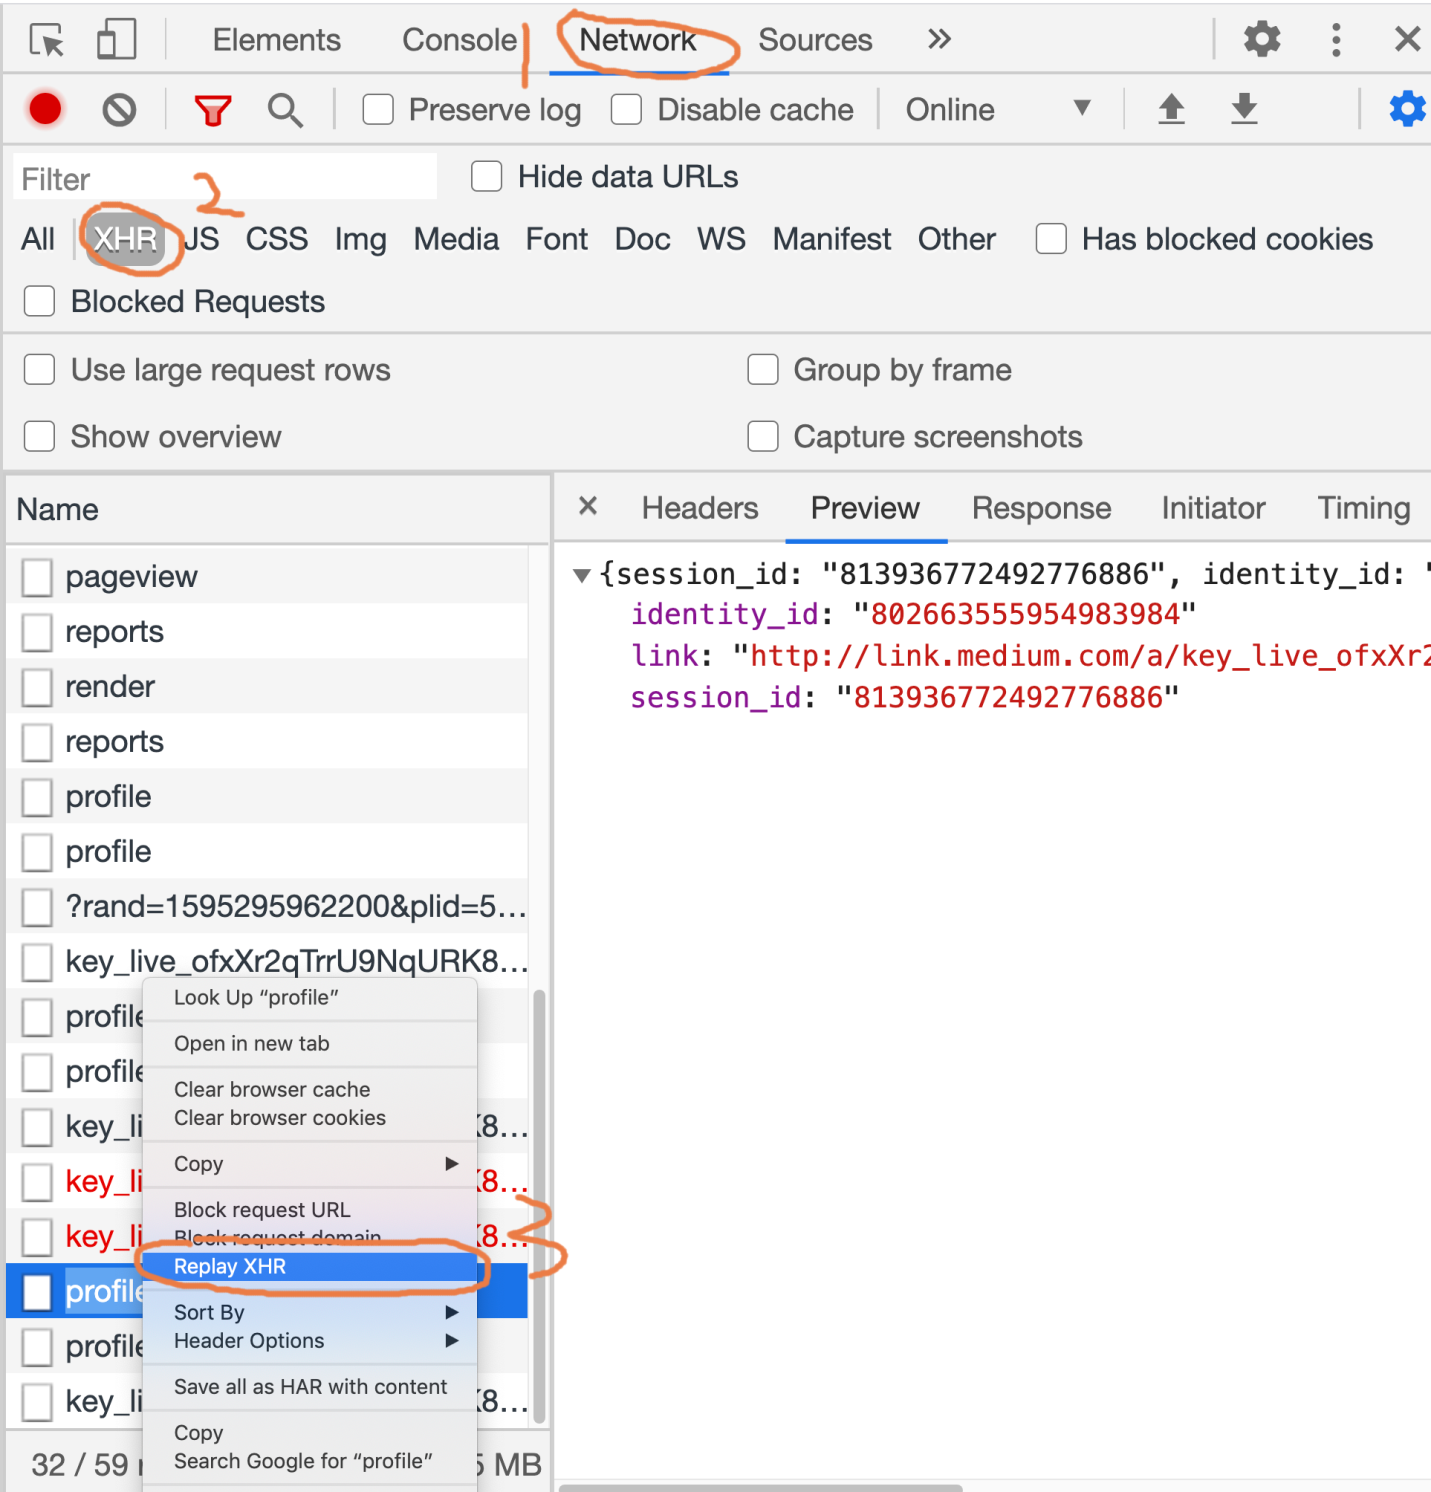
4. Repeat sending the XHR request
When working on front-end projects, it is often necessary to use the XHR API to make requests to the backend to get data. What if you need to resend an already sent XHR request?
If a novice developer solves this problem, he will simply refresh the page. But constantly refreshing pages to resubmit requests can be overwhelming. In fact, you can work with queries using the tools of the Network panel.
XHR request retry command
In order to re-execute an XHR request that has already been sent, proceed as follows:
- Open the Network panel.
- Click on the XHR button.
- Call the context menu of the request to be repeated.
- Select Replay XHR from the menu.
Here is an animated example of the above steps.

XHR request retry
5. Monitoring page load
It may take more than ten seconds for the page to fully load, from the very beginning of this process to the very end. In order to find out what exactly happens during the page load, you can organize monitoring of this process.
In Chrome developer tools, you can take screenshots of a page at different times of loading by setting the Capture screenshots flag in the Network panel.

Capture screenshots flag and monitoring page loading
By clicking on the screenshots, you can view the requests that were executed at the corresponding moments in time. A visual representation of the page loading process will give you a higher level of understanding than before of exactly what is happening on page load.
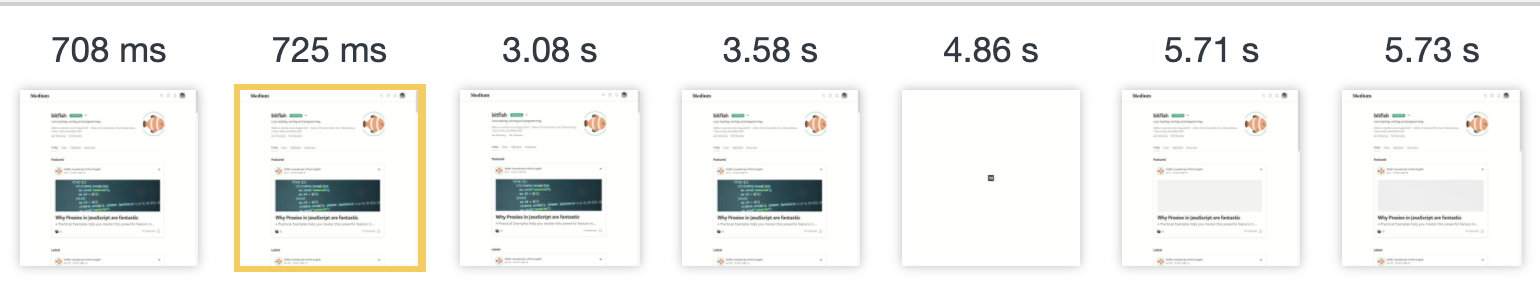
Page load analysis
6. Copying the content of JavaScript variables
Is it possible to copy the value of a JavaScript variable for later use of that value? It is possible that such a task may seem impossible to you, but in the Chrome console you can use a special command
copy()that allows you to copy the contents of variables to the clipboard.

Copying JS Variable Content
This function is not available in the ECMAScript standard. It is available to us thanks to Chrome.
7. Copying the image as Data URL
There are two ways to work with images displayed on web pages. The first way is to load images from external sources. The second is encoding images in the form of so-called Data URLs . You can read on MDN that a Data URL is a URL with the prefix: data. These URLs allow small files to be embedded directly into the document. They used to be called “Data URIs,” until the WHATWG retired that name.
Converting small images as Data URLs and embedding them directly in the page code reduces the number of HTTP requests that need to be made on page load. This, as a result, can speed up page loading.
How do I turn an image into a Data URL using Chrome?
Below is an animated demonstration of this process.
Copying an Image as a Data URL
8. Convenient representation of arrays of objects
Imagine we have an array of objects. For example - like this:
let users = [{name: 'Jon', age: 22},
  {name: 'bitfish', age: 30},
  {name: 'Alice', age: 33}]
Let's display it in the console.

Array of objects displayed in the console
As you can see, it is not very convenient to view it when it is displayed in this form. And if such an array is longer, and the elements that it contains have a more complex structure, then it will be even more difficult to deal with it.
Luckily for us, Chrome has a special feature
table()that lets you format arrays of objects.

Formatted Array of Objects
This function is often very useful.
9. Dragging objects in the Elements panel
Sometimes, while testing the interface, you need to change the position of some DOM elements of the page. In order to do this, we can use the ability of the Elements panel, which is to move any HTML elements in the page code.

Dragging and dropping an element
The above animation shows how I drag an element
<div>in the Elements panel to change the position of that element on the web page.
10. Referring to the currently selected item from the console
Let's talk about one more "magic" variable that can be used in the console. This is a variable
$0. It allows access from the console to an element that is highlighted in the Elements panel.

Referring to an element with $ 0
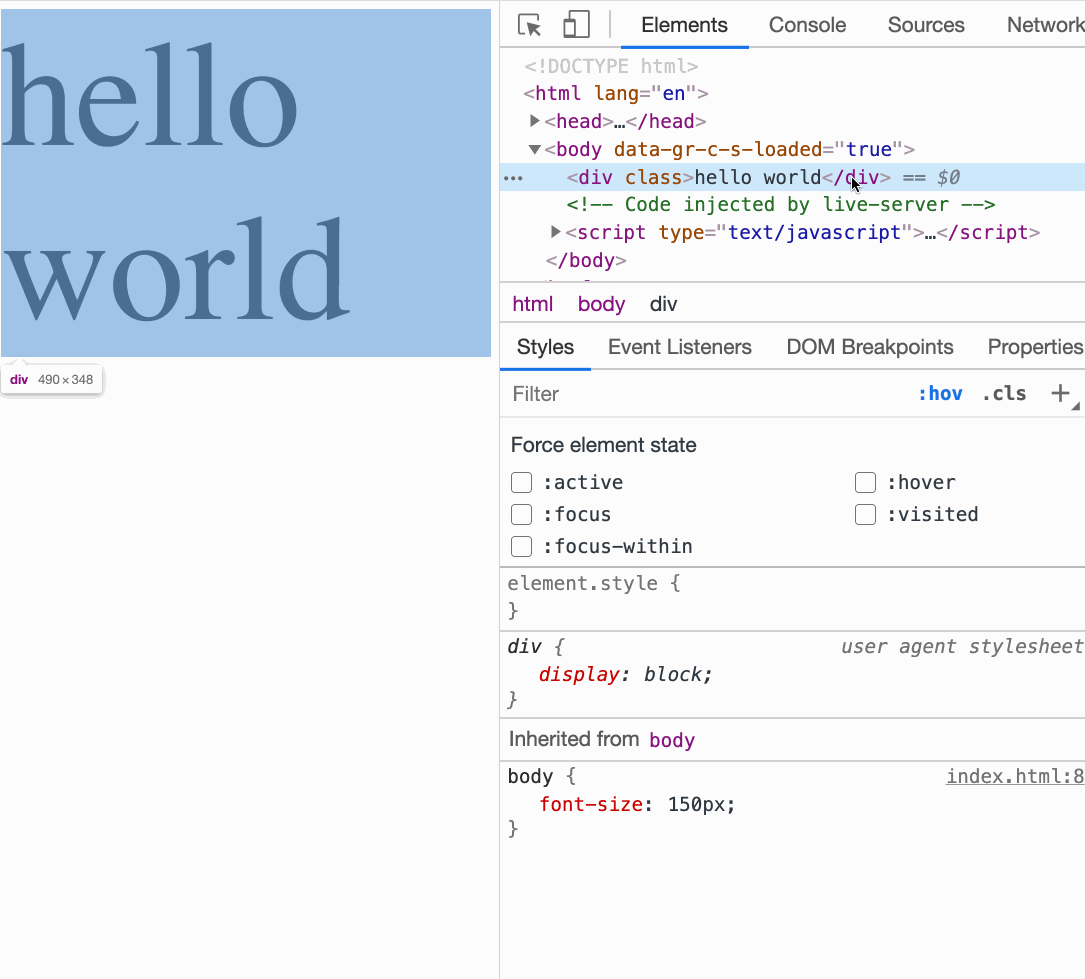
11. Exploring pseudo-classes
On MDN, you can learn the following about pseudo-classes:
Pseudo-classes provide the ability to style an element based not only on relationships in the DOM tree, but also based on external factors such as the history of visits (for example: visited), the state of the content (like: checked on some elements shape) or the position of the mouse cursor (for example: hover determines whether the mouse cursor is over an element).
For an element, you can provide styles related to various pseudo-classes. To test these styles, pseudo-classes can be manipulated directly from the Elements panel.

Managing pseudo-classes
▍ Example
Here is the code for the web page:
<!DOCTYPE html>
<html lang="en">
<head>
  <meta charset="UTF-8">
  <meta name="viewport" content="width=device-width, initial-scale=1.0">
  <title>Document</title>
  <style>
    body{
      font-size: 150px;
    }

    div:hover{
      color: red;
    }
    div:active{
      color: blue;
    }
    div:focus{
      color: brown;
    }
  </style>
</head>
<body>
  <div>hello world</div>
</body>
</html>
We need to check the styling of the pseudo-classes. To do this, we can use the Elements panel.
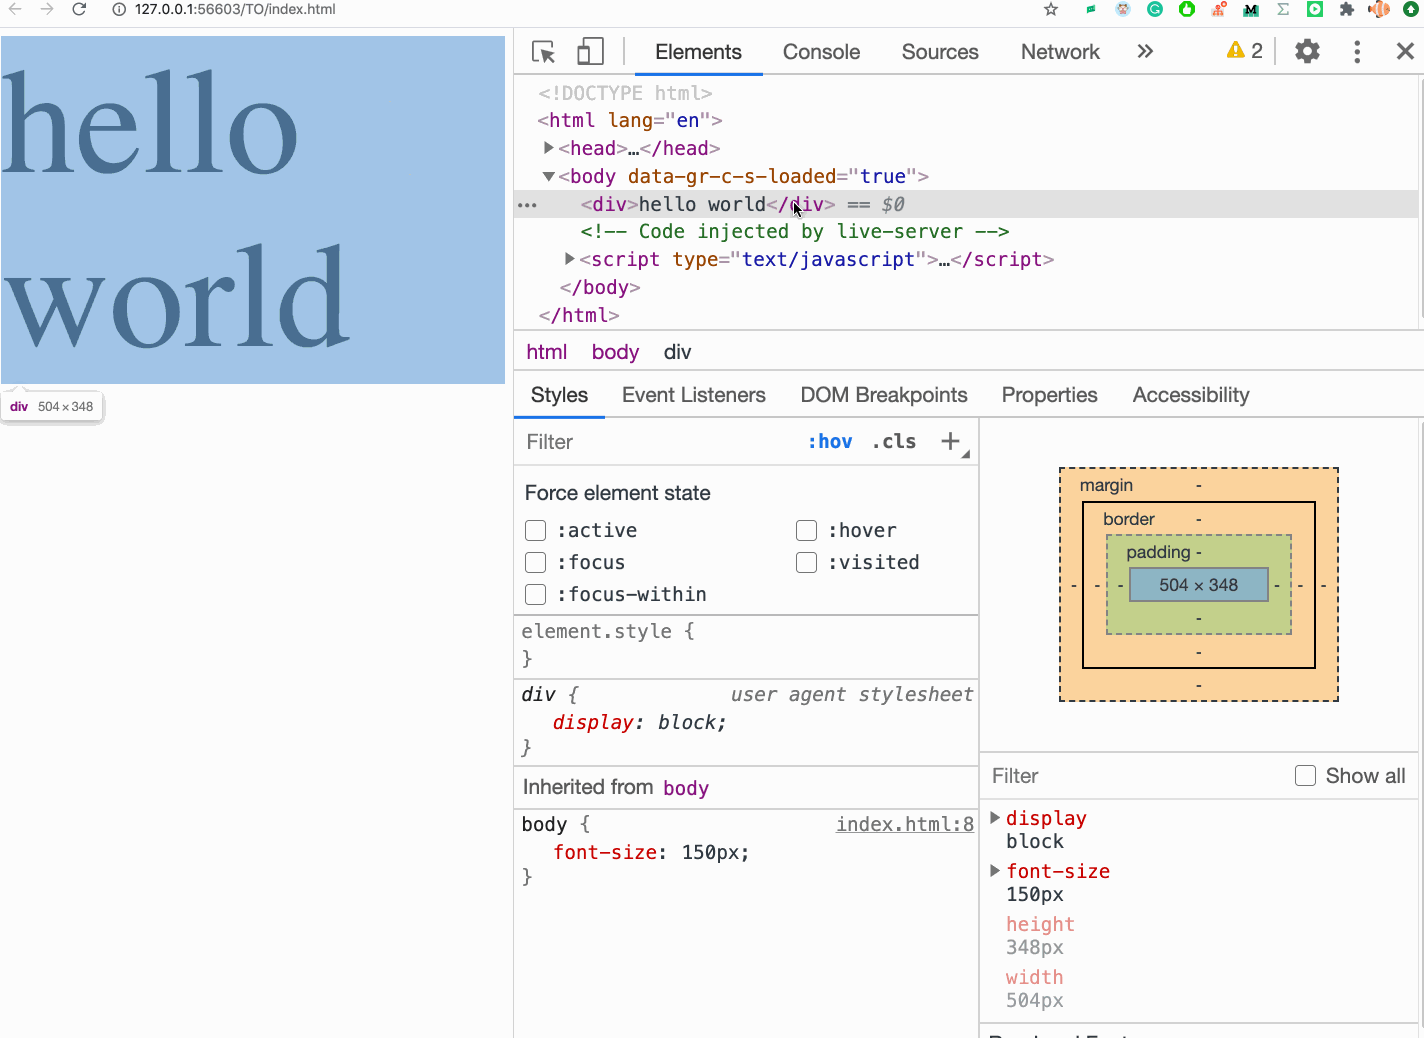
Exploring pseudo-class styles
12. Quick hide element
When debugging page styles, you often need to hide an element. To do this as quickly as possible, just select an element and press a key on the keyboard
H.
Quickly hiding an element
This will add a style
visibility: hidden !important;to the corresponding element.
13. Saving a reference to a DOM element in a temporary global variable
If we need to quickly get a reference to a DOM element in the console, we can perform the following sequence of actions:
- Select an item.
- Right-click on it to bring up the context menu.
- Select the Store as a global variable command from the menu.

Storing a DOM Element Reference as a Temporary Global Variable
What little-known features of the Chrome developer tools do you use?
