When working with big data, mistakes cannot be avoided. You need to get to the bottom of the data, prioritize, optimize, visualize the data, get the right ideas. According to surveys , 85% of companies are striving for data management, but only 37% report success in this area. In practice, studying negative experiences is difficult, because no one likes to talk about failures. Analysts will be happy to talk about successes, but as soon as it comes to mistakes, be prepared to hear about "noise accumulation", "false correlation" and "random endogeneity", and without any specifics. Are problems with big data really only theoretical?
Today we will explore the experience of real mistakes that have a tangible impact on users and analysts.
Sampling errors

In the article “ Big data: A big mistake? »Remembered an interesting story with a startup Street Bump. The company invited Boston residents to monitor the condition of the road surface using a mobile application. The software recorded the position of the smartphone and abnormal deviations from the norm: pits, bumps, potholes, etc. The received data was sent in real time to the desired addressee to the municipal services.
However, at some point, the mayor's office noticed that there were much more complaints from the rich regions than from the poor. An analysis of the situation showed that wealthy residents had phones with a permanent connection to the Internet, drove more often and were active users of various applications, including Street Bump.
As a result, the main object of the study was an event in the application, but the statistically significant unit of interest was supposed to be a person using a mobile device. Given the demographics of smartphone users (at the time, they were mostly white Americans with middle and high income), it became clear how unreliable the data turned out to be.
The problem of unintentional bias has been wandering from one study to another for decades: there will always be people more actively using social networks, apps or hashtags than others. The data itself is not enough - the quality is of paramount importance. In the same way that questionnaires influence survey results, electronic platforms used to collect data distort research results by influencing people's behavior when working with these platforms.
According to the authors of the study “Review of Selectivity Processing Methods in Big Data Sources,” there are many big data sources that are not intended for accurate statistical analysis - Internet surveys, page views on Twitter and Wikipedia, Google Trends, analysis of hashtag frequency, etc.
One of the most glaring mistakes of this kind is predicting Hillary Clinton's victory in the 2016 US presidential election. According to a Reuters / Ipsos poll released hours before the start of the vote, Clinton was 90% likely to win. The researchers suggest that methodologically, the survey itself could have been conducted flawlessly, but the base, consisting of 15 thousand people in 50 states, behaved irrationally - most likely, many simply did not admit that they wanted to vote for Trump.
Correlation errors
Incomprehensible correlations and confusing causal relationships often baffle the novice data scientist. The result is models that are flawless in terms of mathematics and completely unviable in reality.

The chart above shows the total number of UFO sightings since 1963. The number of reported cases from the National UFO Reporting Center database has remained roughly the same for many years, but in 1993 there was a sharp jump.
Thus, we can make a completely logical conclusion that 27 years ago, aliens took up the study of earthlings in earnest. The real reason was that the first episode of The X-Files was released in September 1993 (at its peak it was watched by more than 25 million people in the United States).

Now take a look at the data that shows the frequency of UFO sightings depending on the time of day and day of the week: the highest frequency of sightings is colored yellow-orange. Obviously, aliens land on Earth more often on weekends because they go to work the rest of the time. So, researching people is a hobby for them?
These hilarious correlations have far-reaching implications. For example, a study on Access to Print in Low-Income Communities found that students with access to more books get better grades. Guided by the data of scientific work, the authorities of Philadelphia (USA) began to reorganize the education system.
The five-year project involved the conversion of 32 libraries to provide an equal opportunity for all children and families in Philadelphia. At first glance, the plan looked great, but unfortunately the study did not take into account whether the children actually read the books - it only looked at the question of whether the books are available or not.
As a result, no significant results were achieved. Children who had not read books before the study did not suddenly fall in love with reading. The city lost millions of dollars, the grades of schoolchildren from disadvantaged areas did not improve, and children raised on a love of books continued to learn as they did.
Data loss

( c )
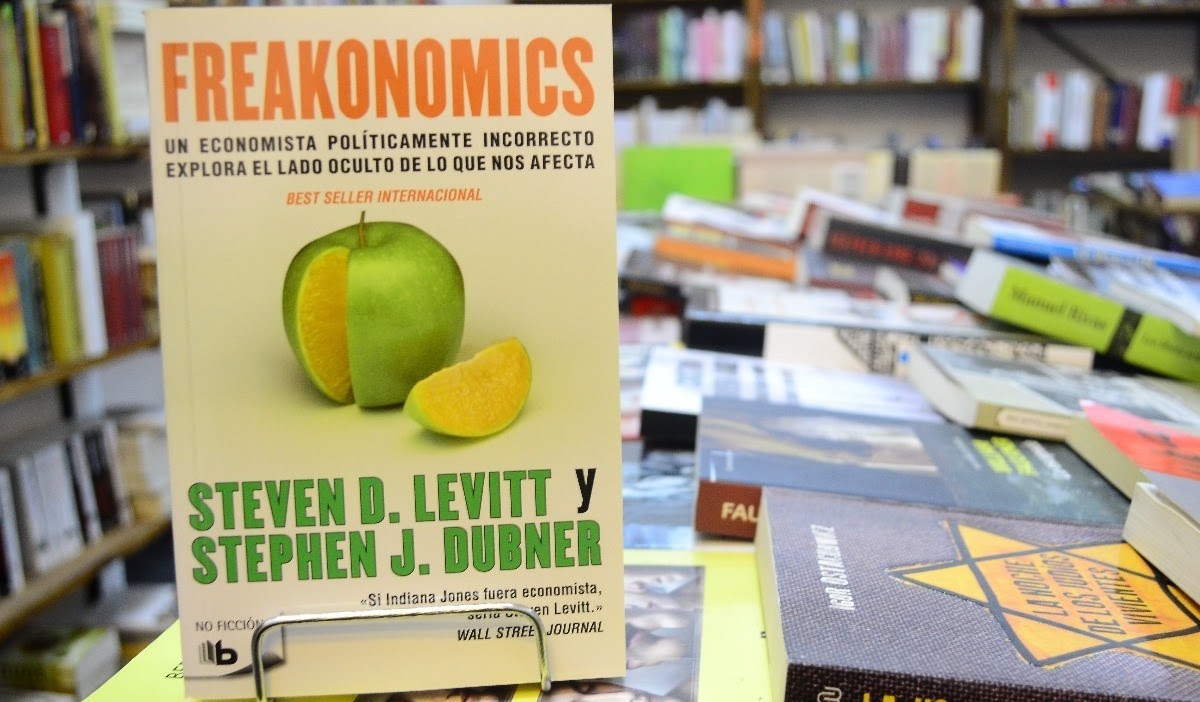
Sometimes the sample may be correct, but the authors simply lose the data they need to analyze. This happened in a work widely distributed around the world under the name "Freakonomics". The book, the total circulation of which exceeded 4 million copies, explored the phenomenon of the emergence of non-obvious cause-and-effect relationships. For example, among the high-profile ideas of the book, there is the idea that the reason for the decline in teenage crime in the United States was not the growth of the economy and culture, but the legalization of abortion.
The authors of "Freakonomics", professor of economics at the University of Chicago Stephen Levitt and journalist Stephen Dubner, admitted a few years laterthat not all of the collected figures were included in the final abortion survey, as the data simply disappeared. Levitt explained the methodological miscalculation by the fact that at that moment "they were very tired", and referred to the statistical insignificance of these data for the overall conclusion of the study.
Whether abortion actually reduces future crime or not is still debatable. However, the authors have noticed many other mistakes, and some of them are surprisingly similar to the situation with the popularity of ufology in the 1990s.
Analysis errors

( c )
Biotech has become a new rock and roll for tech entrepreneurs. It is also called the "new IT market" and even the "new crypto world", referring to the explosive popularity among investors of companies involved in the processing of biomedical information.
Whether biomarker and cell culture data are "new oil" or not is a secondary issue. The consequences of pumping fast money into the industry are of interest. After all, biotech can pose a threat not only to VC wallets, but also directly affect human health.
For example, as points outgeneticist Stephen Lipkin, the genome has the ability to do high-quality analyzes, but quality control information is often off-limits to doctors and patients. Sometimes, before ordering a test, you may not know in advance how deep your sequencing coverage is. When a gene is not read enough times to provide adequate coverage, the software finds the mutation where there is none. Often, we do not know which algorithm is used to classify the alleles of genes into beneficial and harmful.
The largethe number of scientific papers in the field of genetics that contain errors. A team of Australian researchers analyzed about 3.6 thousand genetic papers published in a number of leading scientific journals. As a result, it was found that about one in five works included error genes in their lists.
The source of these errors is striking: instead of using special languages for statistical processing of data, scientists summarized all the data in an Excel table. Excel automatically converted gene names to calendar dates or random numbers. And it is simply impossible to manually recheck thousands and thousands of lines.
In the scientific literature, genes are often denoted by symbols: for example, the Septin-2 gene is shortened to SEPT2, and the Membrane Associated Ring Finger (C3HC4) 1 - to MARCH1. Excel, relying on the default settings, replaced these lines with dates. The researchers noted that they did not become the pioneers of the problem - it was pointed out more than a decade ago.
In another case, Excel dealt a major blow to economics. The famous economists of Harvard University Carmen Reinhart and Kenneth Rogoff analyzed 3,700 different cases of an increase in public debt and its impact on economic growth in 42 countries over 200 years in their research work.
The work "Growth over the Time of Debt" unequivocally indicated that when the level of public debt is below 90% of GDP, it practically does not affect economic growth. If the national debt exceeds 90% of GDP, the median growth rate falls by 1%.
The study has had a huge impact on how the world has grappled with the latest economic crisis. The work has been widely cited to justify budget cuts in the US and Europe.
However, a few years later, Thomas Herndorn, Michael Ash and Robert Pollin of the University of Massachusetts, after analyzing the work of Rogoff and Reinhart point by point , revealed commonplace inaccuracies when working with Excel. Statistics, in fact, do not show any relationship between GDP growth and public debt.
Conclusion: bug fixes as a source of bugs

( c )
Given the vast amount of information to analyze, some erroneous associations arise simply because this is the nature of things. If errors are rare and close to random, the conclusions of the final analysis may not suffer. In some cases, it is pointless to deal with them, since the struggle with errors in data collection can lead to new errors.
The famous statistician Edward Deming formulated the description of this paradox as follows: setting up a stable process to compensate for the small available deviations in order to achieve the best results can lead to worse results than if there was no interference in the process.
To illustrate the problems with over-correcting data, we use the simulation of corrections in the process of accidentally dropping balls through a funnel. The process can be adjusted using several rules, the main purpose of which is to provide an opportunity to get as close to the center of the funnel as possible. However, the more you follow the rules, the more frustrating the results will be.
The easiest way to experiment with a funnel is online, for which a simulator was created . Write in the comments what results you have achieved.
We can teach you how to properly analyze big data at the MADE Academy , a free educational project from Mail.ru Group. We accept applications for training until August 1 inclusive.