Let's remember the plan by which we are moving:
1 part . We decided on the technical task and the architecture of the solution, wrote an application in golang.
Part 2 (you are here now). We release our application to production, make it scalable and test the load.
Part 3. Let's try to figure out why we need to store messages in a buffer, and not in files, and also compare kafka, rabbitmq and yandex queue service among themselves.
Part 4. We will deploy the Clickhouse cluster, write streaming to transfer data from the buffer there, set up visualization in datalens.
Part 5.Let's put the entire infrastructure in proper shape - configure ci / cd using gitlab ci, connect monitoring and service discovery using consul and prometheus.

Well, let's move on to our tasks.
We pour into production
In part 1, we assembled the application, tested it, and also uploaded the image to the private container registry, ready for deployment.
In general, the next steps should be almost obvious - we create virtual machines, set up a load balancer and register a DNS name with proxying to cloudflare. But I am afraid that this option does not closely match our terms of reference. We want to be able to scale our service in the event of an increase in load and throw out broken nodes from it that cannot serve requests.
For scaling, we will use the instance groups available in the compute cloud. They allow you to create virtual machines from a template, monitor their availability using health checks, and also automatically increase the number of nodes in case of an increase in load.More details here .
There is only one question - which template to use for the virtual machine? Of course, you can install linux, configure it, make an image and upload it to the image storage in Yandex.Cloud. But for us it is a long and difficult journey. While reviewing the various images available when creating a virtual machine, we came across an interesting instance - container optimized image ( https://cloud.yandex.ru/docs/cos/concepts/ ). It allows you to run a single docker container in network mode host. That is, when creating a virtual machine, approximately the following specification for the container optimized image is indicated:
spec:
  containers:
    - name: api
      image: vozerov/events-api:v1
      command:
        - /app/app
      args:
        - -kafka=kafka.ru-central1.internal:9092
      securityContext:
        privileged: false
      tty: false
      stdin: false
      restartPolicy: Always
And after the start of the virtual machine, this container will be downloaded and launched locally.
The scheme is quite interesting:
- We create an instance group with automatic scaling when exceeding 60% cpu usage.
- As a template, we specify a virtual machine with a container optimized image and parameters for running our Docker container.
- We create a load balancer, which will look at our instance group and automatically update when adding or removing virtual machines.
- The application will be monitored both as an instance group and by the balancer itself, which will throw inaccessible virtual machines out of balancing.
Sounds like a plan!
Let's try to create an instance group using terraform. The entire description lies in instance-group.tf, I will comment on the main points:
- service account id will be used to create and delete virtual machines. By the way, we will have to create it.
service_account_id = yandex_iam_service_account.instances.id - spec.yml, , . registry , - — docker hub. , —
metadata = { docker-container-declaration = file("spec.yml") ssh-keys = "ubuntu:${file("~/.ssh/id_rsa.pub")}" } - service account id, container optimized image, container registry . registry , :
service_account_id = yandex_iam_service_account.docker.id - Scale policy. :
autoscale {
  initialsize = 3
  measurementduration = 60
  cpuutilizationtarget = 60
  minzonesize = 1
  maxsize = 6
  warmupduration = 60
  stabilizationduration = 180
}
. — fixed_scale , auth_scale.
:
initial size — ;
measurement_duration — ;
cpu_utilization_target — , ;
min_zone_size — — , ;
max_size — ;
warmup_duration — , , ;
stabilization_duration — — , .
. 3 (initial_size), (min_zone_size). cpu (measurement_duration). 60% (cpu_utilization_target), , (max_size). 60 (warmup_duration), cpu. 120 (stabilization_duration), 60% (cpu_utilization_target).
— https://cloud.yandex.ru/docs/compute/concepts/instance-groups/policies#auto-scale-policy - Allocation policy. , , — .
allocationpolicy { zones = ["ru-central1-a", "ru-central1-b", "ru-central1-c"] } - :
deploy_policy {
  maxunavailable = 1
  maxcreating = 1
  maxexpansion = 1
  maxdeleting = 1
}
max_creating — ;
max_deleting — ;
max_expansion — ;
max_unavailable — RUNNING, ;
— https://cloud.yandex.ru/docs/compute/concepts/instance-groups/policies#deploy-policy - :
 load_balancer {
  target_group_name = "events-api-tg"
}
When creating an instance group, you can also create a target group for the load balancer. It will target the associated virtual machines. If deleted, nodes will be removed from balancing, and upon creation, they will be added to balancing after passing state checks.
It seems that everything is basic - let's create a service account for the instance group and, in fact, the group itself.
vozerov@mba:~/events/terraform (master *) $ terraform apply -target yandex_iam_service_account.instances -target yandex_resourcemanager_folder_iam_binding.editor

... skipped ...

Apply complete! Resources: 2 added, 0 changed, 0 destroyed.

vozerov@mba:~/events/terraform (master *) $ terraform apply -target yandex_compute_instance_group.events_api_ig

... skipped ...

Apply complete! Resources: 1 added, 0 changed, 0 destroyed.
The group has been created - you can view and check:
vozerov@mba:~/events/terraform (master *) $ yc compute instance-group list
+----------------------+---------------+------+
|          ID          |     NAME      | SIZE |
+----------------------+---------------+------+
| cl1s2tu8siei464pv1pn | events-api-ig |    3 |
+----------------------+---------------+------+

vozerov@mba:~/events/terraform (master *) $ yc compute instance list
+----------------------+---------------------------+---------------+---------+----------------+-------------+
|          ID          |           NAME            |    ZONE ID    | STATUS  |  EXTERNAL IP   | INTERNAL IP |
+----------------------+---------------------------+---------------+---------+----------------+-------------+
| ef3huodj8g4gc6afl0jg | cl1s2tu8siei464pv1pn-ocih | ru-central1-c | RUNNING | 130.193.44.106 | 172.16.3.3  |
| epdli4s24on2ceel46sr | cl1s2tu8siei464pv1pn-ipym | ru-central1-b | RUNNING | 84.201.164.196 | 172.16.2.31 |
| fhmf37k03oobgu9jmd7p | kafka                     | ru-central1-a | RUNNING | 84.201.173.41  | 172.16.1.31 |
| fhmh4la5dj0m82ihoskd | cl1s2tu8siei464pv1pn-ahuj | ru-central1-a | RUNNING | 130.193.37.94  | 172.16.1.37 |
| fhmr401mknb8omfnlrc0 | monitoring                | ru-central1-a | RUNNING | 84.201.159.71  | 172.16.1.14 |
| fhmt9pl1i8sf7ga6flgp | build                     | ru-central1-a | RUNNING | 84.201.132.3   | 172.16.1.26 |
+----------------------+---------------------------+---------------+---------+----------------+-------------+

vozerov@mba:~/events/terraform (master *) $
Three nodes with crooked names are our group. We check that applications are available for them:
vozerov@mba:~/events/terraform (master *) $ curl -D - -s http://130.193.44.106:8080/status
HTTP/1.1 200 OK
Date: Mon, 13 Apr 2020 16:32:04 GMT
Content-Length: 3
Content-Type: text/plain; charset=utf-8

ok
vozerov@mba:~/events/terraform (master *) $ curl -D - -s http://84.201.164.196:8080/status
HTTP/1.1 200 OK
Date: Mon, 13 Apr 2020 16:32:09 GMT
Content-Length: 3
Content-Type: text/plain; charset=utf-8

ok
vozerov@mba:~/events/terraform (master *) $ curl -D - -s http://130.193.37.94:8080/status
HTTP/1.1 200 OK
Date: Mon, 13 Apr 2020 16:32:15 GMT
Content-Length: 3
Content-Type: text/plain; charset=utf-8

ok
vozerov@mba:~/events/terraform (master *) $
By the way, you can go to virtual machines with the ubuntu login and see the container logs and how it is started.
A target group has also been created for the balancer to which requests can be sent:
vozerov@mba:~/events/terraform (master *) $ yc load-balancer target-group list
+----------------------+---------------+---------------------+-------------+--------------+
|          ID          |     NAME      |       CREATED       |  REGION ID  | TARGET COUNT |
+----------------------+---------------+---------------------+-------------+--------------+
| b7rhh6d4assoqrvqfr9g | events-api-tg | 2020-04-13 16:23:53 | ru-central1 |            3 |
+----------------------+---------------+---------------------+-------------+--------------+

vozerov@mba:~/events/terraform (master *) $
Let's already create a balancer and try to send traffic to it! This process is described in load-balancer.tf, key points:
- We indicate which external port the balancer will listen to and which port to send a request to virtual machines. We indicate the type of external address - ip v4. At the moment, the load balancer operates at the transport level, so it can only balance tcp / udp connections. So you will have to screw ssl either on your virtual machines, or on an external service that can handle https, for example, cloudflare.
 listener {
	  name = "events-api-listener"
	  port = 80
	  target_port = 8080
	  external_address_spec {
	    ipversion = "ipv4"
	  }
	}
healthcheck { name = "http" http_options { port = 8080 path = "/status" } }
Healthchecks. Here we specify the parameters for checking our nodes - we check by http url / status on port 8080. If the check fails, the machine will be thrown out of balancing.
More information about the load balancer - cloud.yandex.ru/docs/load-balancer/concepts . Interestingly, you can connect the DDOS protection service on the balancer. Then already cleaned traffic will come to your servers.
We create:
vozerov@mba:~/events/terraform (master *) $ terraform apply -target yandex_lb_network_load_balancer.events_api_lb

... skipped ...

Apply complete! Resources: 1 added, 0 changed, 0 destroyed.
We take out the ip of the created balancer and test the work:
vozerov@mba:~/events/terraform (master *) $ yc load-balancer network-load-balancer get events-api-lb
id:
folder_id:
created_at: "2020-04-13T16:34:28Z"
name: events-api-lb
region_id: ru-central1
status: ACTIVE
type: EXTERNAL
listeners:
- name: events-api-listener
  address: 130.193.37.103
  port: "80"
  protocol: TCP
  target_port: "8080"
attached_target_groups:
- target_group_id:
  health_checks:
  - name: http
    interval: 2s
    timeout: 1s
    unhealthy_threshold: "2"
    healthy_threshold: "2"
    http_options:
      port: "8080"
      path: /status
Now we can leave messages in it:
vozerov@mba:~/events/terraform (master *) $ curl -D - -s -X POST -d '{"key1":"data1"}' http://130.193.37.103/post
HTTP/1.1 200 OK
Content-Type: application/json
Date: Mon, 13 Apr 2020 16:42:57 GMT
Content-Length: 41

{"status":"ok","partition":0,"Offset":1}
vozerov@mba:~/events/terraform (master *) $ curl -D - -s -X POST -d '{"key1":"data1"}' http://130.193.37.103/post
HTTP/1.1 200 OK
Content-Type: application/json
Date: Mon, 13 Apr 2020 16:42:58 GMT
Content-Length: 41

{"status":"ok","partition":0,"Offset":2}
vozerov@mba:~/events/terraform (master *) $ curl -D - -s -X POST -d '{"key1":"data1"}' http://130.193.37.103/post
HTTP/1.1 200 OK
Content-Type: application/json
Date: Mon, 13 Apr 2020 16:43:00 GMT
Content-Length: 41

{"status":"ok","partition":0,"Offset":3}
vozerov@mba:~/events/terraform (master *) $
Great, everything works. The final touch remains so that we are available via https - we will connect cloudflare with proxying. If you decide to do without cloudflare, you can skip this step.
vozerov@mba:~/events/terraform (master *) $ terraform apply -target cloudflare_record.events

... skipped ...

Apply complete! Resources: 1 added, 0 changed, 0 destroyed.
Testing over HTTPS:
vozerov@mba:~/events/terraform (master *) $ curl -D - -s -X POST -d '{"key1":"data1"}' https://events.kis.im/post
HTTP/2 200
date: Mon, 13 Apr 2020 16:45:01 GMT
content-type: application/json
content-length: 41
set-cookie: __cfduid=d7583eb5f791cd3c1bdd7ce2940c8a7981586796301; expires=Wed, 13-May-20 16:45:01 GMT; path=/; domain=.kis.im; HttpOnly; SameSite=Lax
cf-cache-status: DYNAMIC
expect-ct: max-age=604800, report-uri="https://report-uri.cloudflare.com/cdn-cgi/beacon/expect-ct"
server: cloudflare
cf-ray: 5836a7b1bb037b2b-DME

{"status":"ok","partition":0,"Offset":5}
vozerov@mba:~/events/terraform (master *) $
Everything is finally working.
Testing the load
We are left with perhaps the most interesting step - to carry out load testing of our service and get some numbers - for example, the 95th percentile of the processing time of one request. It would also be nice to test the autoscaling of our nodegroup.
Before starting testing, it is worth doing one simple thing - add our application nodes to prometheus to keep track of the number of requests and the processing time of one request. Since we have not added any service discovery yet (we will do this in article 5 of this series), we will simply write static_configs on our monitoring server. You can find out its ip in the standard way through yc compute instance list, and then add the following settings to /etc/prometheus/prometheus.yml:
  - job_name: api
    metrics_path: /metrics
    static_configs:
    - targets:
      - 172.16.3.3:8080
      - 172.16.2.31:8080
      - 172.16.1.37:8080
The IP addresses of our machines can also be taken from the yc compute instance list. Restart prometheus via systemctl restart prometheus and check that the nodes are being polled successfully by going to the web interface available on port 9090 (84.201.159.71:9090).
Let's add a dashboard to the grafana from the grafana folder. We go to Grafana on port 3000 (84.201.159.71:3000) and with a username / password - admin / Password. Next, add a local prometheus and import the dashboard. Actually, at this point, the preparation is completed - you can throw requests at our installation.
For testing, we will use the yandex tank ( https://yandex.ru/dev/tank/ ) with a plugin for overload.yandex.netwhich will allow us to visualize the data received by the tank. Everything you need to work is in the load folder of the original git repository.
A little about what is there:
- token.txt - a file with an API key from overload.yandex.net - you can get it by registering on the service.
- load.yml - a configuration file for the tank, there is a domain for testing - events.kis.im, rps load type and the number of requests 15,000 per second for 3 minutes.
- data - a special file for generating a config in the ammo.txt format. In it we write the type of request, url, group for displaying statistics and the actual data that needs to be sent.
- makeammo.py - script for generating ammo.txt file from data file. More about the script - yandextank.readthedocs.io/en/latest/ammo_generators.html
- ammo.txt - the resulting ammo file that will be used to send requests.
For testing, I took a virtual machine outside Yandex.Cloud (so that everything was fair) and created a DNS record for it load.kis.im. I rolled docker there, since we will start the tank using the image https://hub.docker.com/r/direvius/yandex-tank/ .
Well, let's get started. Copy our folder to the server, add a token and start the tank:
vozerov@mba:~/events (master *) $ rsync -av load/ cloud-user@load.kis.im:load/

... skipped ...

sent 2195 bytes  received 136 bytes  1554.00 bytes/sec
total size is 1810  speedup is 0.78

vozerov@mba:~/events (master *) $ ssh load.kis.im -l cloud-user
cloud-user@load:~$ cd load/
cloud-user@load:~/load$ echo "TOKEN" > token.txt
cloud-user@load:~/load$ sudo docker run -v $(pwd):/var/loadtest --net host --rm -it direvius/yandex-tank -c load.yaml ammo.txt
No handlers could be found for logger "netort.resource"
17:25:25 [INFO] New test id 2020-04-13_17-25-25.355490
17:25:25 [INFO] Logging handler <logging.StreamHandler object at 0x7f209a266850> added
17:25:25 [INFO] Logging handler <logging.StreamHandler object at 0x7f209a20aa50> added
17:25:25 [INFO] Created a folder for the test. /var/loadtest/logs/2020-04-13_17-25-25.355490
17:25:25 [INFO] Configuring plugins...
17:25:25 [INFO] Loading plugins...
17:25:25 [INFO] Testing connection to resolved address 104.27.164.45 and port 80
17:25:25 [INFO] Resolved events.kis.im into 104.27.164.45:80
17:25:25 [INFO] Configuring StepperWrapper...
17:25:25 [INFO] Making stpd-file: /var/loadtest/ammo.stpd
17:25:25 [INFO] Default ammo type ('phantom') used, use 'phantom.ammo_type' option to override it

... skipped ...
That's it, the process is running. In the console, it looks something like this:

And we are waiting for the completion of the process and watching the response time, the number of requests and, of course, the automatic scaling of our group of virtual machines. You can monitor a group of virtual machines via the web interface; in the settings of a group of virtual machines there is a "Monitoring" tab.
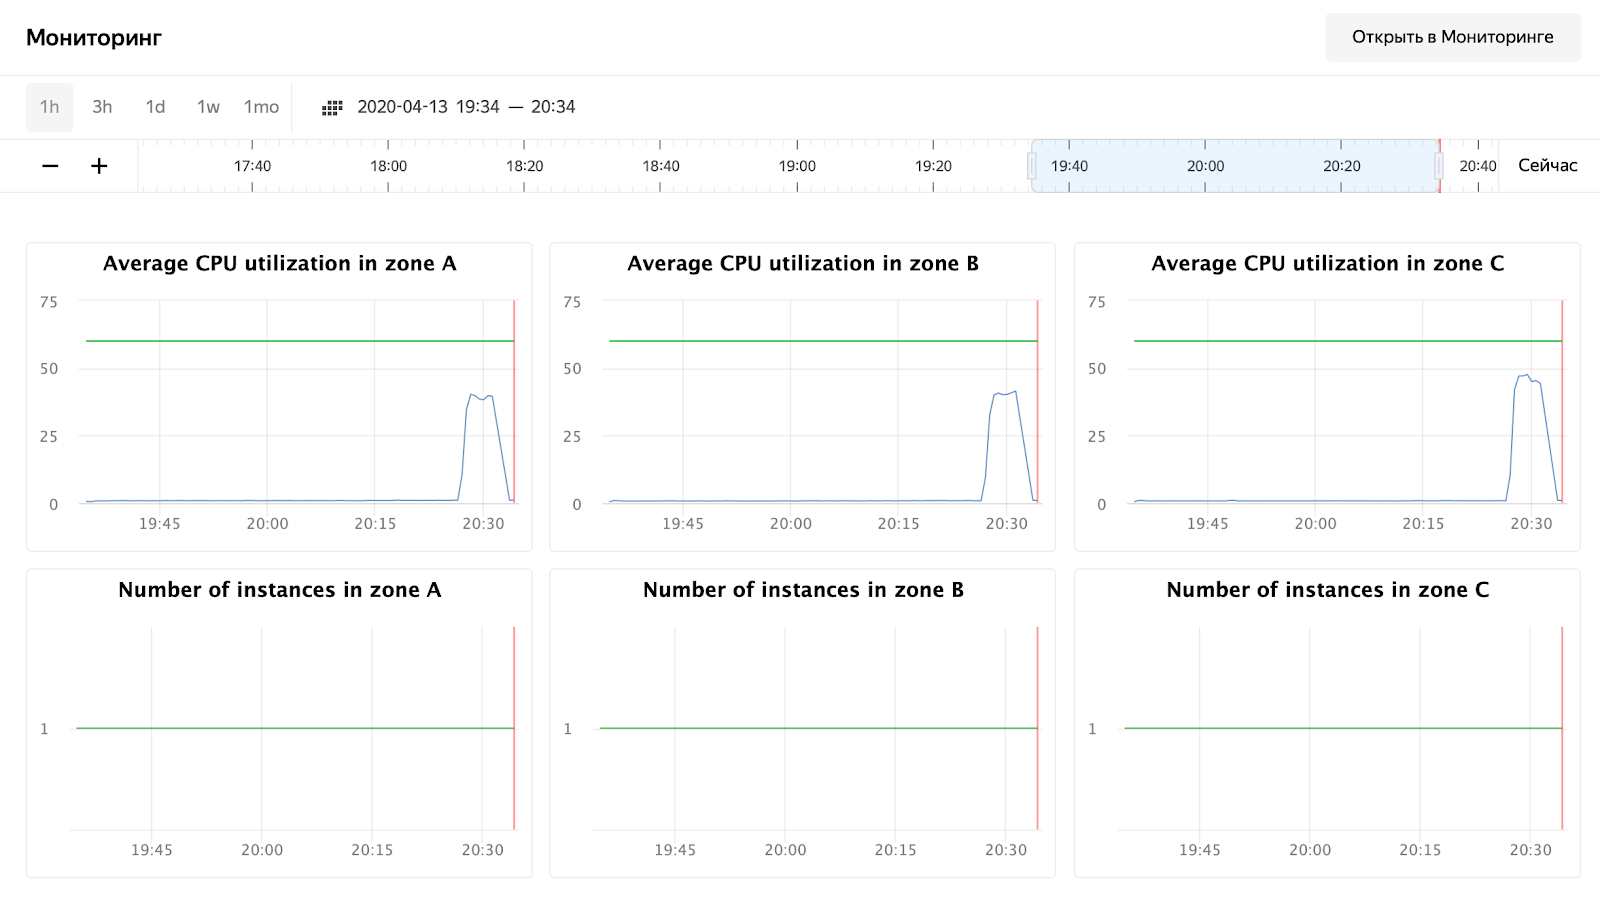
As you can see, our nodes didn't load even up to 50% of the CPU, so the autoscaling test will have to be repeated. For now, let's take a look at the processing time of the request in Grafana:
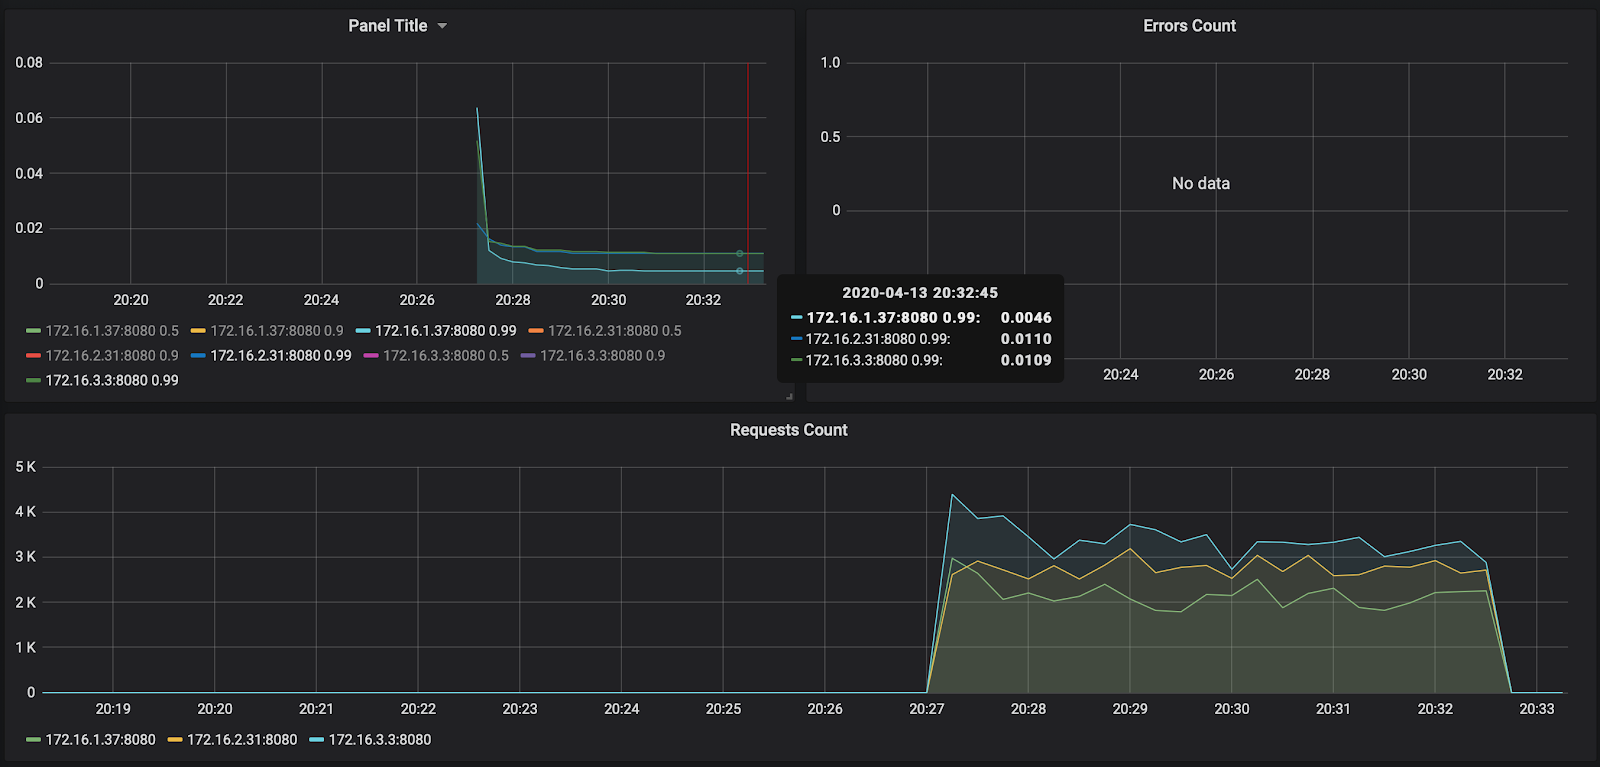
The number of requests - about 3000 per node - was not loaded a little to 10,000. The response time pleases - about 11 ms per request. The only one who stands out - 172.16.1.37 - has half the time to process a request. But this is also logical - it is in the same ru-central1-a availability zone as kafka, which stores messages.
By the way, the report on the first launch is available at the link: https://overload.yandex.net/265967 .
So let's run a more fun test - add instances: 2000 to get 15,000 requests per second and increase the test time to 10 minutes. The resulting file will look like this:
overload:
  enabled: true
  package: yandextank.plugins.DataUploader
  token_file: "token.txt"
phantom:
  address: 130.193.37.103
  load_profile:
    load_type: rps
    schedule: const(15000, 10m)
  instances: 2000
console:
  enabled: true
telegraf:
  enabled: false
The attentive reader will notice that I changed the address to the IP of the balancer - this is due to the fact that cloudflare began to block me for a huge number of requests from one ip. I had to set the tank directly on the Yandex.Cloud balancer. After launch, you can observe the following picture:
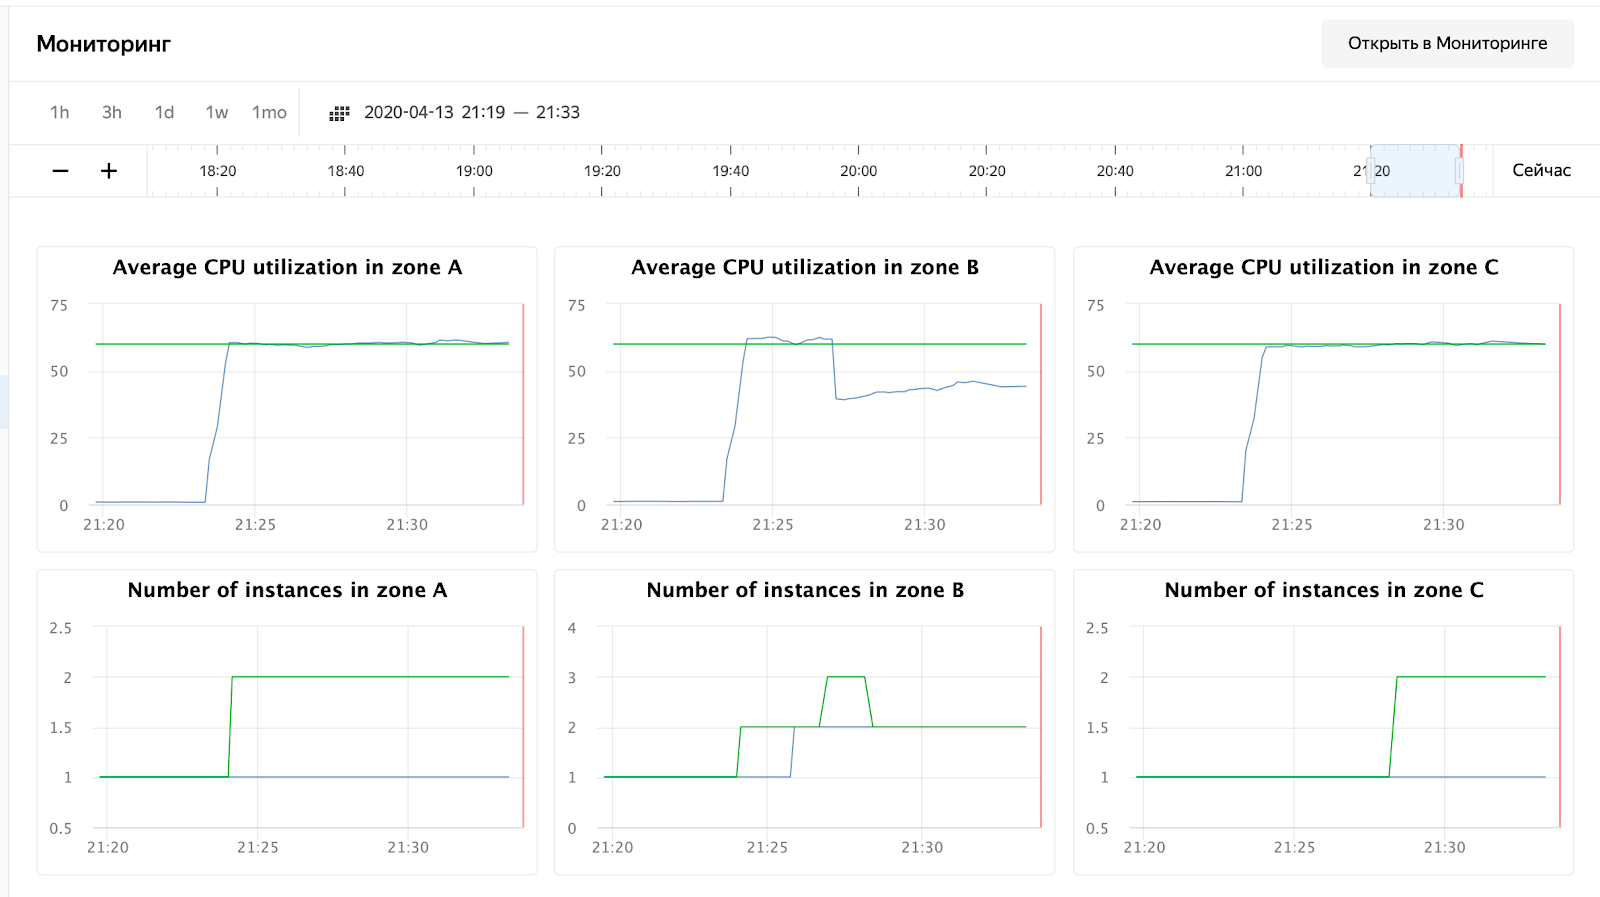
CPU usage has grown, and the scheduler decided to increase the number of nodes in zone B, which he did. This can be seen in the instance group logs:
vozerov@mba:~/events/load (master *) $ yc compute instance-group list-logs events-api-ig
2020-04-13 18:26:47    cl1s2tu8siei464pv1pn-ejok.ru-central1.internal  1m AWAITING_WARMUP_DURATION -> RUNNING_ACTUAL
2020-04-13 18:25:47    cl1s2tu8siei464pv1pn-ejok.ru-central1.internal 37s OPENING_TRAFFIC -> AWAITING_WARMUP_DURATION
2020-04-13 18:25:09    cl1s2tu8siei464pv1pn-ejok.ru-central1.internal 43s CREATING_INSTANCE -> OPENING_TRAFFIC
2020-04-13 18:24:26    cl1s2tu8siei464pv1pn-ejok.ru-central1.internal  6s DELETED  -> CREATING_INSTANCE
2020-04-13 18:24:19    cl1s2tu8siei464pv1pn-ozix.ru-central1.internal  0s PREPARING_RESOURCES -> DELETED
2020-04-13 18:24:19    cl1s2tu8siei464pv1pn-ejok.ru-central1.internal  0s PREPARING_RESOURCES -> DELETED
2020-04-13 18:24:15    Target allocation changed in accordance with auto scale policy in zone ru-central1-a: 1 -> 2
2020-04-13 18:24:15    Target allocation changed in accordance with auto scale policy in zone ru-central1-b: 1 -> 2

... skipped ...

2020-04-13 16:23:57    Balancer target group b7rhh6d4assoqrvqfr9g created
2020-04-13 16:23:43    Going to create balancer target group
The scheduler also decided to increase the number of servers in other zones, but I ran out of the limit on external ip-addresses :) By the way, they can be increased through a request to technical support, specifying quotas and desired values.
Conclusion
The article was not easy - both in volume and in the amount of information. But we went through the most difficult stage and did the following:
- Raised monitoring and kafka.
- , .
- load balancer’ cloudflare ssl .
Next time, let's compare and test rabbitmq / kafka / yandex queue service.
Stay tuned!
* This material is in the video recording of the open workshop REBRAIN & Yandex.Cloud: We accept 10,000 requests per second on Yandex Cloud - https://youtu.be/cZLezUm0ekE
If you are interested in visiting such events online and asking questions in real time, connect to channel DevOps by REBRAIN .
We would like to say special thanks to Yandex.Cloud for the opportunity to hold such an event. Link to them
If you need a move to the cloud or have questions about your infrastructure, feel free to leave a request .
PS We have 2 free audits per month, perhaps your project will be among them.