The topic of updating Moore's law by finding more complex dependencies of the evolution of computing systems brought up for discussion is today well understood by researchers in the field of plasmonics and nanophotonics technologies.
Important: most of the links in the article lead to materials in English. There are not so many domestic researchers of photonics in Russia, and those that exist prefer to be published in English.
For additional study of the topic at your leisure over a cup of tea, you are invited to listen to the report of Dmitry Fedyanin - one of the leading Russian researchers on the application of nanophotonics technologies in computing systems.
Dmitry Fedyanin is a senior researcher at MIPT.
And then we will analyze an interesting article in which a group of authors proposes an extremely original concept of the productivity growth metric, an alternative to the classical Moore's law. The idea has matured thanks to the analysis of natural physical limitations in the existing technologies for operating processor cores, as well as the experimentally confirmed prospects for new systems based on nanophotonics.
The continuous demands made by the modern industrial system to improve computational efficiency and communication bandwidth have brought semiconductor technologies to their limits in their current state. This has led to the emergence of new technologies that can surpass traditional solutions. We are talking about photonic preprocessors or accelerators, electron-photon hybrid circuits and neural networks. However, the efforts made to describe and predict the evolution of the performance of computing systems do not allow one to accurately predict and thereby explain the actually observed rate of development; that is, all proposed indicators end up deviating from their development trajectory several years after they were originally proposed. This discrepancy requires a balanced metric,which would include a holistic set of driving forces behind the evolution of computing systems.
The original concept of a new metric called Capability to Latency-Amount-Resistance (CLEAR) was proposed by an international team of researchers (Shuai Sun, Vikram K. Narayana, Mario Miscuglio, Lionel C. Kimerling, Tarek El-Ghazawi, Volker J. Sorger). According to the authors of the article (see here) this metric covers the dynamics of changes in synchronization rates, energy efficiency, scaling of the physical size of computers and economic costs. According to the authors, CLEAR is the only metric today that correctly describes the historical development of computing systems. Even with different options and mutual technological combinations, CLEAR is consistent with the observed constant growth rate, including the dominant computing technologies proposed for implementation in the future (forecast). CLEAR is presented to readers as a guide to quantitatively predicting the growth in the productivity of computing systems now and in the future.
Despite the fact that in general the evolution of computing performance is constantly increasing, the observed speed of performance of devices based on the existing semiconductor industry is slowing down noticeably, especially on 14nm technology (see here and here ). This is due to both natural physical constraints and the growing economic costs of the continuous industrial chip production process.
For these reasons, Moore's Law as a roadmap for the semiconductor industry has been revised several times to remove these obstacles (see here). Similarly, the dynamics of development (dependence on time) of other relationships of physical quantities, such as the indicator of the efficiency of using computing power ( Kumi's law ) or the indicator of computing power derived from the ratio of energy consumption, size and cost ( Makimoto's law ), as a result, all the same deviates compared to the observed rate of technology development (Fig. 1) - the function of time chosen in the indicator (for example, multicore, manufacturing cost) in practice cannot provide exponential growth.
For example, the performance of a processor with N cores is still limited by the ratio 1 / ((1-p) + p / N) , where p is the parallelization level (see.here ). Therefore, it becomes more and more difficult to track the evolution of the performance of computing systems if we use only Moore's law (or other existing prediction metrics), in which only one or several driving factors are used to describe the performance of a computing system (see here ). In addition, the benefits of different hardware implementations (eg, electrical, optical) change in different ways over time, making evolutionary prediction even more difficult.
For example, integrated photonics and possibly plasmonics can expand certain communication channels on a board or even on a chip. As a result, thermal power dissipation issues will be significantly mitigated, as well as increased data bandwidth with the ability to overcome the electronic digital efficiency barrier using conceptual approaches such as wavelength division multiplexing ( WDM ), optical angular momentum, or higher modulation formats such as polarization amplitude modulation. modulation (for example, QAM ), where phase and amplitude polarization are used simultaneously (see here and here ).
With regard to tradeoffs with other technologies, one electronic transistor with a 14 nm process node occupies an area 3 orders of magnitude less than a ring modulator of a photonic microdisk, however, photonics provides interconnection at the channel level without capacitive charge / discharge wires, although it is synergistic with respect to the above unique characteristics that support data transfer rates up to Tbps (see here ). Figure 1. The nature of the development of computing systems, from 1946 to the present day, can be represented in the form of four different indicators: (a) Moore's law - based on the growth in the number of components on a chip, measured in units of the numerical number of transistors; (b)
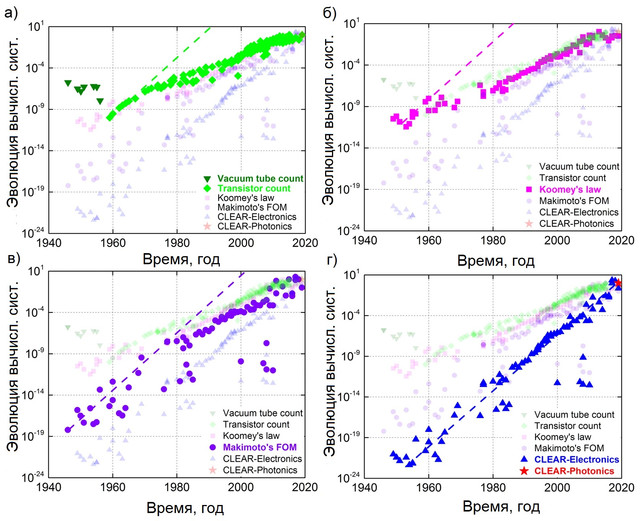
Kumi's law - reflects energy efficiency per unit of computation, bit / (s * Joule); (c) Makimoto index, which includes "intelligence", power, size and cost of the system - measured in units of MIPS / (W * mm3 * $); and (d) the CLEAR score defined in equation (4), which takes into account the system latency in addition to the Makimoto score and the economic costs associated with introducing the new technology: MIPS / (s * W * mm3 * $). Photonic CLEAR data is based on Intel's prediction of silicon photonics. Dashed lines represent linear fit (logarithmic) based on initial growth rate, with annual productivity doubling.
According to the authors, the 5-factor indicator CLEAR (the name of which represents the abbreviation Capability-to-Latency-Energy-Amount-Resistance) is by far the most reliable for describing the evolution of computing performance throughout the known historical period, starting from the very beginning of the emergence of computing technologies in the 1940s. and up to the present time. This indicator covers both physical and economic factors associated with the pace of development of various options for computing. Thus, CLEAR can be used as a technology independent quantitative indicator, since it includes both fundamental physical and economic dependencies.
Based on observations and analysis, the authors draw two key conclusions:
- , ;
- ( ) , (.. CLEAR) ( ) .
The advancement of fundamental physics, the management of semiconductor technology, and economic costs require constant change and adaptation in order to progressively advance the technology of computing systems. Since the founding of the semiconductor industry, Moore's Law has changed the underlying factors several times: from counting transistors, the industry is unfolding (First Move) to footprint and transistor scaling due to die size constraints and increased overall system complexity (see here ).
The second jump occurred when the clock frequency found its limits due to the power density dissipation constraints described by Dennard's scaling law (see here). As the scaling of transistors approaches fundamental physical limits, the number of transistors continues to increase at this time due to the parallelism implemented in multicore and massively parallel heterogeneous architectures. This increases the bottleneck in the interconnect, resulting in the need to disable certain areas of the chip ( "dark silicon" ). Thus, the rate of growth has changed from an initial doubling every 12 months to about 24 months now.
Recently, a new driving force has emerged from a completely different field that influences the evolution of computing systems and is integrated photonics and hybridized nanophotonics, where the routing of the light signal is performed by passive integrated photonic components, while the electro-optic active components are amplified by new solutions:
- reconfigurable materials;
- strong interactions of light with matter, such as plasmonics or photonics ENZ (epsilion-near-zero), together providing a data transmission channel and bandwidth surpassing conventional electronics on two levels: the chip and the core (see here ).
For these new technologies, simply counting the number of components on a chip or scaling footprint and cost as a separate metric is not possible because it does not more accurately reflect the actual performance change. Also of great importance is the trend towards the emergence of other technologies, such as those used in optical communications, in which multiple signals with different wavelengths are packed into the same physical channel and thus improve the utilization of hardware. This is a significant factor in evaluating system performance. Consequently, a holistic metric is required that takes into account multiple driving forces in order to provide an accurate comparison of the contribution of different technological solutions to the evolution of computing systems.
A single indicator of the evolution of computing systems
To obtain a technology independent metric, the authors collected data on the performance of desktops, laptops, mobile devices, servers, workstations, and supercomputers since the 1940s and compared them with traditional metrics (Figure 1).
In particular, Moore's law takes the number of transistors as the only sufficient factor (equation 1), while Kumi's law already relies on two factors: energy and the number of calculations, thereby summing up the basis for the indicator, measured in bits / (s * J) (equation 2). Millions of instructions per second (MIPS) per size-cost-power unit are known as the Makimoto metric, already defined as a 4-factor metric (Equation 3).
Moore's Law = Number of Transistors [qty.] (1)
Kumi's Law= Calculations / Energy [bits / (s * J)] (2)
Makimoto Score = Intelligence / (Size * Cost * Power) [MIPS / (mm3 * $ * W)] (3)
The values of these three indicators show a similar growth pattern : An uptrend tracks their original data well, but only for a limited period of time, and eventually deviates from them. This suggests that the underlying factors have failed to fully capture the actual driving force that dominates the evolution of computing systems.
Analysis of trend lines in Fig. 1 shows that the number of transistors originally (1950s – 1960s) reflects Moore's law of twofold annual growth well (dashed light green line, Fig. 1). However, energy efficiency scaling (ie Kumi's Law) became the dominant factor over the next period (1960s – 1970s), as simply adding more transistors was limited by the size and complexity of the chip. For this reason, Moore's Law began to deviate from the 2X / yr trend, while Makimoto's Law still maintained its original growth rate. Since the late 1970s, factors such as size and power scaling have gradually reached their limit due to problems with markedly more complex manufacturing processes, energy leakage and heat dissipation.Along with the emergence of parallelism (i.e. multi-core processors) and economic scaling in the market, the Makimoto metric ultimately also deviates (since 1978). The dotted lines shown in Fig. 1 represent initial projections of productivity growth for each law. These trend lines show how each additional factor introduced by the corresponding laws affects its own original forecast metric, shown as a deviation from the original forecast. By viewing this trend as a theoretical upper limit on the speed of technology development, it is now possible to understand whether the “claimed” trend is actually “actual” or not. That is, whether the current law is the reason for the slowdown in the development of technologies, or new factors of productivity are beginning to dominate.also deviated (since 1978). The dotted lines shown in Fig. 1 represent initial projections of productivity growth for each law. These trend lines show how each additional factor introduced by the corresponding laws affects its own original forecast metric, shown as a deviation from the original forecast. By viewing this trend as a theoretical upper limit on the speed of technology development, it is now possible to understand whether the “claimed” trend is actually “actual” or not. That is, whether the current law is the reason for the slowdown in technology development, or new factors of productivity begin to dominate.also rejected (since 1978). The dotted lines shown in Fig. 1 represent initial projections of productivity growth for each law. These trend lines show how each additional factor introduced by the corresponding laws affects its own original forecast metric, shown as a deviation from the original forecast. By viewing this trend as a theoretical upper limit on the speed of technology development, it is now possible to understand whether the “claimed” trend is actually “actual” or not. That is, whether the current law is the reason for the slowdown in the development of technologies, or new factors of productivity are beginning to dominate.how each additional factor introduced by the relevant laws affects its own original forecast metric, shown as a deviation from the original forecast. By viewing this trend as a theoretical upper limit on the speed of technology development, it is now possible to understand whether the “claimed” trend is actually “actual” or not. That is, is the current law the reason for the slowdown in technology development, or new factors of productivity are beginning to dominate.how each additional factor introduced by the relevant laws affects its own original forecast metric, shown as a deviation from the original forecast. By viewing this trend as a theoretical upper limit on the speed of technology development, it is now possible to understand whether the “claimed” trend is actually “actual” or not. That is, whether the current law is the reason for the slowdown in technology development, or new factors of productivity begin to dominate.whether the current law is causing the slowdown in technology development, or new factors of productivity are beginning to dominate.whether the current law is the reason for the slowdown in technology development, or new factors of productivity are starting to dominate.
Thus, to date, there is no clear known indicator that can:
- explain recent performance changes;
- provide guidance on predicting future performance.
The CLEAR metric introduced by the authors includes productivity factors from a variety of technology options, which include both physical and economic constraints. The authors' main assertion is that the factors that make up CLEAR are not chosen randomly, but are fundamental to technological and economic trends:
CLEAR = Ability / (Delay * Energy * Quantity * Resistance) [[MIPS / (s * W * mm3 * $)]] (4)
or in original:
CLEAR = (Capability) / (Latency * Energy * Amount * Resistence) [[MIPS / (s * W * mm3 * $)]]
The authors, having formulated a formula for the CLEAR indicator, determine a constant growth rate throughout the evolution of computing systems, covering performance growth by 4 orders of magnitude over seven decades. Moreover, the actual observed rate of development has consistently doubled every 12 months. This 5-factor score is determined based on the concept of performance and cost. CLEAR can be applied at the device, schema and system level.
For example, at the system level, CLEAR is structured as follows:
Capability C is the system performance measured by the product of millions of instructions per second (MIPS) and instruction length;
minimum delay Lrefers to the clock frequency and is limited by the time window between two adjacent clock cycles;
Energy E represents the level of energy consumption for such a system to operate in order to obtain a certain power, expressed in units of watts;
The quantity A represents the spatial volume (that is, the physical size) of the system and is a function of the process dimension;
Resistance R quantifies the economic resistance to market adoption of new technologies. Basically, the authors take an economic model based on the Boston Consulting Group (BCG) experience curve that explains the relationship between total production and unit cost (see here ).
The authors derive a linear relationship between the logarithmic scale of the unit of price and time, and then confirm this relationship by comparing the historical data (see here and here ) with CLEAR.
The authors note that the MIPS metric as a measure of performance is being replaced by metrics such as floating point operations (FLOPS) due to its susceptibility to the underlying instruction set. CLEAR has been applied to various processor architectures throughout history for which other performance metrics are not available in known benchmark suites (such as SPEC or LINPAC). However, to make MIPS a representative performance metric, the authors weighted (i.e. multiplied) each instruction by its length, thereby giving the relative overall metric in terms of bits / s.
Computer systems development trends
After comparing all four indicators shown in Fig. 1, we find that when the indicator includes more relevant factors, its initial point of deviation from the original trend occurs later. Unlike CLEAR, which shows the exact match of data in everything. Thus, we find empirically that computational performance is constantly growing at a fixed rate at about a doubling annually and is independent of technology. When we test new computing machines, such as those based on integrated photonics, as predicted by IBM (see here ), we find that such technologies could indeed continue the evolutionary trend of development with an annual twofold growth (red stars in Fig. 1).
In addition, you will find that the relative deviation from the 2X / year trendline can be used to classify a computing system metric. For example, the additional overhead costs (i.e. physical size, concurrency, cooling, low economies of scale and manufacturing costs) on supercomputers show their worst CLEAR values compared to all other types of computers such as laptops and mobile devices, despite their higher productivity (dotted circles, Fig. 1 c, d). The high parallelism of multicore technologies used in supercomputers has been challenged by the return from computation to the energy described in Amdahl's Law (see here). Although supercomputers provide petaflop performance, the entire infrastructure resembles a computer infrastructure five to thirty years ago, which calls into question the future for its scalability.
CLEAR analysis
To get a more detailed understanding of the relative impact of each of the 5 CLEAR factors, the authors decomposed the indicator into individual factors, opposing one to the other, to reveal the actual driving forces over time.
Combinations of factors used in Fig. 2, represent C versus LEAR, CLE versus AR, and CLEA versus R (Fig. 2, C = ability, L = delay, E = energy, A = quantity, R = resistance). In addition, the exclusion rate C 'is shown compared to all other factors, since the only scaling factor in the early years of the semiconductor industry is the number of components on a chip. It is important to note that the relative positions of each data point are more important than the exact values in both the X and Y axes, and thus both axes are normalized to one, allowing each case to be compared.
Since the blue and red shaded areas represent linear growth and saturation areas, respectively, successive shifts of the pivot point to the right with increasing number of factors considered for the X-axis (i.e., relative time) are easily detected. To understand this, the factors on the X-axis can be viewed as the driving force of the indicator, while the values on the Y-axis indicate the actual tracking conditions of the driving forces in question. Consequently, a linear domain means that factors on the X-axis still dominate the development of the technology, while the driving force of the technology begins to shift to other factors as it enters the saturation domain. This result coincides with the observation made that the evolution of a computing system always grows at this constant rate, and a discrepancy with the indicator occurs only ifwhen other driving forces appear.

Figure 2. CLEAR driving force analysis.
The CLEAR indicator is divided into four groups, each of which consists of two parts: a coefficient that demonstrates factors in the development of technology (X-axis), and a disclosure factor, which shows the ability to track a selected factor or combination of factors (Y-axis). The results show that a later deviation from the normalized development is observed when more factors are taken into account to describe the performance of computing systems. (a) Elusive Speed C 'versus Delay-Energy-Quantity-Cost (LEAR); (b) Ability C versus Delay-Energy-Quantity-Cost (LEAR); (c) Ability to Delay-Energy (CLE) versus Quantity-Cost (AR); (d)Delay-Energy-Amount (CLEA) Ability vs. Cost R. The X and Y axes are normalized to one for better comparison. Linear growth and saturation areas are covered with blue and red shadows, respectively.
CLEAR application
It is important that the ability to seamlessly track the evolution of various technologies allows CLEAR to predict future technological substitutions and determine the standard for future technology, including their hybridization, for example, between electronics and photonics (see here , here , here and here ).
Technology change
In-chip photonic interconnects have recently shown high data transfer capacity (superior to conventional electrical interconnects) when hybridized with active plasmonic devices (see here ). Although optical data routing is perceived as a possible solution for eliminating communication bottlenecks between compute cores and is commonly used in data centers and supercomputers, integrated photonics has yet to be implemented in the mainstream consumer sector. This seems surprising at first, as previous studies have suggested superior characteristics of photon-plasmon hybridization. So the question is, why isn't integrated photonics used in mass market products?
To answer this question, let us compare CLEAR for electronic bonds with hybrid photon-plasmon bonds depending on the evolution time and signal propagation distance (Fig. 3). Here, the manipulation of light is carried out using plasmonic "active" building blocks (source, modulator, detector, switch) (see here and here), while light propagation is processed by low loss photonics based on silicon or silicon nitride platforms. Electronics is compared to this variant of a plasmon-photon hybrid, because the separation of active and passive functionality in a plasmon-photonic hybrid results in higher performance (i.e., lower latency, higher throughput, lower energy-per-bit function). The resulting surface curves show that CLEAR electronics and plasmon-photonics have a break-even line (intersection of surfaces, Fig. 3), which is scaled both in time and in the distance of signal propagation. Interestingly, even today, electronics is still ahead of photonics with a chip size of 1 cm at the length of information transfer.Therefore, electronics are still used commercially on crystals, in contrast to photonics. Investments and developments in electronics over the past half century have thus created technological sustainability (entry barriers) for other technologies. This scaling has resulted in the transistor costing only one billionth of the cost of a photonic device, or less.here ). Figure 3. Comparison of CLEAR indices for electric (blue) and hybrid photon-plasmonic (red) interconnect on a chip, depending on the bond length and technology development time. Chip size = 1 cm, link length and year of writing (2019) are marked in red. The following models have been deployed; a) a bandwidth model based on the number of transistors and optical devices on a chip, which can be considered as the original model of Moore's law; b) an energy efficiency model based on Kumi's law, which is limited by the Landauer limit kB * T * ln (2) ≈ 2.75 sJ / bit, (kB is the Boltzmann constant; T is the temperature); at)

an economic sustainability model based on models of technological development up to 2019, according to which the cost of an electronic channel is less than one billion or one millionth the cost of a hybrid channel; d) a concurrency model (post-2006) describing multicore architecture and the limitations of "dark silicon" in electrical interconnect. The yellow dot is located at the intersection of the two technologies during 2019, when Hybrid Plasmon-Photonics technology has just reached the size of a chip and begins to show the best CLEAR performance on a chip.
As technology and manufacturing processes improve, the productivity-for-one-price break-even distance (ie, CLEAR) for transmitting small amounts of information shrinks due to the flatter curve of the cost of electronics compared to photonics, the latter following a power law over time. Moreover, the cost begins to rise with the scaling of the density of the electrical interconnect, associated with additional costs due to fundamental physical problems at transistor nodes less than 10 nm (see here ). In contrast, a hybrid photon-plasmonic interconnect is currently costly due to the incipient scaling that is the goal of the American Institute for Integrated Photonics Manufacturing ( AIM Photonics). Scaling is now possible as a result of recent advances in nanophotonics; the concept of enhancing the interaction of light with matter makes it possible to create compact wavelengths in optoelectronic devices with the advantages of high energy efficiency and high operating speed due to low electrical capacitance (see here ). As a result, the break-even distance between electronics and hybrid photon-plasmon technologies is expected to shift further shorter distances as we move along the timeline. For example, the CMOS-based silicon photonic chip IBM demonstrated back in 2015 is close to breaking even (see here). Integrated photonics can only replace electronics if the speed of its CLEAR performance can catch up with the general evolutionary trend of computing systems.
conclusions
As we saw from the above reasoning, CLEAR can be considered as a universal technical and economic indicator, not only because of its broad hierarchical applicability (devices, interconnect, system levels), but also because of its ability to adapt to a specific technological application. For example, for network hybridization within a crystal. Not only can CLEAR be used as a performance metric to predict the evolution of a technology platform, but it is also possible to compare the overall capability of the technology platform (s) under different conditions of use by adding weights to each factor in equation (4) .
In this originally proposed CLEAR metric, all five factors linearly affect the CLEAR value, however, for a particular application that is critically dependent on a particular factor (or combination of factors), each factor in CLEAR can be weighted differently. To ensure comparability, even among such “tuned” metrics, it may be necessary to ensure that the sum of all coefficients equals 5, similar to normalizing to unity, such as the integral of the wave function in quantum mechanics. For example, a portable device system may have severe energy (E) and volume (A) constraints, resulting in a CLEAR metric C 0.8 L 0.8 E 1.2 A 1.2 Rfor such technology. Indeed, it would be interesting to compare trends from different tuned metrics with the ability to predict technologies in the future.
In addition, we can perceive future communication channels or networks to be dynamically reconfigurable, allowing the chip to change its ideal operating point depending on the current application, load, power mode, etc. Such dynamic data driven systems ( DDDAS) are in demand because of their combined cognitive processing ability. It is expected that the adaptation of computer systems to many constraints will have synergy with emerging information theory systems such as neuromorphic and reservoir computing, where adaptation and tuning of "weights" enable machine learning, arithmetic of residuals, or even embedded silicon photonics of optical computing. (see here , here , here and here ).
It is also worth noting that, as has happened with all previous performance prediction metrics for technology platforms, CLEAR may eventually begin to deviate from its original trend when more unique physical features are used in the new technology. At present, CLEAR adequately covers all the dominant performance factors in modern technologies, which makes it possible to accurately predict the evolution of computing systems at the time of this writing.
Thus, CLEAR can be not only a tool for mapping and forecasting prospects, but it can also pave the way for hardware-based smart and cognitive computer control platforms, where trade-offs between performance and cost are reviewed and optimized in real time.
As a result, CLEAR can be viewed as a new Moore's law, which integrally reflects the trends in the development of technologies at various levels of hierarchical application.