As an introduction ...
Industrial exploitation requires knowledge of how an application lives. This thesis should be taken as an axiom. This knowledge is the metrics produced by the application. Metrics can be either purely technical (for example, the amount of RAM consumed) and business (for example, completed orders).
By itself, a cut of metrics at the moment is not always interesting and indicative. Basic questions arise about collecting, storing and displaying these metrics.
The situation with the need for metrics and the way they are processed becomes more acute when a service approach is used and one application, from the user's point of view, is supported by the operation of several interacting services. Add cloud deployment to that and reap the hot pepper .
What is it about
The project I'm participating in is just using services and deployed to AWS (Amazon Web Services). Most of the services are built using Java 8+, Spring Boot and Docker. The lecture at Luxoft IT Sreda # 7 and this article grew out of the needs and objectives of the project.
My goal is to look at the practical side of collecting application metrics using Spring Boot and exporting them to AWS CloudWatch . This will, in fact, be a step-by-step guide with explanations, analysis of nuances and possible rakes.
When we talk about solving a practical problem, it is important to understand its symptoms in order to compare it with the existing environment. Is it possible to apply what we are talking about one-to-one or if adaptation is required, more research.
Let's take a look at what our current context consists of:
- As a given, our application or service is based on Spring Boot. As a Maven builder, Java 8+
- Docker. However, its use is not critical. It is important that for an application running in docker everything will work too
- AWS EC2 is our infrastructure where the application runs. At its core, it is a virtual machine within AWS.
- AWS CloudWatch is a monitoring system that is an AWS infrastructure dashboard.
Spring Boot
Let's move on to SpringBoot and its features that can help us. The first and most important thing in the arsenal is Actuator . This module allows you to look inside a running application and, to a certain extent, customize its behavior. For instance:
- Health check:
- , , runtime.
- ,
- , , : , , GC.
- ...
Like many Spring components, Actuator is similar to a constructor and can be customized, extended, and fine-tuned. You can start studying from here .
Of the entire set, we are currently interested in metrics. Actuator and metrics in particular are not only extensible, but also pre-configured, so there are only a couple of dozen categories of metrics available out of the box. Of course, you can register your own metrics. If the web module is connected in the project, the metrics can be obtained by contacting
endpoint /metrics.
Collection and delivery of metrics is implemented through the micrometer library , which is a product of Pivotal(now part of VMware), the same one that is developing Spring. micrometer is marketed as a vendor-independent facade for exporting Java application metrics.
The actuator will require the following starter to connect:
<dependency>
   <groupId>org.springframework.boot</groupId>
   <artifactId>spring-boot-starter-actuator</artifactId>
</dependency>
Spring Cloud
Next, we need a module from Spring Cloud, namely
spring-cloud-starter-aws.
Each module from the Spring Cloud family has its own versioning and it will be correct to use not a specific version of the module, but the BOM of a
spring-cloud-dependenciesspecific version (release train), where the compatible versions of the modules are collected. At the time of writing, this is Hoxton.RELEASE.
In addition to tasty autoconfigurations for working with AWS
spring-cloud-starter-aws, it provides as a transitive dependency aws-java-sdk.
In the dependencyManagement section, put
<dependencyManagement>
...
   <dependencies>
       <dependency>
          <groupId>org.springframework.cloud</groupId>
          <artifactId>spring-cloud-dependencies</artifactId>
          <version>Hoxton.RELEASE</version>
          <type>pom</type>
          <scope>import</scope>
       </dependency>
   </dependencies>
...
</dependencyManagement>
And depending on:
<dependency>
   <groupId>org.springframework.cloud</groupId>
   <artifactId>spring-cloud-starter-aws</artifactId>
</dependency>
Micrometer registry
We now have a micrometer in the Spring Actuator and
aws-java-sdk. Out of the box, micrometer cannot export data to AWS CloudWatch, this requires an appropriate implementation of MeterRegestry, a micrometer abstraction for collecting metrics. The default is SimpleMeterRegistry, which stores data in memory. The required implementation is connected along with micrometer-registry-cloudwatch. At the time of this writing, the current version is 1.3.5.
<dependency>
   <groupId>io.micrometer</groupId>
   <artifactId>micrometer-registry-cloudwatch</artifactId>
   <version>1.3.5</version>
</dependency>
The final pom.xml, in our case, looks like this: github.com/MrArtemAA/blog-demos/blob/master/export-metrics-to-cloudwatch/pom.xml
app.properties
Let's move on to setting up application properties, which in our case play an important role:
1
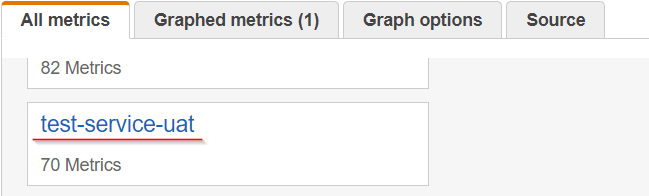
management.metrics.export.cloudwatch.namespace.: you need to specify the namespace under which the metrics will be saved in CloudWatch. Because in the metric itself there is no information from which instance of the application the data came, the namespace will just determine the metrics of a particular instance. Otherwise, if you define one namespace for several instances, the metrics data will be mixed and it is not clear where they came from.
2
management.metrics.export.cloudwatch.batch-size.: it is required to explicitly set the value of the batch-size property to 20. What is this parameter and why exactly 20? Metrics are sent to Amazon CloudWatch clients asynchronously, in batches of 20 (this is the AWS limit) at a time.
3
cloud.aws.stack.auto=false.: need to disable AWS CloudFormation stack autodetectionsince it defaults to = true. This property is responsible for whether the application will try to automatically get the stack name to configure the application for the cloud environment (in the infrastructure-as-code paradigm). When deploying on EC2, as on a regular virtual machine, this information is not available.
It is important to understand that all information that the AWS SDK will try to get on its own without additional configuration, it [the library] will take from the EC2 metadata . To obtain this information, there is a special service endpoint, where the call is made.
Debriefing
batch-size
Let's go back to the property
management.metrics.export.cloudwatch.batch-sizeand the need to set it equal to 20. It would seem that all this can be done at the level of the corresponding libraries working with AWS. Indeed, micrometer-registry-cloudwatchthere is an interface with a CloudWatchConfig defaultmethod that correctly checks the value and throws an exception if it exceeds 20. However, if you look org.springframework.cloud.aws.autoconfigure.metrics.CloudWatchExportAutoConfiguration, we will see that the configuration is done usingorg.springframework.cloud.aws.autoconfigure.metrics.CloudWatchPropertiesConfigAdapter:
@Bean
@ConditionalOnMissingBean
public CloudWatchConfig cloudWatchConfig(CloudWatchProperties cloudWatchProperties) {
  return new CloudWatchPropertiesConfigAdapter(cloudWatchProperties);
}
The adapter, in turn, overrides
batchSize()as
@Override
public int batchSize() {
  return get(CloudWatchProperties::getBatchSize, CloudWatchConfig.super::batchSize);
}
This means that if a
CloudWatchPropertiesproperty is defined, it will be taken from there. It does not contain the necessary checks, and if the property is not explicitly set, the default value will be 10000.
Requests to AWS
An application (service) cannot just make requests to Amazon services. They [requests] must contain credentials. To do this, the AWS SDK has a credential provider chain , which is recommended. Among these providers is Instance Profile, which can receive data based on EC2 metadata. For this to work, you need to make sure a role is bound to EC2 .
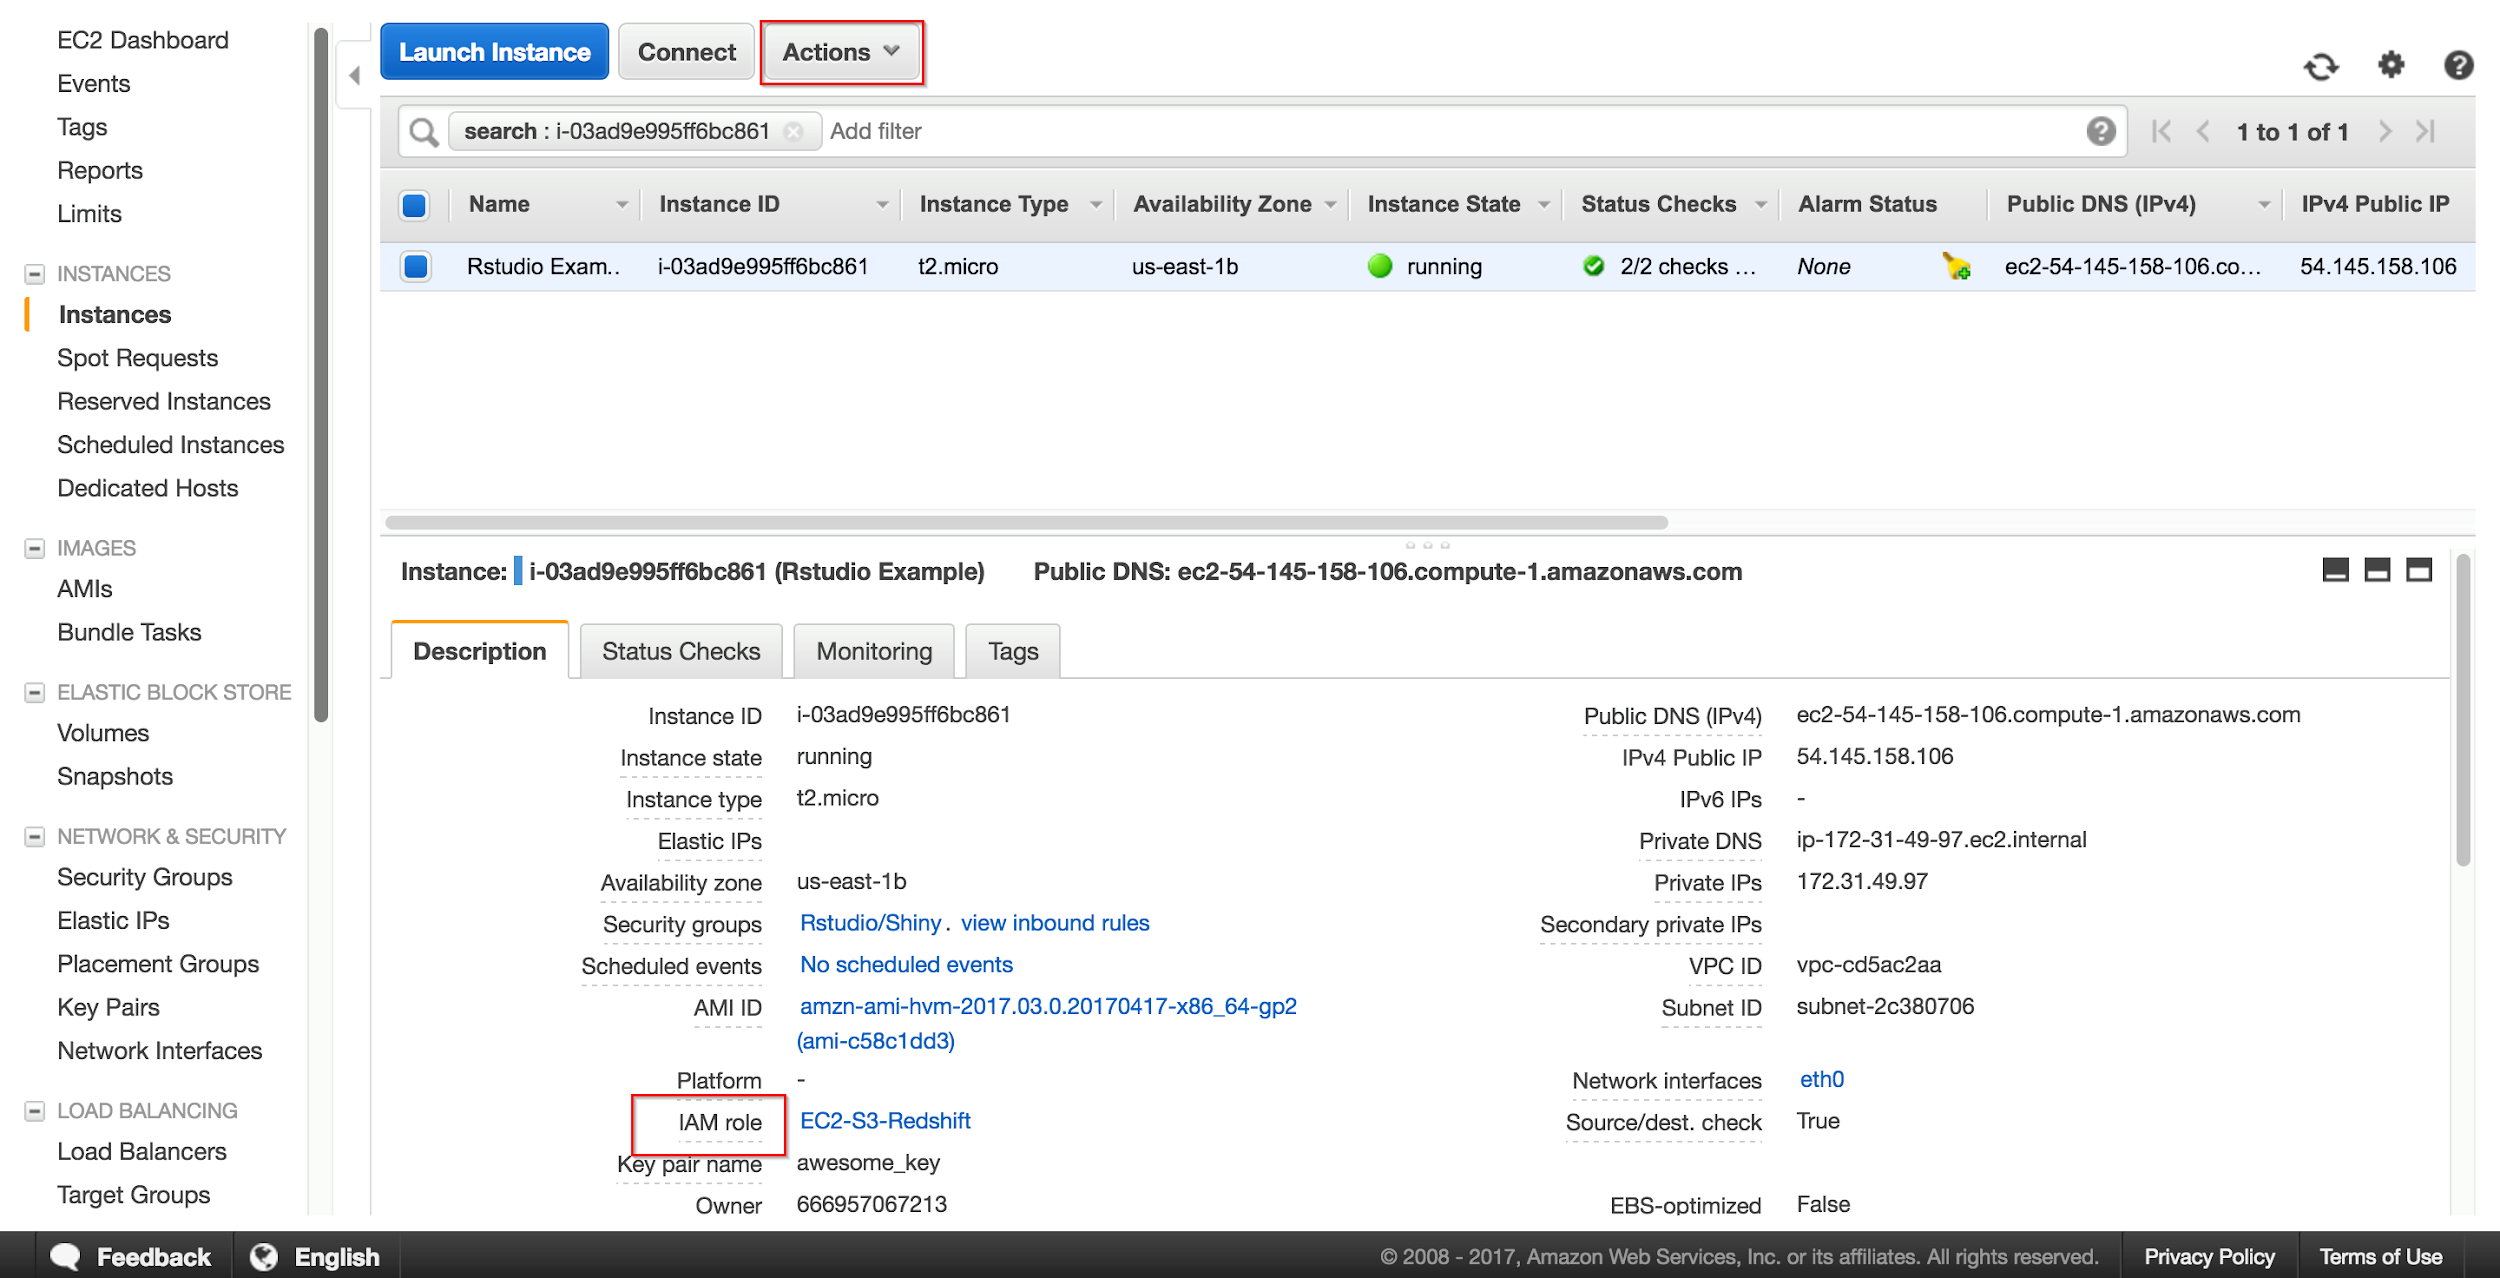
The role must grant permissions to make requests to CloudWatch and be available to EC2. The role can be specified both when creating a new EC2 instance, or attached to an existing one. The role is applied on the fly.
Disabling metrics
For a local build or test environment, exporting metrics may be overkill. Setting the property
management.metrics.export.cloudwatch.enabled=falseallows you to disable the export of metrics to CloudWatch, while the collection of metrics will be performed and, if you have a web module connected, endpoint /metricsthey will still be available.
Micrometer collects and delivers a wide variety of metrics. If some of them are not needed, you can disable them. You can disable both individually and by whole categories. So, for example, the property will disable all metrics whose id starts with . Please note: disabled metrics will not be collected at all.
management.metrics.enable.some.metric=falsesome.metric
Running all AWS
Another surprise awaits if you try to run the application with the minimum required settings all AWS. For work, the necessary data of the region where the application is running. As we already know, whatever is not explicitly stated, the AWS SDK will try to get from the metadata ... which is not there. Therefore, we explicitly indicate the desired region through the property
cloud.aws.region.static=us-east-2. As in the case with the name of the stack (property cloud.aws.stack.auto), there is a property that is cloud.aws.region.autoequal trueby default. But simply setting the value to false will not help us, since the value of the region is needed.
Also, as we remember, requests to AWS require credentials, so if you need to send metrics to CloudWatch (or make other requests to AWS), you must explicitly specify the parameters for the credentialsvia, for example, application properties or environment variables.
Passing through application properties looks like this:
cloud.aws.credentials.access-key=YOUR_ACCESS_KEY


cloud.aws.credentials.secret-key=YOUR_SECRET_KEY
Outcome
As I think you may have noticed, getting the whole scheme to work and transferring metrics from the application to CloudWatch is not that difficult: it took 3 dependencies and 3 properties .
The most important thing is in the details. Libraries (frameworks) such as Spring, AWS SDK try to make life easier and do all the work for us as much as possible, but at the same time, any step aside can lead to the appearance of a stacktrace, attempts to understand why the metrics are not going anywhere, why the application does not start at all and how to fix it. A section with a breakdown of nuances and a description of some of the details of how EC2 and CloudWatch services work, I hope, will facilitate your understanding of what is happening.
If we talk about using CloudWatch itself, then, in my opinion, this is a fairly natural choice when using the AWS infrastructure.
Metrics are the eyes and ears of our application, but this does not negate the fact that you need to understand how metrics are collected, counted and displayed. What kind of data will you see on your charts. This issue will be especially acute in the event of anomalies and analysis of incidents. If we talk about the micrometer library, it is worth referring to the documentation , there, for example, it is described in some detail about the types of meters (Meter).
Links
The exchange of experience allows us to quickly master various approaches, tools, technologies and move forward. Therefore, I can not ignore the most useful materials on the topic, which were not referenced during the article:
Spring Boot: Metrics With Micrometer and AWS CloudWatch
Spring Cloud. Using Amazon Web Services. Spring Boot auto-configuration
Spring in Action 5, Craig Walls, Manning
Popular about Amazon Web Services The
finished project can be found on GitHub .