Gradually, this idea moved to implementation, there were thoughts for improvement, monitoring of hosts appeared, then monitoring of applications, and, like the icing on the cake, incidents with notification.
As a result, we got a full-fledged monitoring system, which is a completely open-source self-host solution that does not have external communications, with completely user-defined incidents.
And in this post, we want to introduce you to the resulting product.
Technical details
A microservice architecture was chosen for development. The backend was developed in GoLang as a fast and convenient language for developing microservices. We used gRPC to communicate between services. In addition to the fact that gRPC works on HTTP / 2 with all that it implies, the description of the service interfaces through proto will allow you, as users, to create your own implementations of individual parts of the system, if necessary.
The project uses Mongo as a quick access database and Postgres for storing collected statistics.
Bazel was used for assembly and deployment. Bazel allows you to declaratively describe dependencies and relationships between packages in Golang. In addition, we started testing Bazel with a remote cache, which has a positive effect on the speed of the system. Bazel also collects all applications in Docker and organizes Unit testing. All of this is integrated into Github actions.
The dashboard of the system is written in Angular 9.
We try to keep the bar in unit tests, at the moment every entity is covered. In the near future, the implementation of integration and E2E tests is planned for the most complete support of the system
System Description
As mentioned above, Squzy is a set of microservices interacting with each other, each of which deals with a separate task.
List of services:
- Agent Client — , . , . Agent Server.
- Agent Server — , . Mongo, Storage.
- Application Monitoiring — , / Squzy , . GoLang NodeJS, — PHP & Java .
- Monitoring — external/internal .
- Storage — . Postgres, ClickHouse.
- Incident Manager- . ( ). Mongo, Storage.
- Notification Manager — . Webhook & Slack.
- API — API Gateway
The service interaction scheme is as follows:

To demonstrate the capabilities of Squzy, a demo has been developed that monitors its own server and allows you to monitor the system on the dashboard: https://demo.squzy.app/ .
Some features, such as adding / removing new entities, are disabled in the demo, but it allows you to see and feel all parts of the system. Below we will dwell in more detail on each of the types of monitoring.
This part of the system is responsible for external / internal checks. At the moment, it allows you to send requests and expect responses to the following types of endpoints:
- Tcp - open port check;
- gRPC - protocol check ;
- Http - check for compliance with status code;
- SiteMap - checking that all URLs from the Sitemap respond with 200 OK ;
- JsonValue - collection of specific values from the JSON response.
Squzy allows you to add custom headers to all kinds of HTTP checks.
The interface for adding a check through the Squzy dashboard looks like this:
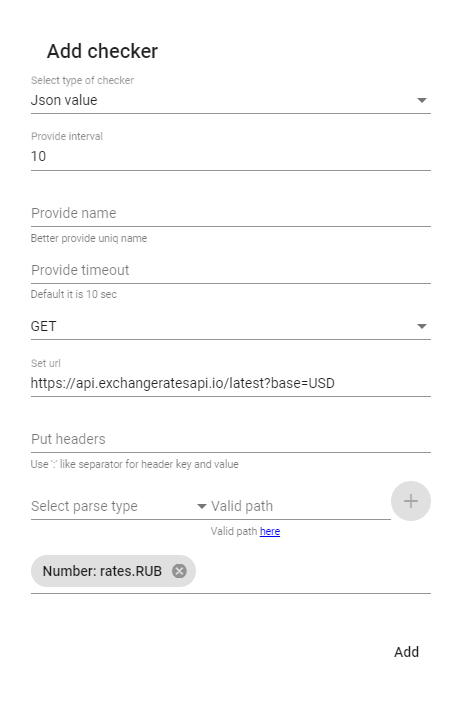
Here interval is the interval between checks in seconds, and timeout is the time after which the check is considered unsuccessful.
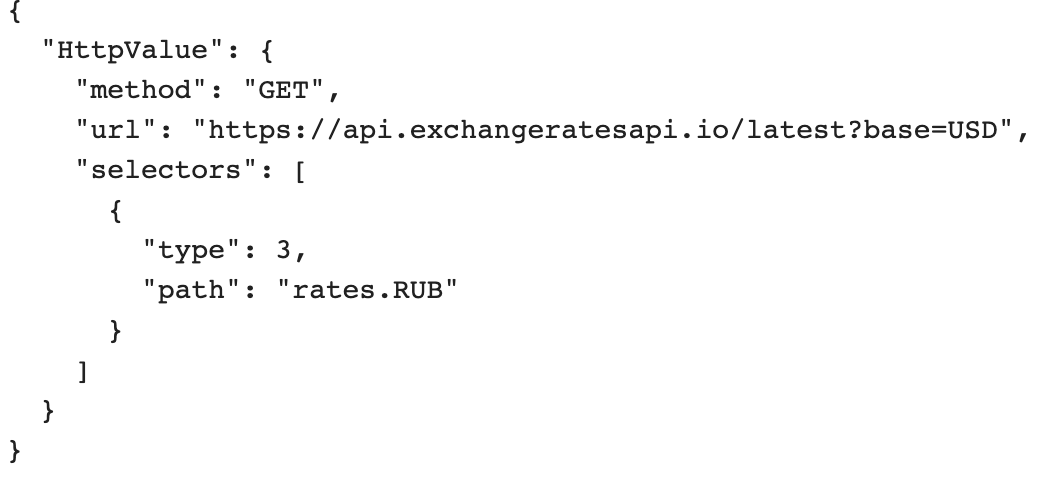
After creation, the user has access to the checker configuration:
For each type of check, you can write an incident rule. More details about incidents will be described below, but here we will just give an example:
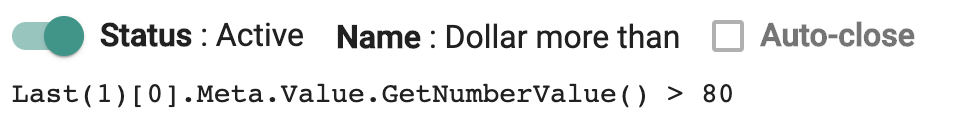
In this case, we measure the value of the dollar exchange rate from the site, and if it is more than 80 we will create an incident.
Link to demo.
Incidents can be created on:
- Duration of verification (time of receiving a response from the server);
- Status (returned status code);
- Value (information transmitted in the checker).
Squzy agent
To monitor hosts in the system, the Squzy Agent installed on the server is used. It is currently collecting the following statistics:
- CPU - processor load;
- Memory - Used / Free / Total / Shared;
- Disk - Used / Free / Total for each of the disks;
- Net - for each network interface.
Agent Timeline:
- The agent registers with the Agent Server and receives an ID (during registration it is possible to specify the monitoring interval and agent name);
- The agent sends statistics to the server at a certain interval;
- ….
- The agent notifies the server about shutdown.
If there is no connection to the server, the agent continues to collect statistics and they will be sent when the connection is restored.
The demo version of the agent can be viewed here: https://demo.squzy.app/agents/5f142b6141a1c6518723483a/live The
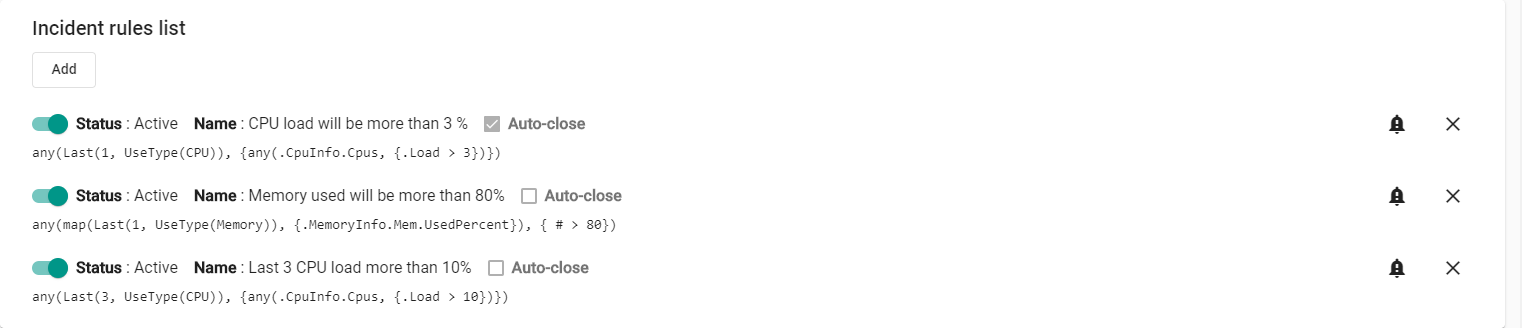
agent can also have a set of rules for checking incidents:
Squzy Application Monitoring
For monitoring applications, integrations have been developed with popular frameworks for Go / NodeJs (more further, as successful marketers say). Integrations determine the type of transaction ( Http / Router / gRPC / WebSocket / etc) and parse responses from engines / requests.
Squzy also supports Transaction Tracing, which allows you to monitor related transactions of multiple servers / services. An example of monitoring such transactions on the Dashboard: https://demo.squzy.app/transactions/om8l8LP96PRsvx67UxkES .
Libraries for integration into Go and Node Js.
- Go - https://github.com/squzy/squzy_go (GIN / gRPC / Http);
- NodeJs - https://github.com/squzy/squzy_node (Express) + FE (Angular + vanilla).
At their core, libraries are middleware that timed the time before sending a transaction and the time after it was processed and analyzes the response. We also wrote a sample GO monitoring application: https://github.com/squzy/test_tracing.
You can create your own transactions and measure their execution times, statuses and errors. For this, use the Core package. For ease of product support, all languages will use the same name for the packages that define the behavior.
You can create incidents per transaction based on the following data:
- Duration of the transaction;
- Transaction status;
- Errors received;
- Transaction type.
Squzy Incident Manager + Notification Manager
Incidents in Squzy are rule based. When adding a new entity to Storage, the described rule is checked, and if it is, an incident is created (if it has not already been created).
The rules are an extended version of expr , to which specific rules are added, taking into account the system specification, such as Last (takes the last n records from Storage), Use (use a specific filter for this), and so on. A detailed description of all the rules can be found at https://squzy.app/usage/squzy-incident/incident-rules , here we will focus on an illustrative example.
Let's say you have a server with 1,792 processors, 256GB of RAM, and 16TB of hard disk space. And you really want to check that your devops is not running Doom on the CPU load monitor. You know that maintaining a one page site that serves your server never loads 100 percent more than 8 processors for more than a minute. In addition, the RAM is more than half free. While the hard drive has a whole TB of free space in reserve (if you don't store well-known archives at home, your wife will see). In this case, knowing that metrics are collected every 10 seconds, you can define the following rule to check that your server is working correctly:
any(Last(7, UseType(All)),
    {all(.CpuInfo.Cpus, {.Load > 80}) &&
    .MemoryInfo.Mem.UsedPercent < 50 &&
    .DiskInfo.Disks["System"].Free > 1000000000000}
)
Similarly, Squzy allows you to describe various patterns of unwanted system behavior.
After the rule check is successful (or rather, unsuccessful), an incident is created and the user is notified, if configured.
An active incident, that is, an incident that has not yet been verified by the user, can be closed automatically, that is, if it has not passed the verification at some point, if the appropriate option is selected.
For each checked entity, be it an application / checker / agent, you can create your own notifications about incidents.
Conclusion
We are now in the process of collecting feedback and comments from the IT community.
We already have a number of plans for product development:
- adding Java / PHP integrations;
- database checkers;
- migration from Postgres to ClickHouse;
- more notification methods;
- integration with kubernetes;
- improvement of documentation;
- GQL API;
- Integration and E2E tests;
- monitoring of mobile applications.
- Autocomplete for incident rules on the UI
We will be glad to receive any feedback or suggestions.
Links
- System backend: https://github.com/squzy/squzy
- Frontend systems: https://github.com/squzy/squzy-dashboard
- Demo dashboard: https://demo.squzy.app/
- Documentation: https://squzy.app/
- Authors: PxyUp DreamAndDrum
PS:
Thanks for the article Vonotirax
Try in 1 click