The article is useful for those who work with Android applications, launch advertising campaigns in them, analyze the results, and who are upset that Google Analytics can no longer be used for this. The article contains instructions on how to connect BigQuery to Firebase and render beautifully in Data Studio.
Axmor has been developing mobile applications since 2010. In 2016, one of the largest airlines in Russia ordered us to revise and further develop its Android client application for ticket sales. Among other things, our tasks included the development of tools for collecting analytics for promotions, which regularly take place inside the application, and providing data in a visual form.
Until 2020, we used Google Analytics for these purposes - as well as in our other applications. But on February 4, the corporation turned off this feature and recommended switching to Firebase Analytics. It turned out that this SDK (from the English software development kit) does not provide all the possibilities that the previous one provided, in particular, it does not allow building non-standard reports.
What are the limitations of Firebase Analytics and what to do with them
To describe our experience in solving this problem, let's turn to the application for selling air tickets. When Google Analytics turned off and Firebase Analytics came to replace, we were faced with the task of maintaining the same depth of analysis of user behavior for the customer, leaving the ability to quickly set up new non-standard reports and at the same time provide beautiful accessible visualization.
In Google Analytics, we could see which screens users go to, which destinations they are looking for tickets, from which cities they are, how many of them are authorized in the application, and how many are anonymous. Plus, we always saw how much tickets were bought for each direction, how sales for certain directions increased after the promotion, and so on. With Firebase Analytics, this second part of the statistics, in which we could analyze in detail the conversion, was only available in raw form, which means we need a way to enrich it.
Here's what we can do in Firebase Analytics:
- set up purchase events;
- in the parameters we indicate the name of the product - the direction or its identifier and price;
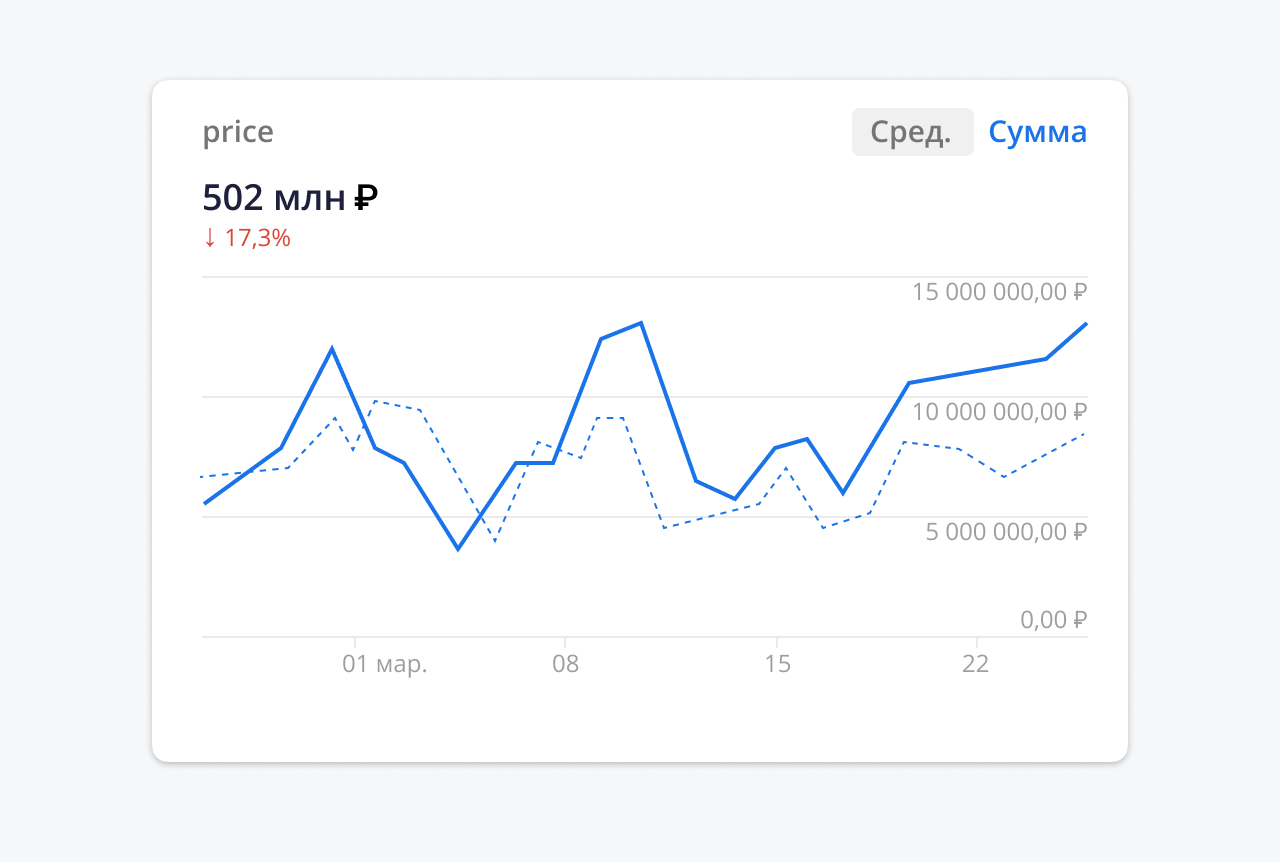
- then, in the report on the website, we can see how many tickets were sold for which flight, the average purchase price, how much total purchases were made.
The information in the illustrations does not correspond to the real ones; all figures have been changed in the interests of trade secrets. This does not affect the meaningfulness and clarity of the example, we basically only show the capabilities of Firebase.
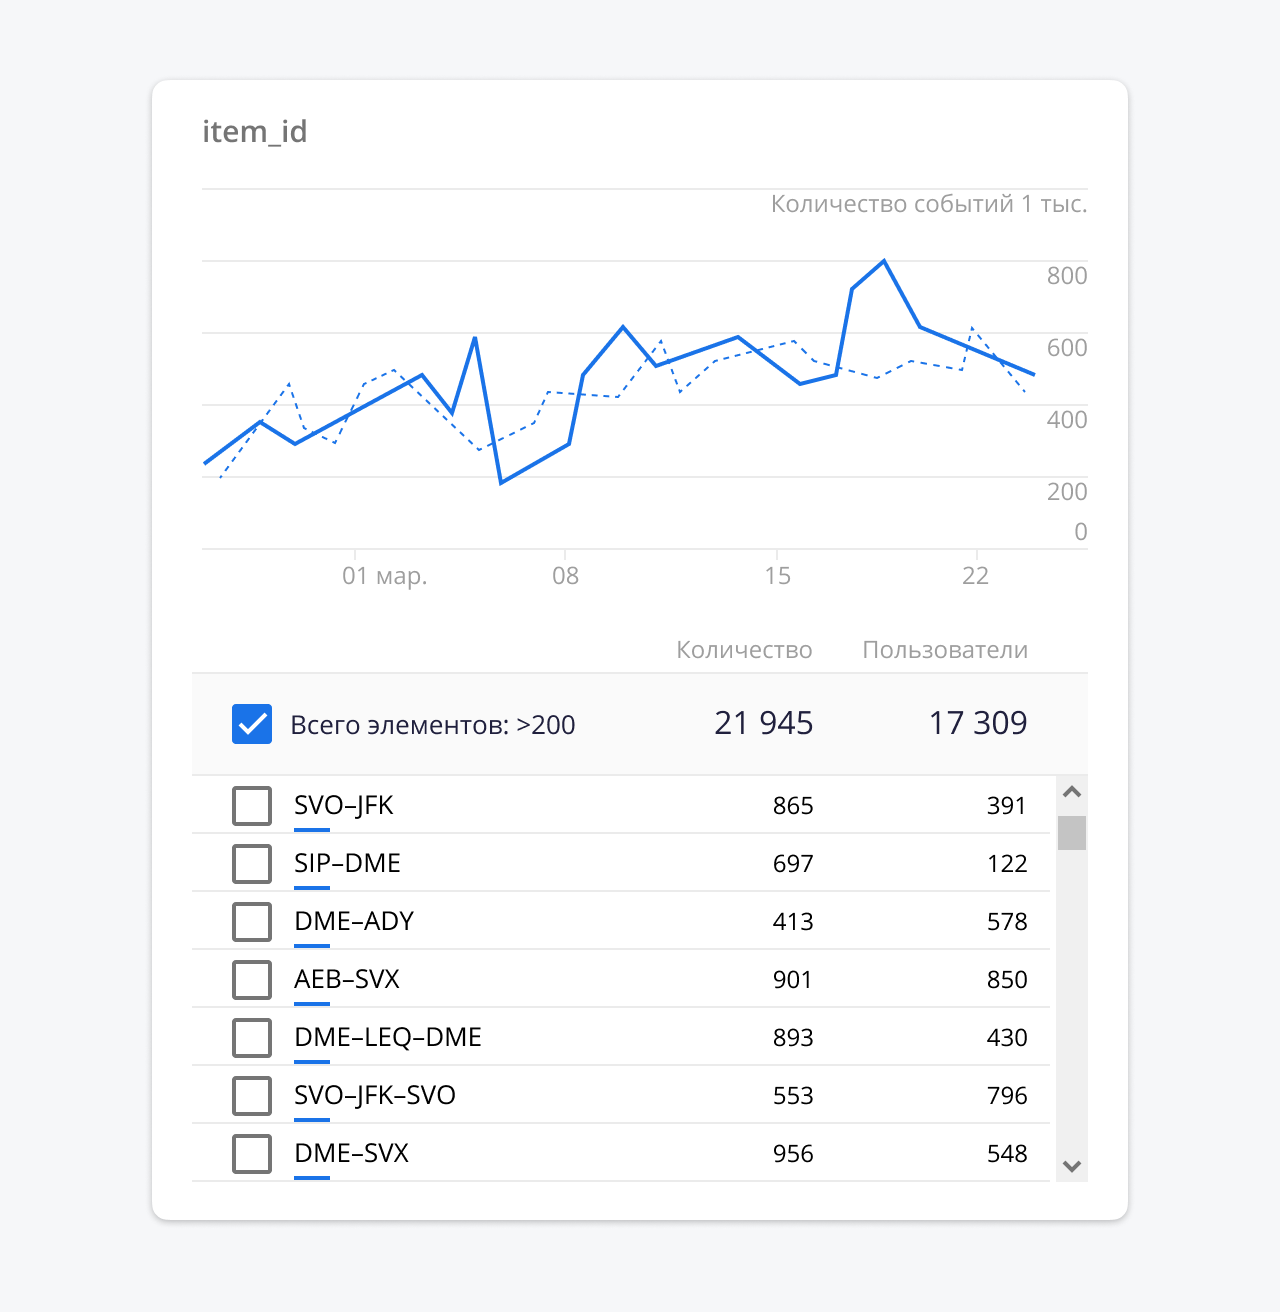
Here we can see for which direction how many tickets have been purchased by how many users. The customer wants to know, for example, how much they bought tickets for the Yekaterinburg-Moscow route. Firebase Analytics does not provide such answers.
The information content of the report is limited by the standard set of parameters - we see only the general picture.
Another example of data analysis, which in our case could not be fully implemented in Firebase Analytics: the application displays internal ads for flights and directions. The customer wanted to know how many users who viewed the ad subsequently bought tickets. And, of course, with a breakdown of income by commodity, stock, and so on. Again, standard tools did not give us this opportunity.
How to use BigQuery to analyze sales inside an Android app
We started looking for a way to get quick visual reports in different sections. In cases where deeper data analysis is needed, Google recommends connecting the BigQuery web service. But in our understanding, it was like a cannon on the sparrows, because the tool is claimed to work with big data. However, upon a detailed study of the tool, it turned out that it is suitable even for tasks where analysis of a relatively small amount of data is required, but at the same time non-standard. For sure, over the past couple of years the Big Data concept has changed - now it's all that is inconvenient to process in Excel.
BigQuery connection
Connecting BigQuery to Firebase Analytics is simple. On almost every Firebase Analytics page, Google suggests doing this. There are detailed instructions for this.
The only caveat is that to connect BigQuery to event data, you need to switch to the Blaze payment plan in Firebase. This means that you will be charged for Firebase services as you use it. In our experience, BigQuery services are inexpensive when used carefully on small projects.
On a free plan through BigQuery, you can only access Crashlytics, Predictions, Cloud Messaging and Performance Monitoring data.
You need to understand that BigQuery is not part of Firebase Analytics. It is a separate Google service designed to handle large amounts of data. In this case, Firebase Analytics for BigQuery is one of the possible data sources. Connecting BigQuery will enable you to find correlations and more insights.
What happens after connecting
After connecting BigQuery to Firebase Analytics, we get the opportunity to see the data that is collected in raw form. We only get access to the data that was collected after BigQuery was connected to our project. If you connect BigQuery today, then you can process the data that was received starting from today, yesterday's data will not be.
So, we connected everything, we go to the main page of the service. We see our project in resources. There is one table in the data -
events. All data from Firebase Analytics is collected here.
In fact, this is not one table. Data for each day is placed in a table with a name
events_<>, for example events_20200308.
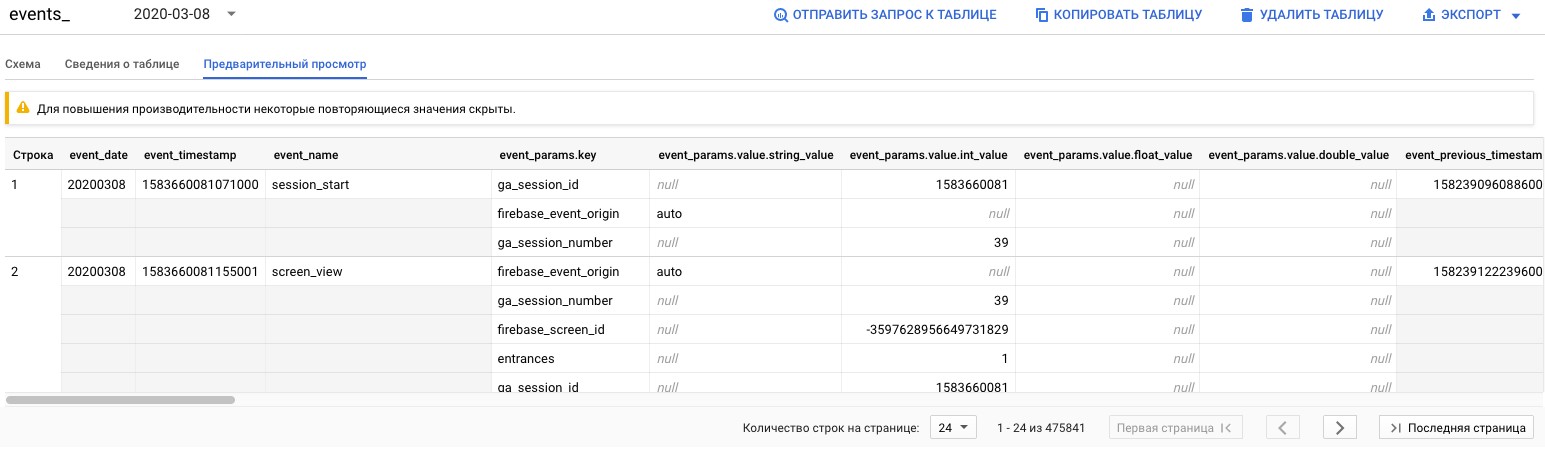
Let's look at the data itself. All events from Firebase Analytics are recorded in tables
events_*. Each row in the table is a separate event. Numerous columns represent event parameters: date, device information, user information, and so on. Although the data is displayed in a table, it is not entirely ordinary. It is rather a tabular representation of a tree structure. Below is an example of the JSON structure of a table row. For brevity, not all data are included in the structure, but the overall picture can be understood from it:
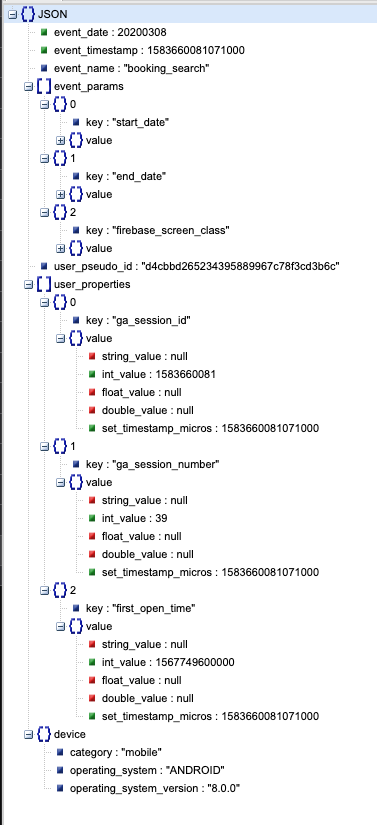
Looking at the data structure, you can see that it contains:
- . , - . :
event_date,event_timestamp,event_name. - -. , ,
event_paramsuser_properties. — . . — --. , - -. —
device. . —device.category,device.operating_systemdevice.operating_system_version.
If the data structure seems complicated at first, then on closer examination it becomes easier. Ultimately, we have information on all events from Firebase Analytics in our hands. And we just need to pull out the data that we need from it.
Let's try to make some requests. For example, let's display all dates of events:
SELECT event_date

FROM `project_name.data_set.events_20200202`
We will see the result:
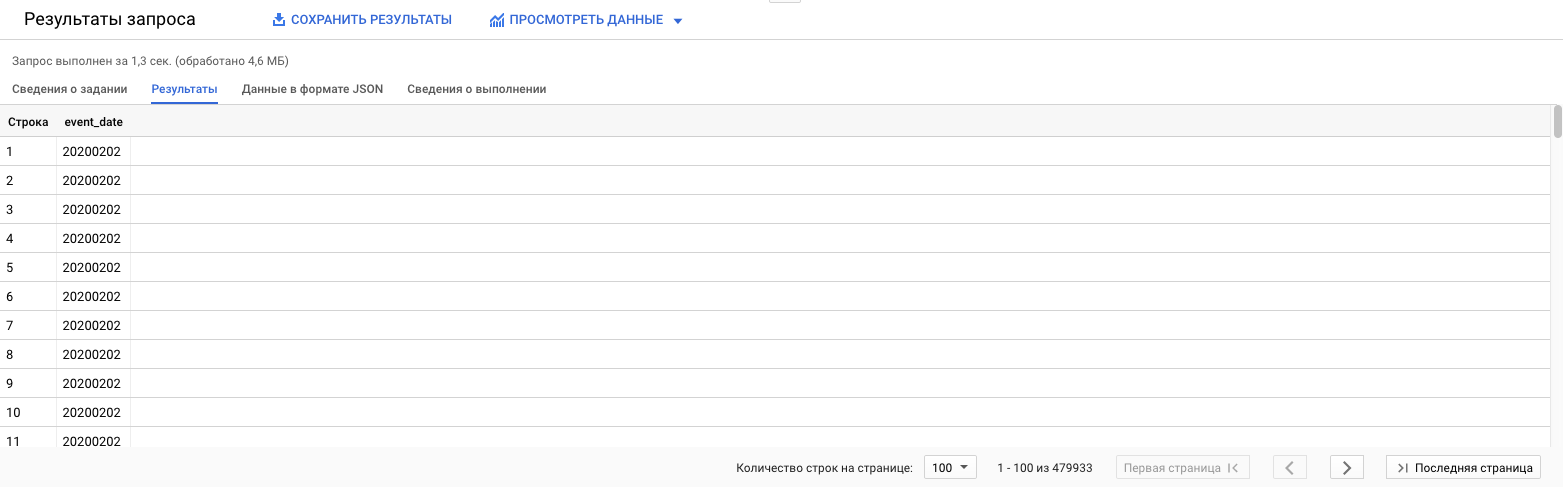
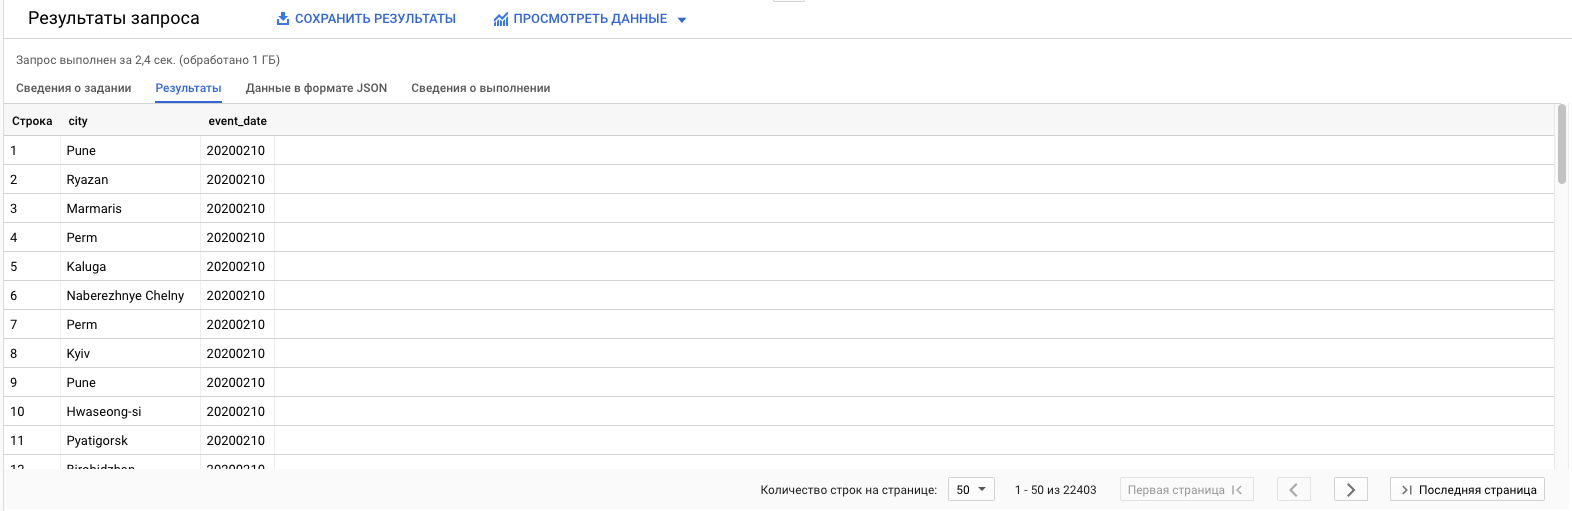
project_name.data_set.events_20200202in this case, the name of a specific table, which consists of the name of the project, the name of the dataset, and the daily table with events from Firebase Analytics. That is, in this query we got the dates of events from the table in which there were events for February 2 :) Not very useful, but as an example of a query it will do. In reality, it is more useful to sample from all available data. In this case, you can specify instead of a specific table project_name.data_set.events_*. Let's add usefulness to the request and find out, for example, the dates and cities of events with the name "booking_purchase":
SELECT geo.city, event_date

FROM `project_name.data_set.events_*`

WHERE event_name = "booking_purchase" and geo.city != ""
We get:
Of interest are only special fields in the table - arrays. Eg
event_params. It is recommended to use the UNNEST operator to work with such fields . This operator takes an array field and turns it into a table.
Let's improve our query and display the parameter value
"direction":
SELECT
geo.city,
event_date,
(SELECT value.string_value FROM UNNEST(event_params) WHERE key = "direction") AS direction,

FROM
`project_name.data_set.events_*`

WHERE
event_name = "booking_purchase" and geo.city != ""
Result:
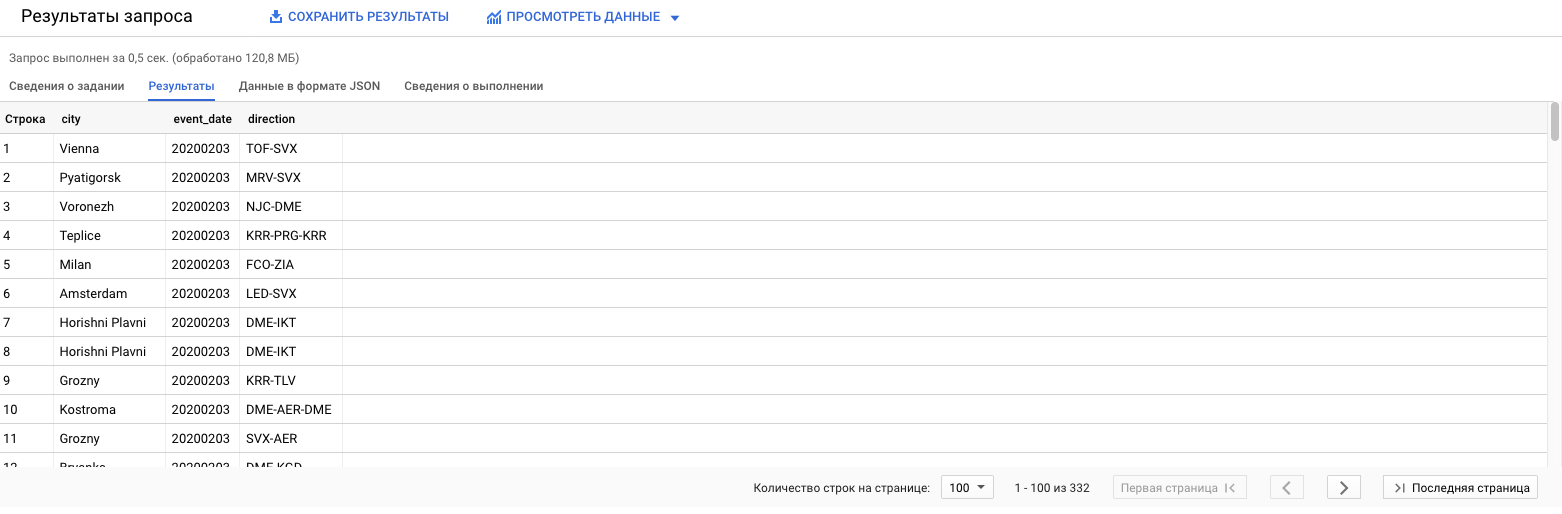
So what have we added. We have applied the UNNEST operator to the field
event_params. As a result, we got a table in which the lines are the parameters of the event, and the columns are the properties of these parameters. The parameters have two properties: key and value. value - an object with 4 fields: string_value, int_value, float_valueand double_value. These fields are needed for different data types, because the parameter value can be a string, int, float, double. Then, through the subquery, we pulled out the string value of the parameter with the field keyequal direction. This is how you can work with array fields in a table.
Let's get what Firebase Analytics couldn't give us - a breakdown of revenue for each product sold in the app:
- In Firebase Analytics, we pass the purchase event
"booking_purchase". - In it, we pass two parameters:
"direction"and"price". direction - product identifier, price - its price.
I would like to know how many of which products were sold and for what amount. The request to find out looks like this:
SELECT

direction,

count(direction) as count,

sum(price) as total_sum
FROM
(

SELECT

(SELECT value.string_value FROM UNNEST(event_params) WHERE key = "direction") AS direction,

(SELECT value.double_value FROM UNNEST(event_params) WHERE key = "price") AS price

FROM

`project_name.data_set.events_*`

WHERE

event_name = "booking_purchase"

)
group by direction
order by total_sum desc
Result:

We got the data we wanted.
How to render reports in Data Studio
Let's say a customer wants to come in and see sales statistics at any time. You can save the query and tell the customer that they can go to the BigQuery console, run the query and see the result. But Google offers a better solution.
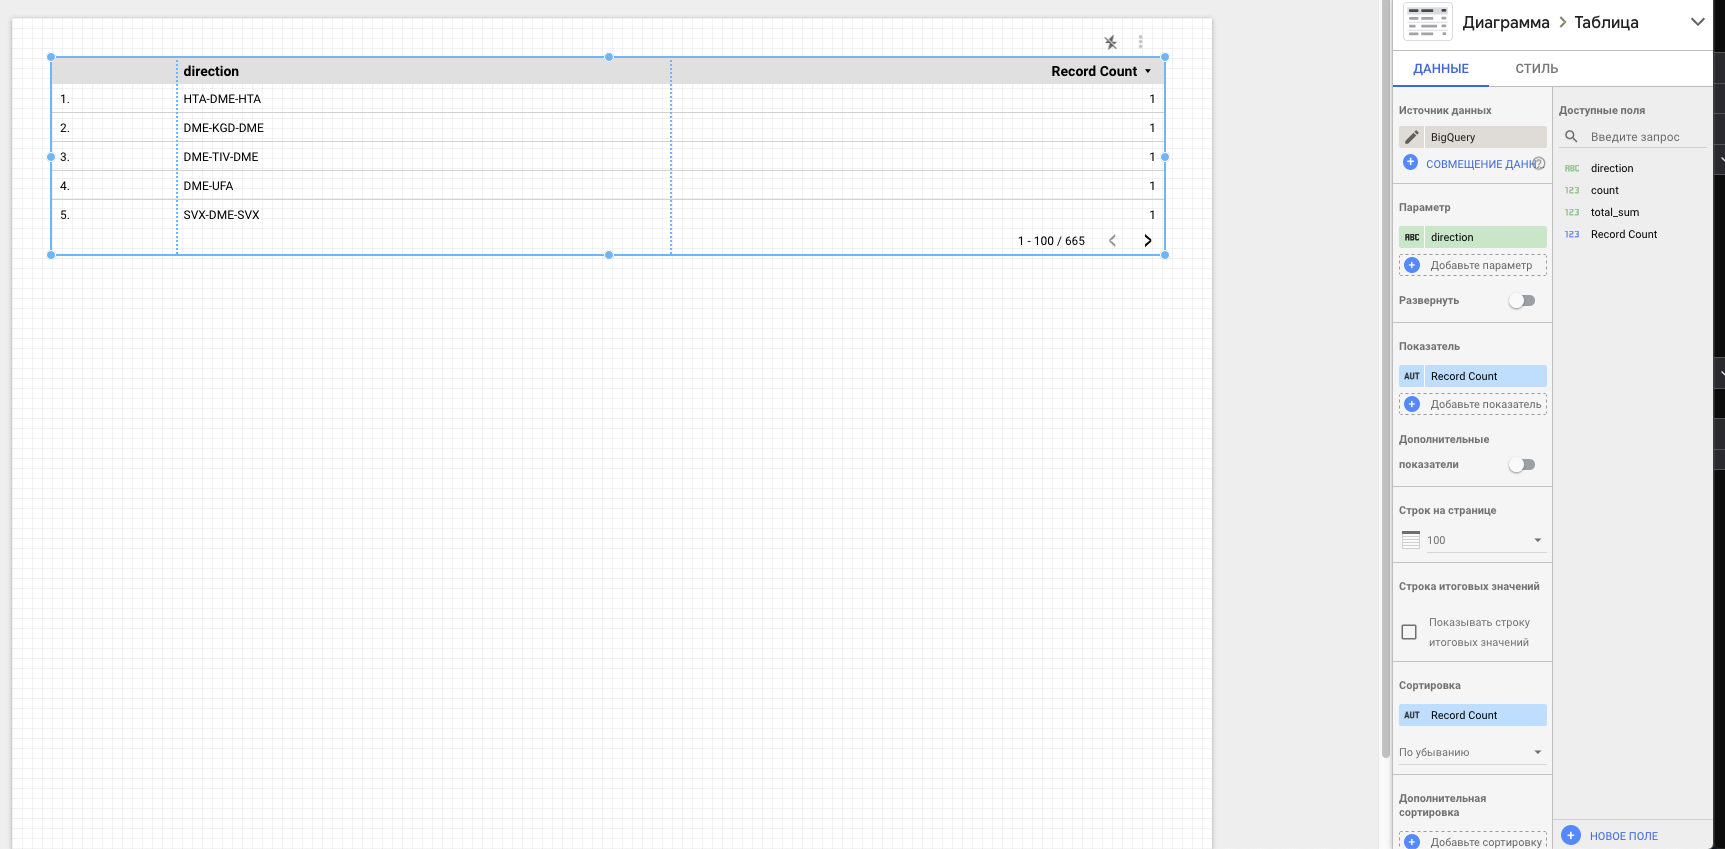
Query results can be visualized in the Data Studio service. The service allows you to present data in the form of tables, graphs, diagrams, beauty and functionality that are not inferior to those from Firebase Analytics. Let's see how you can do this.
To create a report, you need to go to the main page of the service and create a new document. Select BigQuery as a data source:
The report can be built from a table, a saved view, or directly by query. The latter option allows you to use date parameters. Using these parameters, you can restrict the data selection by date, thereby optimizing the amount of processed data. The result resembles the interface of Google Analytics and Firebase - about the same forms and functions. The corporation seemed to have taken its best practices in terms of visualization and made them publicly available:
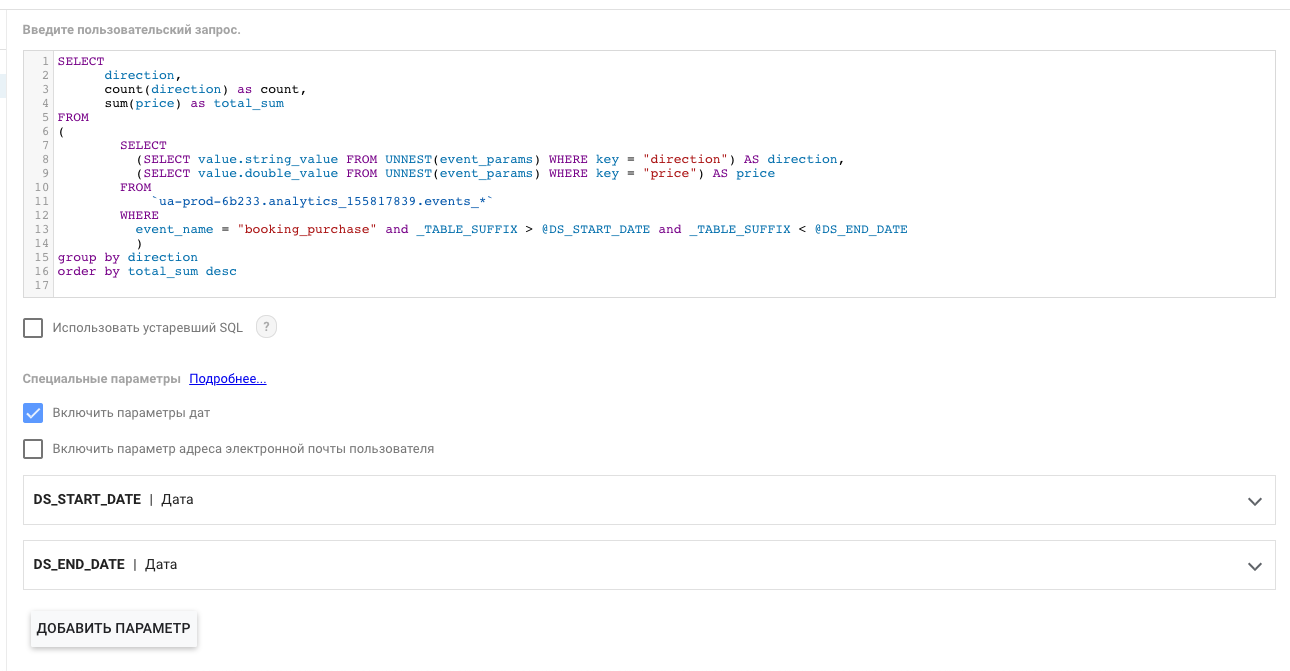
We added a condition so that the selection was only for those events that occurred between the parameters
DS_START_DATEand DS_END_DATE. These parameters will be passed to the request directly from the report forms. We create a report and immediately see something like this:
Next, you can add a date range selection. To do this, add the appropriate
component to the form :
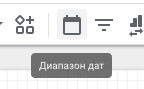
The dates selected in this component will go directly to the query as parameters
DS_START_DATEand DS_END_DATE. As a result, in view mode the report will look like this:
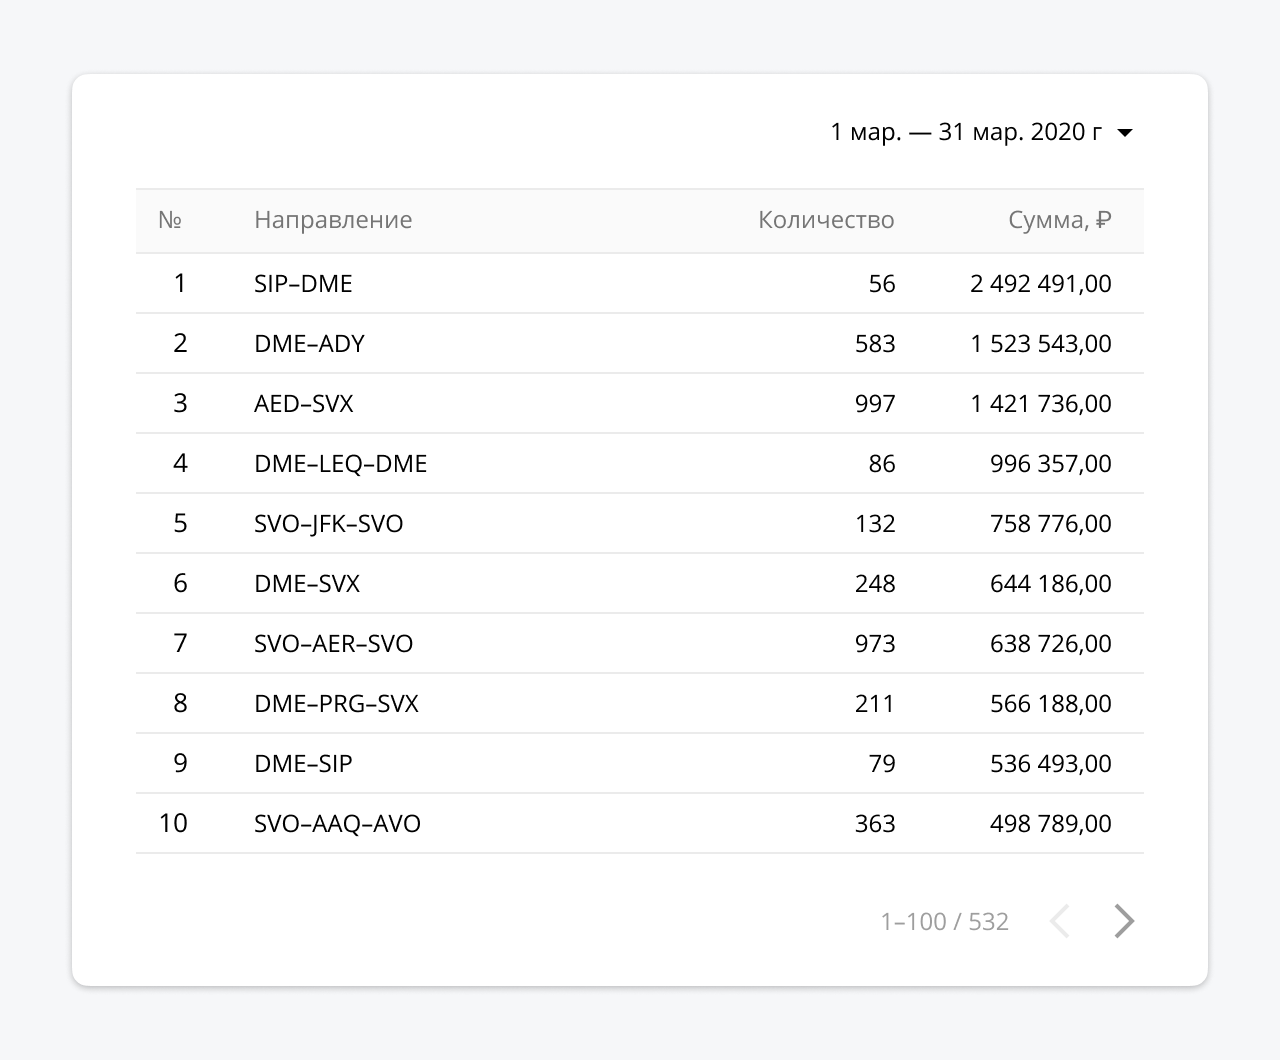
In the same way, you can add and customize other components on the form - graphs, charts, images, text, and so on. After that, the report can be shared via link sharing or by providing access to the required accounts.
BiqQuery is an effective tool not to be feared
Mobile apps are a powerful sales and marketing tool, especially when they take a data-driven approach. You should not be afraid of BiqQuery, and think that this tool is complicated, and in general, Big Data is too cool for you. BigQuery will elevate your analytics department to the level of Spotify, Delivery Food and other data giants and deliver the same performance they enjoy, for a fraction of the cost, with the simplest SQL that every progressive analyst must master, whether in marketing or marketing. in the product.
BigQuery benefits:
- It is quickly configured and allows you to process data in a matter of seconds. No servers, no expensive infrastructure and no administrator.
- , , , : , , -, CRM.
- , — .
- SQL — .
- Data Studio, .